Comparison of Subjective Responses to Oral and Intravenous Alcohol Administration Under Similar Systemic Exposures
- PMID: 30721544
- PMCID: PMC6443482
- DOI: 10.1111/acer.13970
Comparison of Subjective Responses to Oral and Intravenous Alcohol Administration Under Similar Systemic Exposures
Abstract
Background: Individuals perceive the effects of alcohol differently, and the variation is commonly used in research assessing the risk for developing an alcohol use disorder. Such research is supported by both oral and intravenous (IV) alcohol administration techniques, and any differences attributable to the route employed should be understood. Our objective was to test whether an individual's subjective responses to alcohol are similar when the breath alcohol concentration (BrAC) trajectory resulting from oral administration is matched by IV administration.
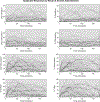
Methods: We conducted a 2-session, within-subject study in 44 young adult, healthy, nondependent drinkers (22 females and 22 males). In the first session, subjects ingested a dose of alcohol which was individually calculated, on the basis of total body water, to yield a peak BrAC near 80 mg/dl, and the resulting BrAC trajectory was recorded. A few days later, subjects received an IV alcohol infusion rate profile, precomputed to replicate each individual's oral alcohol BrAC trajectory. In both sessions, we assessed 4 subjective responses to alcohol: SEDATION, SIMULATION, INTOXICATION, and HIGH; at baseline and frequently for 4 hours. We compared the individuals' baseline-corrected responses at peak BrAC and at half-peak BrAC on both the ascending and descending limbs. We also computed and compared Pearson-product moment correlations of responses by route of administration, the Mellanby measure of acute adaptation to alcohol, and the area under the entire response curve for each subjective response.
Results: No significant differences in any measure could be attributed to the route of alcohol administration. Eleven of 12 response comparisons were significantly correlated across the routes of alcohol administration, with 9 surviving correction for multiple measures, as did the Mellanby effect and area under the response curve correlations.
Conclusions: The route of alcohol administration has a minimal effect on subjective responses to alcohol when an individual's BrAC exposure profiles are similar.
Keywords: Mellanby; Route of Administration; Subjective Response; Tolerance.
© 2019 by the Research Society on Alcoholism.
Figures


References
-
- (1987) Diagnostic and statistical manual of mental disorders : DSM-III-R. 3rd ed., revised Washington, DC: American Psychiatric Association.
-
- Bucholz KK, Cadoret R, Cloninger CR, Dinwiddie SH, Hesselbrock VM, Nurnberger JI Jr., Reich T, Schmidt I & Schuckit MA (1994) A new, semi-structured psychiatric interview for use in genetic linkage studies: a report on the reliability of the SSAGA. J Stud Alcohol 55:149–158. - PubMed
-
- Conrod PJ, Peterson JB & Pihl RO (2001) Reliability and validity of alcohol-induced heart rate increase as a measure of sensitivity to the stimulant properties of alcohol. Psychopharmacology (Berl) 157:20–30. - PubMed
-
- de Wit H & McCracken SG (1990) Ethanol self-administration in males with and without an alcoholic first-degree relative. Alcohol Clin Exp Res 14:63–70. - PubMed
Publication types
MeSH terms
Substances
Grants and funding
LinkOut - more resources
Full Text Sources

