. 2019 Apr 1;448(1):16-35.
doi: 10.1016/j.ydbio.2019.01.018. Epub 2019 Feb 2.

Prickle1 is required for EMT and migration of zebrafish cranial neural crest

Affiliations

Prickle1 is required for EMT and migration of zebrafish cranial neural crest

Kamil Ahsan et al. Dev Biol. .

Abstract

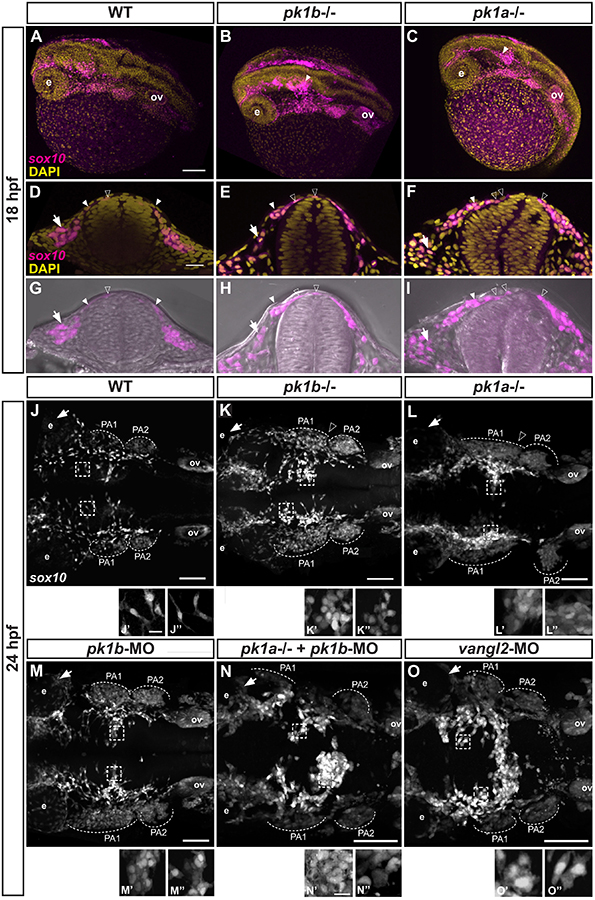
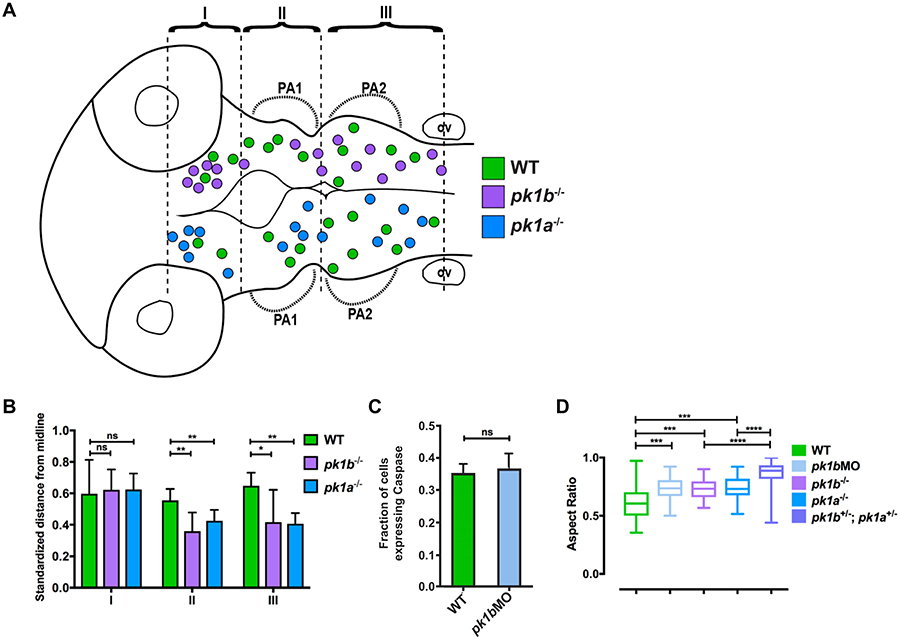
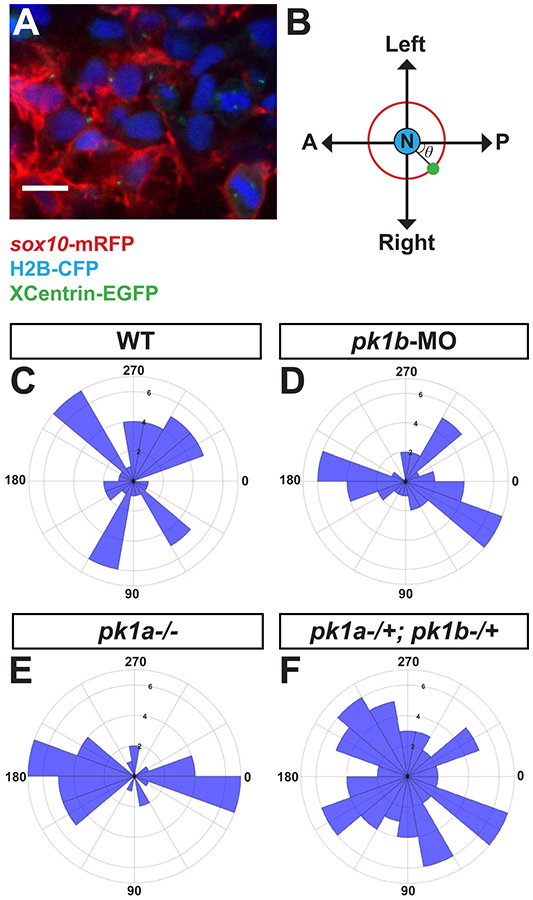
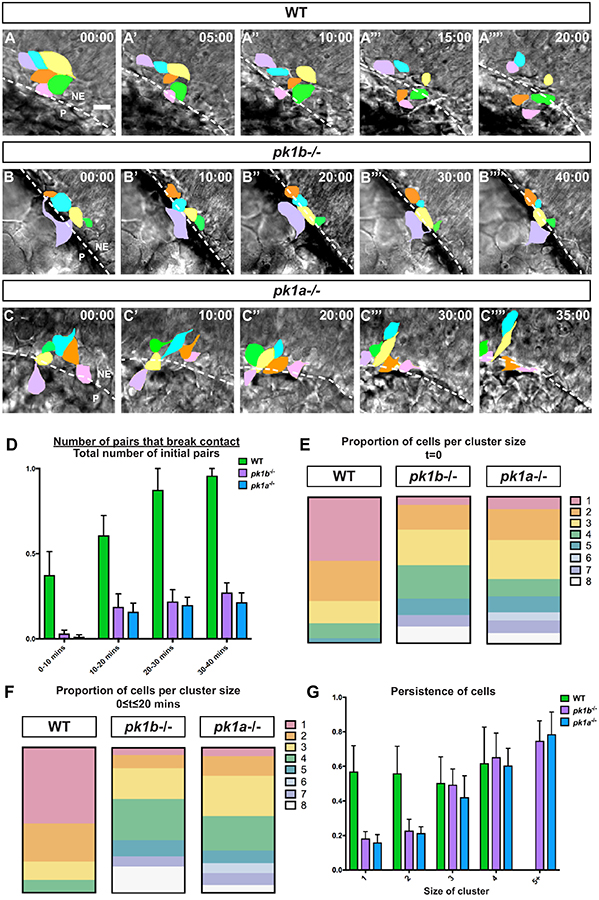
The neural crest-a key innovation of the vertebrates-gives rise to diverse cell types including melanocytes, neurons and glia of the peripheral nervous system, and chondrocytes of the jaw and skull. Proper development of the cephalic region is dependent on the tightly-regulated specification and migration of cranial neural crest cells (NCCs). The core PCP proteins Frizzled and Disheveled have previously been implicated in NCC migration. Here we investigate the functions of the core PCP proteins Prickle1a and Prickle1b in zebrafish cranial NCC development. Using analysis of pk1a and pk1b mutant embryos, we uncover similar roles for both genes in facilitating cranial NCC migration. Disruption of either gene causes pre-migratory NCCs to cluster together at the dorsal aspect of the neural tube, where they adopt aberrant polarity and movement. Critically, in investigating Pk1-deficient cells that fail to migrate ventrolaterally, we have also uncovered roles for pk1a and pk1b in the epithelial-to-mesenchymal transition (EMT) of pre-migratory NCCs that precedes their collective migration to the periphery. Normally, during EMT, pre-migratory NCCs transition from a neuroepithelial to a bleb-based and subsequently, mesenchymal morphology capable of directed migration. When either Pk1a or Pk1b is disrupted, NCCs continue to perform blebbing behaviors characteristic of pre-migratory cells over extended time periods, indicating a block in a key transition during EMT. Although some Pk1-deficient NCCs transition successfully to mesenchymal, migratory morphologies, they fail to separate from neighboring NCCs. Additionally, Pk1b-deficient NCCs show elevated levels of E-Cadherin and reduced levels of N-Cadherin, suggesting that Prickle1 molecules regulate Cadherin levels to ensure the completion of EMT and the commencement of cranial NCC migration. We conclude that Pk1 plays crucial roles in cranial NCCs both during EMT and migration. These roles are dependent on the regulation of E-Cad and N-Cad.

Keywords: Cadherin; Cranial neural crest; EMT; Planar cell polarity; Prickle; Zebrafish.


Figures

Figure 1:
Figure 1:. Zebrafish pk1b and pk1a are expressed in domains that partially overlap with expression of the pan-neural crest marker crestin
(A-C) In situ hybridizations for the pan-neural crest marker crestin (A), prickle1b (B) and prickle1a (C), dorsal views at 24 hpf, show that both pk1b and pk1a are expressed in tissue lateral to the neural tube. Low levels of expression are also seen in the neuroepithelium. Solid black arrows indicate gene expression in the cranial NCC stream leading to pharyngeal arch 1 (PA1), solid white arrow indicates pk1b expression in the FBMNs, r4 is indicated. (D) Schematic of protein domain structure for both Prickle1b and Prickle1a. Arrows indicate lesions in pk1ach105 and pk1bfh122 mutants. The first codon, and the C-terminal CAAX domain are also indicated. (E) Amino-acid sequence of Pk1a N-terminus; the pk1ach105 mutant encodes a truncated protein with a premature STOP codon.
Figure 2:
Figure 2:. Disruption of pk1b or pk1a function disrupts cranial NCC disposition
(A-C) Maximal projections of confocal images in dorsolateral view of fixed Tg(sox10:EGFP) 18 hpf embryos (EGFP indicated in magenta), counterstained with DAPI (yellow), show the 3D formation of NCC streams migrating ventrolaterally. The pk1bfh122/fh122 (B) and pk1ach105/ch105 (C) mutant embryos exhibit dorsal clusters of NCCs along the AP axis, as indicated by solid white arrowheads; ov = otic vesicle, e = eye, scale bar = 100μm. (D-I) Single confocal z-slices of transverse sections through the anterior hindbrain of wild-type (D, G), pk1bfh122/fh122 (E, H) and pk1ach105/ch105 (F, I) Tg(sox10:EGFP) 18 hpf embryos counterstained with DAPI (yellow; D-F) or together with bright-field views (G-I). Open arrowheads indicate nuclei of dorsally located NCCs (EGFP signal in magenta), closed arrowheads indicate NCCs in process of ventrolateral migration around the neural keel, arrows indicate NCCs that have migrated out into the surrounding head mesenchyme, scale bar = 25μm. (J-O) Maximal projections of confocal images in dorsal view from fixed, deyolked, flat-mounted Tg(sox10:EGFP) embryos at 24 hpf. The scale (bar = 100μm) is identical for all specimens shown except for pk1ach105/ch105 + pk1bmorphant, and vangl2-morphant embryos, which showed a shortened AP body axis and a wider mediolateral body axis due to convergence defects. As compared to WT embryos (n=13 embryos) (J), pk1bfh122/fh122 (n=12 embryos) (K) and pk1ach105/ch105 (n=9 embryos) (L) mutant embryos exhibit the maintenance of distinct dorsally-localized NCC clusters. pk1b-morphant (n=18 embryos) (M) embryos phenocopy the pk1bfh122/fh122 mutant embryos (K). The pk1ach105/ch105 + pk1b-morphant (n=8 embryos) (N), and vangl2-morphant (n=7 embryos) (O) show a more severe phenotype of dorsal NCC clustering across the midline. (J’-O’’) High magnification insets from associated micrographs (boxed) show that in contrast to WT specimens (J’, J’’) where NCCs exhibit bipolar, protrusive morphologies, pk1bfh122/fh122 (K’, K’’) pk1ach105/ch105 (L’, L’’), pk1b-morphant (M’, M’’), pk1ach105/ch105 + pk1b-morphant (N’, N’’), and vangl2-morphant (O’, O’’) NCCs show less protrusive, more rounded morphologies that exhibit close contacts with neighboring NCCs. The scale (bar = 10μm) is identical for each inset. PA1=pharyngeal arch 1, PA2=pharyngeal arch 2, PA3=pharyngeal arch 3, ov=otic vesicle.
Figure 3:
Figure 3:. Additional analysis of cranial neural crest cell clusters in wild-type and pk1 mutant embryos
(A-B) The spatial distribution of NCC clusters across multiple 24 hpf embryos shows that both pk1bfh122/fh122 and pk1ach105/ch105 clusters show anterior and medial biases. (A) The centroids of cell clusters, defined as two or more cells in contact with one another, across multiple pk1bfh122/fh122 specimens (n=5 embryos) are plotted above the midline and those of pk1ach105/ch105 specimens (n=5 embryos) are plotted below the midline, with WT clusters on both sides for comparison (green filled circles, n=5 embryos). There is a bias for both pk1bfh122/fh122 and pk1ach105/ch105 clusters in region 1 (R1), as well as a tendency to misalign such that the cluster cannot be ascribed to distinct streams for either PA1 or PA2. (B) Normalized distances of centroids of clusters from the midline show that in both RII and RIII there is a tendency for pk1bfh122/fh122 and pk1ach105/ch105 NCCs to be located medially as compared to WT NCCs. The bias was found to be statistically significant for regions II and III using a two-way ANOVA test (*, p<0.05, **, p<0.01) for either mutant conditions as compared to WT. There was no statistically significant difference between either mutant condition and WT in Region I (p>0.05). (C) Comparison of the fraction of NCCs in a given z-slice that expresses Caspase-3 in 24 hpf WT (n=78 cells, 3 embryos) versus 24 hpf pk1bmorphant (n=172 cells, 5 embryos) specimens. No statistically-significant difference was found between WT and pk1b-morphant NCCs (p>0.05). (D) Measurements of aspect ratio (the ratio of width/length of NCCs) for WT (n=34 cells), pk1b-morphant (n=48 cells), pk1bfh122/fh122 (n=40 cells), pk1ach105/ch105 (n=30 cells), and double-heterozygous pk1ach105/+; pk1bfh122/+ (n=94 cells) 24 hpf specimens were performed by measuring the width versus length ratio of NCCs either in Tg(sox10:mRFP) embryos, which label the membranes of all NCCs, or in Tg(sox10:EGFP) embryos co-injected with RNA encoding mRFP. WT NCCs had lower aspect ratios in comparison to each Pk1-deficient condition. Statistical significance was calculated in each pairwise case using unpaired t-tests (***, p<0.001; ****, p<0.0001). Double-heterozygous pk1ach105/+; pk1bfh122/+ embryos showed a significantly higher aspect ratio than either pk1bfh122/fh122 or pk1ach105/ch105 alone (p<0.0001 in both cases).
Figure. 4:
Figure. 4:. pk1b and pk1a mutants do not show alterations in pharyngeal cartilage fates
(A-C) In situ hybridizations for the pharyngeal neural crest marker dlx2 in WT (A), pk1bfh122/fh122 (B) and pk1ach105/ch105 (C) 24 hpf embryos in lateral view show no significant differences between conditions. Solid arrowheads indicate streams of NCCs. (D-F) Alcian Green labeling of cartilage elements of the pharyngeal apparatus in WT (D), pk1bfh122/fh122 (E) and pk1ach105/ch105 (F) 6 dpf larvae, show no significant changes in size and organization of elements between conditions. m=Meckel’s cartilage; pq=palatoquadrate; ch=ceratohyal; cb=ceratobranchial; cb(i) indicates first branchial arch, cb(iv) indicates fourth branchial arch, with solid arrows indicating the corresponding ceratobranchial cartilage elements.
Figure 5:
Figure 5:. Loss of function of either pk1b or pk1a causes aberrant movement of cranial neural crest cells
(A) Schematic dorsal view of a 16 hpf embryo with optic cup, pharyngeal arches (PA), and otic vesicle (ov) indicated; dashed box indicates region that was time-lapse imaged. (B-F) Displacement tracks of motile NCCs in dorsal view, anterior to left, from 16–18 hpf. The x and y components of the displacement tracks were drift-corrected relative to bright-field images of the embryos to account for growth and movement of the embryo. In contrast to WT embryos (B) where the net displacement of NCCs is lateral, the net displacement of NCCs in pk1b-morphant (C), pk1bfh122/fh122 (D) and pk1ach105/ch105 (E) mutant embryos is in the anterior direction. NCCs in double-heterozygous pk1ach105/+; pk1bfh122/+ specimens (F) also move in net anterior directions. Scale bar = 25 μm for all conditions. (G-I) To show inter-embryo variation, 10 individual NCC displacement trajectories, for each of 3 embryos, were plotted at the origin, with both left and right sides of the embryo in the case of WT (G) embryos transposed on to one side for clarity. Trajectories from different embryos are colored in red, blue and green. (G) WT NCCs move in the lateral direction as is expected for the first stage of normal ventrolateral NCC migration, (H, I) pk1bfh122/fh122 and pk1ach105/ch105 mutant NCCs display a bias for anterior directionalities.
Figure 6:
Figure 6:. Disruption of pk1b or pk1a causes NCCs to adopt aberrant polarity
To assay the polarity of NCCs, MTOCs in NCCs were labeled by injecting either XCentrin-EGFP RNA in one-cell stage Tg(sox10:mRFP) or Cherry-XCentrin RNA in one-cell stage Tg(sox10:EGFP) embryos that were also injected with H2B-CFP to label nuclei. Fixed, deyolked, flat-mounted 24 hpf embryos were imaged in dorsal view (A). Scale bar = 10 μm. The angle θ of the MTOC relative to the nucleus and the AP body axis (B) was measured for each cell and quantified using Fiji. (C-F) Polar histograms generated using MATLAB show the polarity of assayed NCCs. In all cases, the Watson-Williams F-test was used to measure statistical significance between conditions as well as with a randomly-distributed polar histogram. In WT embryos, NCCs (n=48 cells, 5 embryos) were polarized along the mediolateral axis (C), with WT cells showing a significant difference from a random distribution (***, p<0.001). However, in pk1b-morphant specimens (n=42 cells, 3 embryos) (D) and pk1ach105/ch105 specimens (n=40 cells, 3 embryos) (E) NCCs were polarized along the AP axis. As compared to WT NCCs, the distributions of both pk1b-morphant and pk1ach105/ch105 NCCs were significantly altered, and also showed a significant difference from random distributions (***, p<0.001 for each case). However, double-heterozygous pk1ach105/+; pk1bfh122/+ NCCs (n=71 cells, 4 embryos) (F) showed no statistically significant difference as compared to a random distribution (p>0.05), indicating that disrupting one copy each of the pk1a and pk1b genes is sufficient to randomize NCC polarity.
Figure 7:
Figure 7:. Loss of Pk1 function causes dorsal NCC clusters to form and be maintained in early stages of neural crest development
Confocal time-lapse imaging of dorsally-mounted Tg(sox10:EGFP) embryos was started at 12 hpf when the neural keel is still developing, with both EGFP and DIC (brightfield) images collected every 5 minutes. (A-C) Reorganization of EGFP+ NCCs (pseudocolored) in clusters of NCCs at t=0 to t=40 mins; dotted line indicates border of the neuroepithelium. The neuroepithelium (NE) is located at top right, and the periphery (P) is located at bottom left, in all panels. Scale bar=10 μm. (A) In WT embryos, many of the NCCs in contact at t=0 break contact by 20 minutes, with almost all contacts breaking by 30 mins and 40 mins. (B, C) In pk1bfh122/fh122 and pk1ach105/ch105 specimens NCC clusters largely remained in contact for 40 mins. (D) To quantify breakage of contacts between NCCs over the time intervals 0–10 min, 10–20 min, 20–30 min and 30–40 min, a ratiometric measure of ‘pair breakage’ within a cluster was used (Methods). In WT embryos, ~61% of pairs of cells broke contacts between 0 and 20 minutes (n=43 pairs, 3 embryos), with a large majority of pairs losing contact by 20–30 minutes. In contrast, pairs of NCCs in both pk1bfh122/fh122 (n=61 pairs, 3 embryos) and pk1ach105/ch105 embryos (n=58 pairs, 3 embryos) did not break over extended periods of time, with only ~27% of pairs in pk1bfh122/fh122 clusters breaking contact and ~21% of pairs in pk1ach105/ch105 clusters breaking contact by 30–40 minutes. (E) To measure the relative proportions of individual cells and cell clusters of varying sizes, the organization of cells at 12 hpf in Tg(sox10:EGFP) embryos was quantified. In WT embryos (n=37 cells, 3 embryos), 43.9% of NCCs were found as individuals, 27.6% were in pairs, 15.3% in clusters of 3 cells, 10.2% in clusters of 4 cells, and 3.1% in clusters of 5 cells. In pk1bfh122/fh122 specimens (n=53 cells, 3 embryos), 5.9% of NCCs were found as individuals, and 17.0% as pairs. Most NCCs were found in cluster sizes of 3 (24.2%) or 4 (22.9%), with clusters consisting of as many as 8 cells. In pk1ach105/ch105 specimens (n=46 cells, 3 embryos), 8.6% of NCCs were found as individuals, and 21.1% as pairs. Most NCCs were found as pairs or in cluster sizes of 3 cells (26.6%), with appreciable percentages of cluster sizes of 4 (11.7%) and 5 (10.9%) and with clusters consisting of as many as 8 cells. (F) As another measure of the relative proportions of individual cells and clusters of varying sizes, the number of cells that persisted in a given configuration (from an individual cell to cells in increasing sizes of clusters) was measured over non-overlapping 20-minute time windows. In WT embryos (n=117 cells, 3 embryos), 53.8% of NCCs remain individual over 20 minutes, whereas 26.5% were in pairs, 11.1% in clusters of 3 cells, and 8.5% in clusters of 4 cells. In pk1bfh122/fh122 embryos (n=99 cells, 3 embryos), 5.05% of NCCs were found as individual cells over the 20-minute time window. Most NCCs were found in cluster sizes of 3 (21.2%) or 4 (28.3%), with NCCs found in clusters consisting of as many as 8 cells. In pk1ach105/ch105 embryos (n=148 cells, 3 embryos), 6.1% of NCCs were individual, with most NCCs found in cluster sizes of 3 (27.7%) or 4 (23.6%) and clusters consisting of as many as 8 cells. (G) To assay how persistence—a measure of the total length of a trajectory of a cell as a ratio of the displacement of the cell with a value of 1.0 indicating a targeted route from starting point to end point—varied as a function of cluster size, the persistence of individual cells and clusters of sizes 2 or more was measured for each condition. Persistence is agnostic to the ‘correct’ direction of the cells, and is a measure of the targeted directionality of NCCs, independent of their trajectories. In WT embryos (n=42 cells, 3 embryos), the persistence of individual NCCs or clusters of 2, 3 or 4 was similar. In both pk1bfh122/fh122 (n=49 cells, 3 embryos) and pk1ach105/ch105 embryos (n=64 cells, 3 embryos), the persistence of individual cells and cells in pairs was lower than the persistence of clusters consisting of 3 or more NCCs, or of WT NCCs. Clusters of 3 or more NCCs in both pk1-mutants showed high levels of persistence, with statistically insignificant (p>0.5) differences in persistence as compared to WT cells. Both pk1-mutants showed small increases in persistence as the size of the cluster increased, with no statistically significant difference between clusters of 5 or more cells.
Figure 8:
Figure 8:. Loss of Pk1 function causes defects in both pre-migratory NCCs in the transitional states of EMT, as well as in migratory ‘escaper’ NCCs
To query the role of Pk1 molecules in the morphological transitions of EMT, as well as during active migration, NCCs were labeled in a mosaic fashion by injecting DNA encoding LifeAct-GFP under the control of a sox10 promoter into one-cell stage embryos. (A-H) Confocal time-lapse imaging of LifeAct-GFP positive cells for at least 20 minutes in 16 hpf embryos revealed F-actin rich protrusions and distinct morphologies of NCCs. Scale bar=10 μm. (A-D’’’’) Frames from confocal time-lapses of pre-migratory NCCs. (A-A’’’’) WT NCCs display short protrusions even before displaying rounded bleb-based protrusions. WT NCCs adopt the bleb-based morphology before transitioning to morphologies with longer filopodial protrusions, with NCCs moving through these transitional morphologies in EMT over the time-span of approximately 20 minutes. (B-B’’’’, C-C’’’’, D-D’’’’) Over the same time frame as WT NCCs, pk1b-morphant, pk1bfh122/fh122, and pk1ach105/ch105 NCCs show bleb-based protrusions that are actively maintained, on occasion changing the location of the bleb along the edges of a NCC. (B’-B’’’) White arrowheads indicate bleb-based protrusions. (E-H) Confocal time-lapse images of NCCs in the mandibular stream actively migrating towards the first pharyngeal arch. (E-E’’’’) Actively-migrating WT cells that are highly filopodial make transient contacts with neighboring cells, often making, breaking and re-establishing a contact in the form of a thick actin-rich protrusion with the same neighboring cell over a time span of at least 20 minutes. White arrowheads indicate a protrusion contacting a neighboring NCC. (F-F’’’’, G-G’’’’, H-H’’’’) pk1b-morphant, pk1bfh122/fh122, and pk1ach105/ch105 migratory NCCs are highly protrusive but display an inability to separate from neighboring NCCs and maintain contact, often over extended time periods. (I) Bar graph showing the percentage of pre-migratory NCCs that successfully transitioned from a bleb-based to a highly-protrusive mesenchymal-like morphology relative to those that remained in the persistently-blebbing state over the time span of 20 minutes. 89% of WT NCCs (n=18 cells, 8 embryos), 16% of pk1b-morphant NCCs (n=17 cells, 8 embryos), 6% of pk1bfh122/fh122 NCCs (n=32, 8 embryos), and 17% of pk1ach105/ch105 NCCs (n=12 cells, 5 embryos) transitioned successfully. (J) Bar graph showing the percentage of migratory NCCs that established and severed contact with a neighboring NCC relative to NCCs that failed to sever contact with a neighboring NCC over the time span of 20 minutes. 93% of WT NCCs (n=28, 6 embryos) NCCs, 15% of pk1b-morphant NCCs (n=41 cells, 10 embryos), 9% of pk1bfh122/fh122 NCCs (n=22 cells, 7 embryos), and 15% of pk1ach105/ch105 NCCs (n=13 cells, 4 embryos) severed contact with neighboring NCCs.
Figure 9:
Figure 9:. Pk1b regulates E-Cad levels in pre-migratory and migratory NCCs and N-Cad levels in migratory NCCs.
To investigate the effect of Pk1b-knockdown on the levels of E-Cad (Cdh1) and N-Cad (Cdh2), immunolabeling at 16 hpf embryos was used to assay both pre-migratory and migratory NCCs, which were defined based on their z-position relative to the most dorsally located NCCs. Pre-migratory NCCs were defined as those located within 7 μm of the most dorsal position; the migratory cells imaged were located between 16 and 37 μm of the most dorsal position. (A-D) Tg(sox10:mRFP) embryos were immunolabeled for E-Cad (Cdh1) (A’-D’), and counterstained with DAPI to mark nuclei (A’’’-D’’’). Scale bar=10 μm. White arrowheads indicate levels of E-Cad in NCCs with labeled membranes and nuclei. Merged channels are also shown (A’’-D’’’). (A-A’’’) In pre-migratory NCCs, E-Cad is present at high levels in WT specimens (A’), with puncta localizing largely on the membrane (A’’). (B-B’’’) In pk1b-morphant specimens, E-Cad levels are elevated (B’) with more puncta localizing on the membrane (B’’) as compared to WT (compare A’’ and B’’). (C-C’’’) In migratory NCCs, E-Cad is present at reduced levels (C’, C’’) as compared to pre-migratory NCCs (compare C’’ and A’’). (D-D’’’). In pk1bmorphant specimens, E-Cad levels are elevated (D’) with more puncta localizing on the membrane (D’’) as compared to WT (compare C’’ and D’’). (E) To quantify the levels of E-Cad in different conditions, fluorescence pixel intensity was measured. Each cell was normalized by subtracting background pixel intensity and dividing the remainder by the area of the cell. High levels of E-Cad were found in pre-migratory WT cells (n=92 cells, 4 embryos). E-Cad levels in pk1b-deficient NCCs (n=73 cells, 4 embryos) were significantly elevated as compared to WT NCCs (***, p=0.0002). E-Cad levels in migratory WT cells (n=100 cells, 4 embryos), were significantly reduced as compared to levels in pre-migratory WT cells (****, p<0.0001), however pk1b-morphant migratory NCCs (n=65, 4 embryos) showed significantly higher levels of E-Cad as compared to WT migratory NCCs (***, p=0.0006). Similarly, (F-I) Tg(sox10:mRFP) embryos were immunolabeled for N-Cad (Cdh2) and counterstained with DAPI to mark nuclei (F’’-I’’’). White arrowheads indicate levels of N-Cad in NCCs with labeled membranes and nuclei. Merged channels are also shown (F’’-I’’). (F-F’’’) In pre-migratory NCCs, N-Cad (F’) is highly localized at the membrane in WT specimens (F’’). (G-G’’’) In pk1b-morphant specimens, N-Cad levels (G’) showed no discernable difference in localization on the membrane (G’’) as compared to WT (compare G’’ and F’’). (H-H’’’) In migratory NCCs, N-Cad is present at increased levels as compared to pre-migratory NCCs (compare H’’ and F’’). (I-I’’’) However, in pk1b-morphant specimens, N-Cad levels in migratory NCCs are decreased (I’) with less N-Cad localization on the membrane (I’’) as compared to WT (compare I’’ and H’’). (J) To quantify the levels of N-Cad in different conditions, fluorescence pixel intensity was measured and normalized in the same manner as with E-Cad. N-Cad was present on the membrane in pre-migratory WT NCCs (n=164 cells, 5 embryos). N-Cad levels in pk1bmorphant NCCs (n=204 cells, 4 embryos) showed no difference to WT NCCs (p>0.05). N-Cad levels in migratory WT cells (n=192 cells, 5 embryos), were significantly elevated as compared to levels in pre-migratory WT NCCs (****, p<0.0001), however pk1b-morphant migratory NCCs (n=189, 4 embryos) showed significantly lower levels of N-Cad as compared to WT migratory NCCs (**, p=0.0027). N-Cad levels in WT pre-migratory, pk1b-morphant pre-migratory, and pk1b-morphant NCCs showed no significant difference from each other (p>0.05 for each combination).

References

    1. Acloque H, Adams MS, Fishwick K, Bronner-Fraser M, and Nieto MA (2009). Epithelial mesenchymal transitions: the importance of changing cell state in development and disease. J Clin Invest 119, 1438–1449. - PMC - PubMed
    1. Akimenko MA, Ekker M, Wegner J, Lin W, and Westerfield M (1994). Combinatorial expression of three zebrafish genes related to distal-less: part of a homeobox gene code for the head. J Neurosci 14, 3475–3486. - PMC - PubMed
    1. Ambegaonkar AA, and Irvine KD (2015). Coordination of planar cell polarity pathways through Spiny-legs. Elife 4. - PMC - PubMed
    1. Andrieu C, Montigny A, Alfandari D, and Theveneau E (2018). Basolateral localization of MMP14 drives apicobasal polarity change during EMT independently of its catalytic activity. bioRxiv, 402180.
    1. Banerjee S, Gordon L, Donn TM, Berti C, Moens CB, Burden SJ, and Granato M (2011). A novel role for MuSK and non-canonical Wnt signaling during segmental neural crest cell migration. Development 138, 3287–3296. - PMC - PubMed

Publication types

MeSH terms