. 2019 Jun;27(6):956-964.
doi: 10.1016/j.joca.2019.01.013. Epub 2019 Feb 2.

Nutrient supply and nucleus pulposus cell function: effects of the transport properties of the cartilage endplate and potential implications for intradiscal biologic therapy

Affiliations

Nutrient supply and nucleus pulposus cell function: effects of the transport properties of the cartilage endplate and potential implications for intradiscal biologic therapy

J Wong et al. Osteoarthritis Cartilage. 2019 Jun.

Abstract

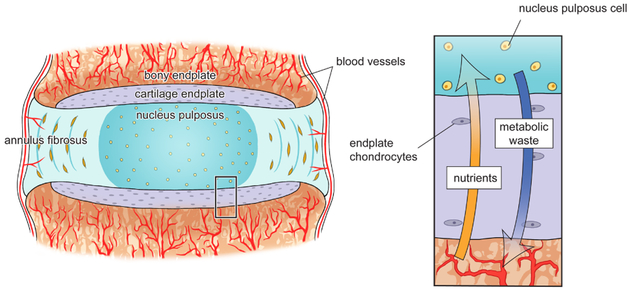
Objective: Intradiscal biologic therapy is a promising strategy for managing intervertebral disc degeneration. However, these therapies require a rich nutrient supply, which may be limited by the transport properties of the cartilage endplate (CEP). This study investigated how fluctuations in CEP transport properties impact nutrient diffusion and disc cell survival and function.

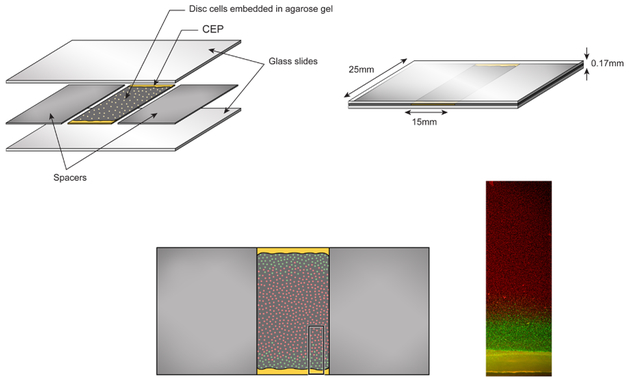
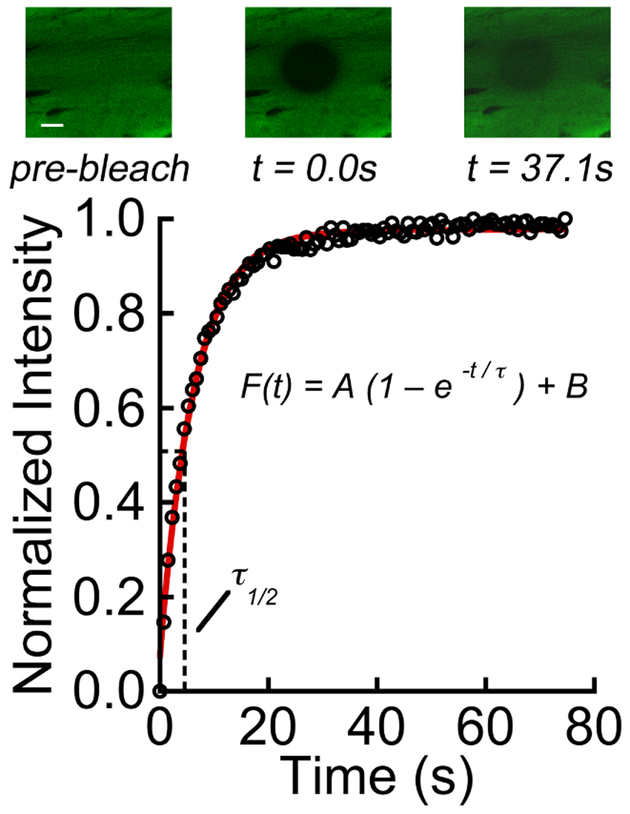
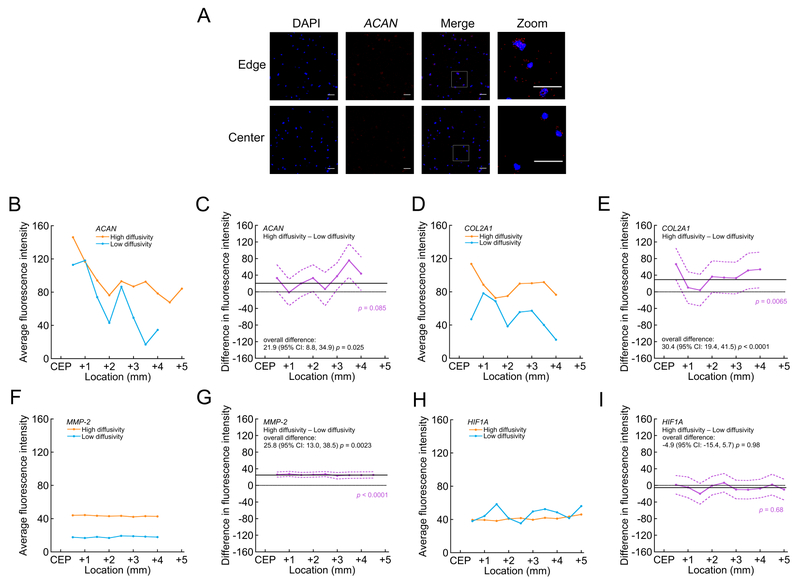
Design: Human CEP tissues harvested from six fresh cadaveric lumbar spines (38-66 years old) were placed at the open sides of diffusion chambers. Bovine nucleus pulposus (NP) cells cultured inside the chambers were nourished exclusively by nutrients diffusing through the CEP tissues. After 72 h in culture, depth-dependent NP cell viability and gene expression were measured, and related to CEP transport properties and biochemical composition determined using fluorescence recovery after photobleaching and Fourier transform infrared (FTIR) spectroscopy.

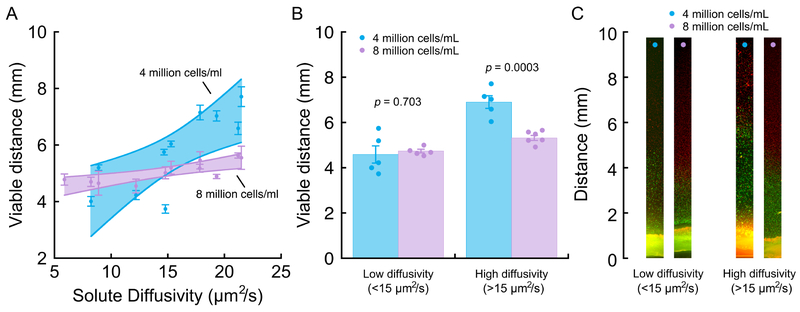
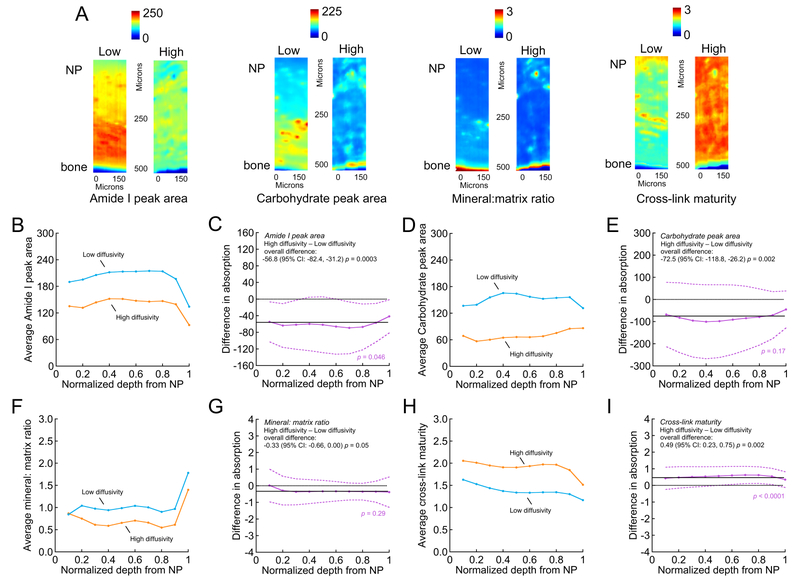
Results: Solute diffusivity varied nearly 4-fold amongst the CEPs studied, and chambers with the least permeable CEPs appeared to have lower aggrecan, collagen-2, and matrix metalloproteinase-2 gene expression, as well as a significantly shorter viable distance from the CEP/nutrient interface. Increasing chamber cell density shortened the viable distance; however, this effect was lost for low-diffusivity CEPs, which suggests that these CEPs may not provide enough nutrient diffusion to satisfy cell demands. Solute diffusivity in the CEP was associated with biochemical composition: low-diffusivity CEPs had greater amounts of collagen and aggrecan, more mineral, and lower cross-link maturity.

Conclusions: CEP transport properties dramatically affect NP cell survival/function. Degeneration-related CEP matrix changes could hinder the success of biologic therapies that require increased nutrient supply.

Keywords: Cartilage endplate; Disc degeneration; Fourier transform infrared imaging; Low back pain; Nucleus pulposus cell; Nutrient transport.


Conflict of interest statement

Conflict of interest

None.

Figures

Figure 1:
Figure 1:
Vertebral capillaries penetrate the bony endplate and terminate at the cartilage endplate, which forms a continuous interface superior and inferior to the intervertebral disc that separates the vertebra from the inner annulus fibrosus and gelatinous nucleus pulposus. Once nutrients reach the cartilage, small solutes such as glucose and oxygen diffuse in through the cartilage matrix along a steep concentration gradient, while metabolic waste produced by the disc cells, such as lactate, diffuses out (inset).
Figure 2:
Figure 2:
The diffusion chambers consist of glass slides separated by 170 μm-tall spacers. Nucleus pulposus cells embedded in agarose gel obtain nutrients from their culture medium outside the chambers via diffusion through full-thickness human CEP sections. Following incubation for 72 hr, gels were stained to assess viability (live/dead photomicrograph, inset) and gene expression.
Figure 3:
Figure 3:
Upper panel showing photobleaching and fluorescence recovery for CEP tissue. The scale bar indicates 20 μm. Fluorescence intensity in the bleach spot was normalized to pre-bleach intensity, and the resulting normalized intensity values, F(t), were fitted to an exponential recovery curve to determine the time constant of recovery (τ) and recovery half-time (τ½). Solute: sodium fluorescein (376 Da).
Figure 4:
Figure 4:
(A) Viable distance in the diffusion chambers correlated significantly with diffusive transport in the CEPs (determined for sodium fluorescein) at the open sides of the chamber. 4 million cells/mL: for every 1 μm2/s increase in solute diffusivity, there was a 0.24 mm (95% CI: 0.09–0.39 mm, p = 0.006) increase in viable distance (r2 = 0.64, p = 0.006); 8 million cells/mL: for every 1 μm2/s increase in solute diffusivity, there was a 0.06 mm (95% CI: 0.03–0.09 mm, p = 0.003) increase in viable distance (r2 = 0.65, p = 0.003). Error bars denote estimated mean ± SD calculated from 3 viable distance measurements per CEP and per cell density; the validity of the measurements was confirmed in repeat experiments performed using neighboring tissue sections from the same CEP. For the low chamber cell density, data from 10 different CEPs were used to fit the regression. For the high cell density, data from 11 different CEPs were used. Shaded bands display 95% point-wise CI for each relationship. Solute diffusivity measurements represent the mean from 4–6 measurements repeated at various cranial-caudal locations in each CEP. (B) For CEPs with low solute diffusivity, the viable distance in the diffusion chambers was similar for chambers with 4 million cells/mL vs. 8 million cells/mL. For CEPs with high diffusivity, the viable distance was significantly shorter for chambers with 8 million cells/mL. (C) Representative low-magnification photomicrographs of live/dead-stained gels from diffusion chambers in each of the groups in panel (B). The same low-diffusivity CEP or high-diffusivity CEP is shown for each group.
Figure 5:
Figure 5:
Comparison of NP cell gene expression in the viable region between diffusion chambers incubated with the highest vs. lowest diffusivity CEPs (4 million cells/mL). (A) Representative projection images showing ACAN localization (red) to cell nuclei (DAPI, blue) near the open edge and center of a diffusion chamber with a high-diffusivity CEP. Boxes indicate the regions of the zoomed insets. Scale bars represent 40 μm. (B), (D), (F) & (H) Average fluorescence intensity indicating mRNA expression levels for image stacks acquired at various locations within the viable region of the chambers. Data points show the mean intensity for three scans across two diffusion chambers with the highest diffusivity CEP (21.5 μm2/s) and the lowest diffusivity CEP (5.9 μm2/s). For both high- and low-diffusivity CEPs, average mRNA levels of ACAN (B) and COL2A1 (D) appeared to decrease with increasing distance from the CEP, whereas average mRNA levels of MMP-2 (F) and HIF1A (H) appeared stable. (C), (E), (G) & (I) Difference in average fluorescence intensity (purple, with 95% confidence intervals) at various locations indicating difference in mRNA expression levels between chambers with the highest and lowest diffusivity CEPs (high minus low; > zero suggested higher mRNA levels in the chambers with the high-diffusivity CEP). Solid black lines indicate overall difference (i.e. for all locations pooled), and dotted black lines indicate no difference. p-values in purple indicate statistical significance of the difference between high- and low-diffusivity CEPs as a function of location, and p-values in black indicate statistical significance of the overall difference. Overall, compared to chambers with the low-diffusivity CEP, chambers with the high-diffusivity CEP had greater mRNA levels of ACAN (C), COL2A1 (E), and MMP-2 (G), and similar levels of HIF1A (I).
Figure 6:
Figure 6:
Comparison of FTIR absorption data between high-diffusivity vs. low-diffusivity CEPs. (A) Representative absorption maps of Amide I peak area (1595–1710 cm−1, estimate of collagen content), carbohydrate peak area (960–1185 cm−1, estimate of aggrecan content), phosphate (895–1215 cm−1): Amide I peak ratio (indicative of mineral-to-matrix ratio), and 1660:1690 cm−1 peak ratio (estimate of collagen cross-link maturity) from high-diffusivity (“High”) and low-diffusivity (“Low”) CEPs. (B), (D), (F) & (H) Average FTIR absorption as a function of normalized depth from the NP/CEP interface. Data points show the mean absorption for high-diffusivity CEPs (>15 μm2/s; n = 3 CEPs and 3 sections/CEP) and low-diffusivity CEPs (<15 μm2/s n = 3 CEPs and 3 sections/CEP). In general, low-diffusivity and high-diffusivity CEPs showed similar depth-wise fluctuation in absorption profiles (i.e. parallel lines) for Amide I peak area (B) carbohydrate peak area (D), mineral-to-matrix ratio (F), and cross-link maturity (H) throughout the thickness of the CEP. (C), (E), (G) & (I) Difference in average absorption (purple, with 95% confidence intervals) as a function of normalized depth from the NP/CEP interface between high-diffusivity vs. low-diffusivity CEPs (high minus low; > zero suggested higher absorption in the high-diffusivity CEPs). Solid black lines indicate overall difference (i.e. for all depths pooled), and dotted black lines indicate no difference. p-values in purple indicate statistical significance of the difference between high- and low-diffusivity CEPs as a function of depth, and p-values in black indicate statistical significance of the overall difference. Overall, compared to the high-diffusivity CEPs, the low-diffusivity CEPs had significantly greater Amide I peak area (C) and carbohydrate peak area (E), higher mineral-to-matrix ratio (G), and lower collagen cross-link maturity (I).

References

    1. Kregar Velikonja N, Urban J, Frohlich M, Neidlinger-Wilke C, Kletsas D, Potocar U, et al. Cell sources for nucleus pulposus regeneration. Eur Spine J 2014;23(Suppl 3):S364–374, 10.1007/s00586-013-3106-9. - DOI - PubMed
    1. Woods BI, Vo N, Sowa G, Kang JD. Gene therapy for intervertebral disk degeneration. Orthop Clin North Am 2011;42:563–574, 10.1016/j.ocl.2011.07.002. - DOI - PubMed
    1. Bae WC, Masuda K. Emerging technologies for molecular therapy for intervertebral disk degeneration. Orthop Clin North Am 2011;42:585–601, 10.1016/j.ocl.2011.07.004. - DOI - PMC - PubMed
    1. Wang Z, Hutton WC, Yoon ST. ISSLS Prize winner: Effect of link protein peptide on human intervertebral disc cells. Spine 2013;38:1501–1507. - PubMed
    1. Gawri R, Antoniou J, Ouellet J, Awwad W, Steffen T, Roughley P, et al. Best paper NASS 2013: link-N can stimulate proteoglycan synthesis in the degenerated human intervertebral discs. Eur Cell Mater 2013;26:107–119, 10.22203/eCM.v026a08. - DOI - PubMed

Publication types

MeSH terms