Case Reports
. 2019 May 2;133(18):1977-1988.
doi: 10.1182/blood-2018-11-886028. Epub 2019 Feb 5.

Dominant activating RAC2 mutation with lymphopenia, immunodeficiency, and cytoskeletal defects

Affiliations
Case Reports

Dominant activating RAC2 mutation with lymphopenia, immunodeficiency, and cytoskeletal defects

Amy P Hsu et al. Blood. .

Abstract

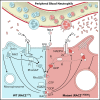
Ras-related C3 botulinum toxin substrate 2 (RAC2), through interactions with reduced NAD phosphate oxidase component p67 phox , activates neutrophil superoxide production, whereas interactions with p21-activated kinase are necessary for fMLF-induced actin remodeling. We identified 3 patients with de novo RAC2[E62K] mutations resulting in severe T- and B-cell lymphopenia, myeloid dysfunction, and recurrent respiratory infections. Neutrophils from RAC2[E62K] patients exhibited excessive superoxide production, impaired fMLF-directed chemotaxis, and abnormal macropinocytosis. Cell lines transfected with RAC2[E62K] displayed characteristics of active guanosine triphosphate (GTP)-bound RAC2 including enhanced superoxide production and increased membrane ruffling. Biochemical studies demonstrated that RAC2[E62K] retains intrinsic GTP hydrolysis; however, GTPase-activating protein failed to accelerate hydrolysis resulting in prolonged active GTP-bound RAC2. Rac2+/E62K mice phenocopy the T- and B-cell lymphopenia, increased neutrophil F-actin, and excessive superoxide production seen in patients. This gain-of-function mutation highlights a specific, nonredundant role for RAC2 in hematopoietic cells that discriminates RAC2 from the related, ubiquitous RAC1.


Conflict of interest statement

Conflict-of-interest disclosure: The authors declare no competing financial interests.

Figures
None
Graphical abstract
Figure 1.
Figure 1.
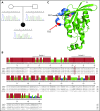
RAC2 mutation occurs within the highly conserved Switch II domain. (A) Sanger sequence of RAC2 exon 3 demonstrating c.184G>A in patient 1 (*) and wild-type sequence in both parents. (B) Amino acid alignment of select members of human RHO family of GTPases. Reference sequences (RAC2 NP_002863.1, RAC1 NP_008839.2, RAC3 NP_005043.1, CDC42 NP_001782.1) are from the National Center for Biotechnology Information and aligned using Clustal W. Underline, conserved Switch I and Switch II regions; open box, E62; *Q61, D63, and Y64. (C) Three-dimensional structure of the related RAC1 (3TH5)46; blue, Switch II; pink, D57 residue; and red, E62. C, C terminus; N, N terminus.
Figure 2.
Figure 2.
Neutrophils from patients have large macropinocytotic vesicles, excess superoxide production and diminished fMLF-induced chemotaxis. (A) Light microscopy images of blood smears from health control (HC), patient (Pt)1, and Pt2. Large vacuoles are clearly present within the neutrophils of Pt1 and Pt2 (arrows). Images acquired from a CellaVision DM1200. Original magnification ×100. (B) Transmission electron microscopy of neutrophils from HC, Pt1, and Pt2. *Large vacuoles are seen in both patients. Paucity of specific granules in Pt1 compared with HC. Images were acquired using a Hitachi H7600 transmission electron microscope and an AMT XR41B digital camera. Original magnification of HC and Pt2, ×3000; original magnification of Pt1, ×2500. (C) Neutrophils from HC either fresh (left) or shipped along with the patient sample (middle) and Pt2 (right) were incubated with FITC-dextran for 15 minutes. Cells were fixed and viewed using Images and were acquired using EVOS FL system with ×40 and ×100 magnification and analyzed with ImageJ software to determine the cell area, integrated density, and mean. Corrected total cell fluorescence = integrated density – (area × mean of background readings). (D) Total fluorescence of FITC-dextran cells corrected for background fluorescence. Calculations from 10 to 30 individual cells from each sample were plotted. P values were calculated using 1-way ANOVA correcting for multiple comparisons. ****P < .0001. (E) Neutrophil extracellular superoxide production kinetics measured every 15 seconds after fMLF treatment of cells from Pt1 (red) and Pt2 (green) compared with 6 HCs (blue line with error bars) showing superoxide production over 30 minutes, evaluated every 15 seconds. (F) Cumulative superoxide production after 30 minutes. (G) Net chemotactic velocity of 10 individual cells from patients 1 and 2 compared with 2 HC with buffer alone (left) or fMLF (right). Two-way analysis of variance (ANOVA) correcting for multiple comparisons was used for calculating significance. ****P < .0001. (H) Individual cell tracings from Pt1 (right) and HC (left) tracking movement and colored by 10-minute increments. AU, arbitrary unit; O.D., optical density.
Figure 3.
Figure 3.
Transfection of RAC2[E62K] drives increased ROS production, increased RAC2[E62K] association with PAK-protein binding domain, increased pAKT, and increased membrane ruffling and macropinocytosis. (A) Diogenes assay to measure ROS production in COS-7 cells transfected with NADPH oxidase components (gp91phox, p47phox, p67phox) and either RAC2[WT] (top), RAC2[E62K] (middle), or GFP (bottom) without stimulation (left) or after addition of 1 μM PMA (right). (B) Cumulative ROS production without (open bar) or with (filled bar) PMA stimulation; graph shows average ± standard error of the mean (SEM) of 1 representative experiment. (C) Immunoprecipitation of COS-7 cells transfected with RAC2[WT] or RAC2[E62K] using PAK1-PBD. Graph shows average ± SEM of 3 independent experiments. ***P = .0004. (D) Lysates from COS-7 cells transfected with RAC2[WT], RAC2[E62K], or untransfected were immunoblotted and stained for total AKT (tAKT) or phospho-AKT (S473). Bands were quantified by densitometry and the ratio of active, phospho-AKT/tAKT was plotted. Graph shows average ± SEM of 3 independent experiments (supplemental Figure 2B-D). (E) Confocal images of RAW264.7 cells (top, original magnification ×333) or COS-7 cells (bottom, original magnification ×235) transfected with RAC2[WT] (left) or RAC2[E62K] (right) and GFP as a transfection control. Cells were stained with Alexa-594-phalloidin (orange) to detect F-actin and Alexa-647-anti-RAC2 (red). Images were captured by a Zeiss LSM 880 confocal microscope and processed using the ZEN 2.3 lite program.
Figure 4.
Figure 4.
RAC2[E62K] has altered TIAM1-mediated GDP exchange and p50RhoGAP-mediated GTP hydrolysis. (A) GDP exchange assay using RAC2[WT] (red) and RAC2[E62K] (blue) preloaded with fluorescent mantGDP and incubated with unlabeled GDP. Intrinsic nucleotide exchange (open circles) and TIAM1-mediated exchange (filled circles) are shown. Ratio TIAM1:RAC2 = 1:1. (B) mantGDP dissociation rate of RAC2[WT] and RAC2[E62K] with and without TIAM1 calculated from panel A. Number of replicates, N = 4 for intrinsic dissociation and N = 2 for TIAM1-mediated dissociation. ***P < .0005. (P value calculated using the 1-way ANOVA followed by Tukey multiple comparison test). (C) GTP hydrolysis of RAC2[WT] and RAC2[E62K] preloaded with GTP without and with p50RhoGAP (1:500, p50RhoGAP:RAC2). Colored as in panel A. (D) GTP hydrolysis rate of RAC2[WT] and RAC2[E62K] preloaded with GTP, calculated from panel C. Data acquired in triplicate. **P < .005 (P value calculated as in panel B).
Figure 5.
Figure 5.
Rac2+/E62K mice recapitulate cytopenias, superoxide production, and increased neutrophil F-actin content seen in patients. (A) Peripheral blood cells from Rac2+/+ and Rac2+/E62K mice stained for lineage markers (n = 4 each group). Top, from left: CD3+ T cells, CD3+CD4+ T cells, CD3+CD8+ T cells, and CD20+ B cells (P value calculated using Student t test with Welch correction). (B) Splenic cell populations from Rac2+/+ and Rac2+/E62K mice identified by noted markers. Two-way ANOVA with Sidak multiple comparison test was used to determine significance. (C) Splenic T-cell subsets from Rac2+/+ and Rac2+/E62K mice identified by noted markers. Two-way ANOVA with Sidak multiple comparison test was used to determine significance. (D) Superoxide production after addition of fMLF in bone marrow neutrophils from Rac2+/+ (black lines) and Rac2+/E62K mice (red lines). Results combined from 2 independent experiments. (E) Phalloidin staining for F-actin in mouse bone marrow neutrophils from Rac2+/+ and Rac2+/E62K mice (n = 4 each group). Results combined from 2 independent experiments.

References

    1. Knaus UG, Heyworth PG, Evans T, Curnutte JT, Bokoch GM. Regulation of phagocyte oxygen radical production by the GTP-binding protein Rac 2. Science. 1991;254(5037):1512-1515. - PubMed
    1. Sells MA, Knaus UG, Bagrodia S, Ambrose DM, Bokoch GM, Chernoff J. Human p21-activated kinase (Pak1) regulates actin organization in mammalian cells. Curr Biol. 1997;7(3):202-210. - PubMed
    1. Abell AN, DeCathelineau AM, Weed SA, Ambruso DR, Riches DW, Johnson GL. Rac2D57N, a dominant inhibitory Rac2 mutant that inhibits p38 kinase signaling and prevents surface ruffling in bone-marrow-derived macrophages. J Cell Sci. 2004;117(Pt 2):243-255. - PubMed
    1. Hoppe AD, Swanson JA. Cdc42, Rac1, and Rac2 display distinct patterns of activation during phagocytosis. Mol Biol Cell. 2004;15(8):3509-3519. - PMC - PubMed
    1. Ambruso DR, Knall C, Abell AN, et al. . Human neutrophil immunodeficiency syndrome is associated with an inhibitory Rac2 mutation. Proc Natl Acad Sci USA. 2000;97(9):4654-4659. - PMC - PubMed

Publication types

Substances