. 2019 Apr 1;218(4):1265-1281.
doi: 10.1083/jcb.201808091. Epub 2019 Feb 5.

Cyclin B3 promotes anaphase I onset in oocyte meiosis

Affiliations

Cyclin B3 promotes anaphase I onset in oocyte meiosis

Mehmet E Karasu et al. J Cell Biol. .

Abstract

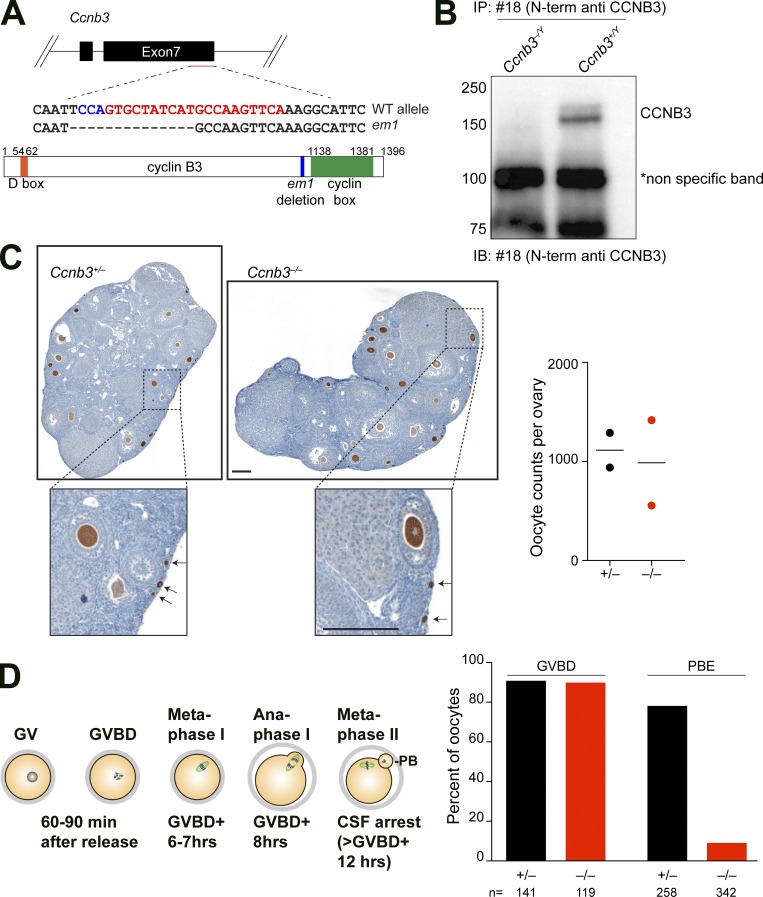
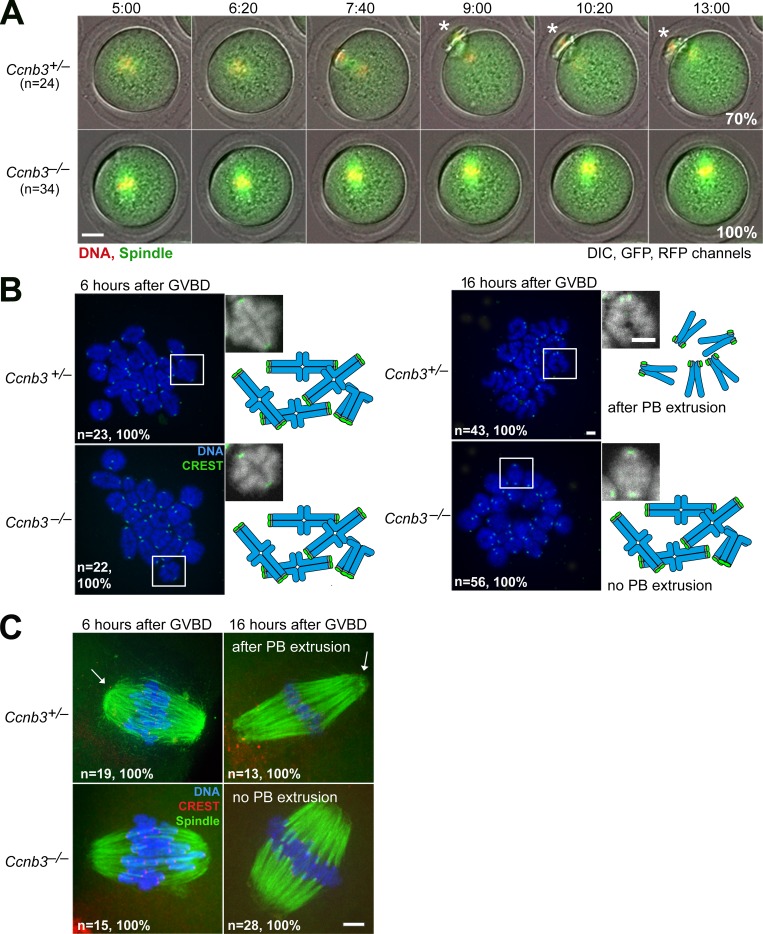
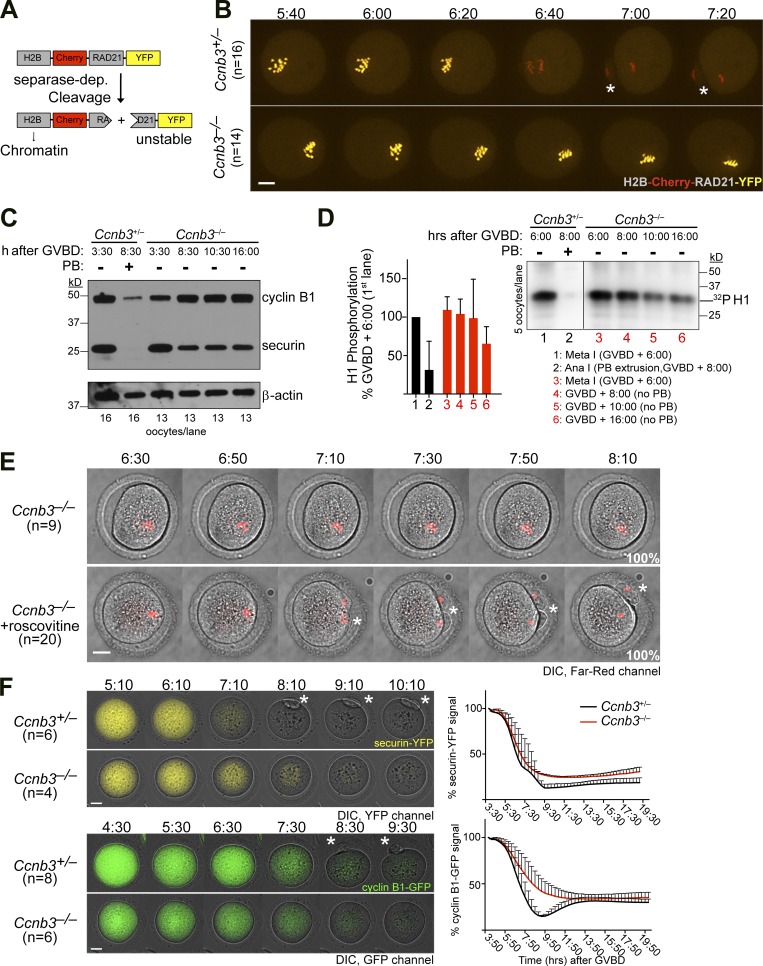
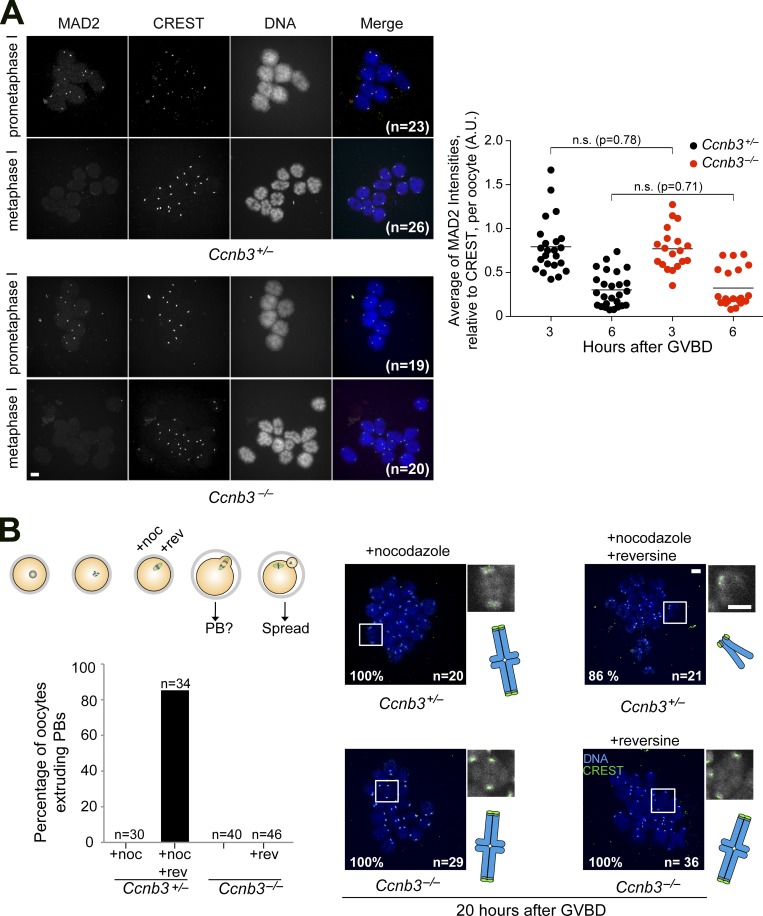
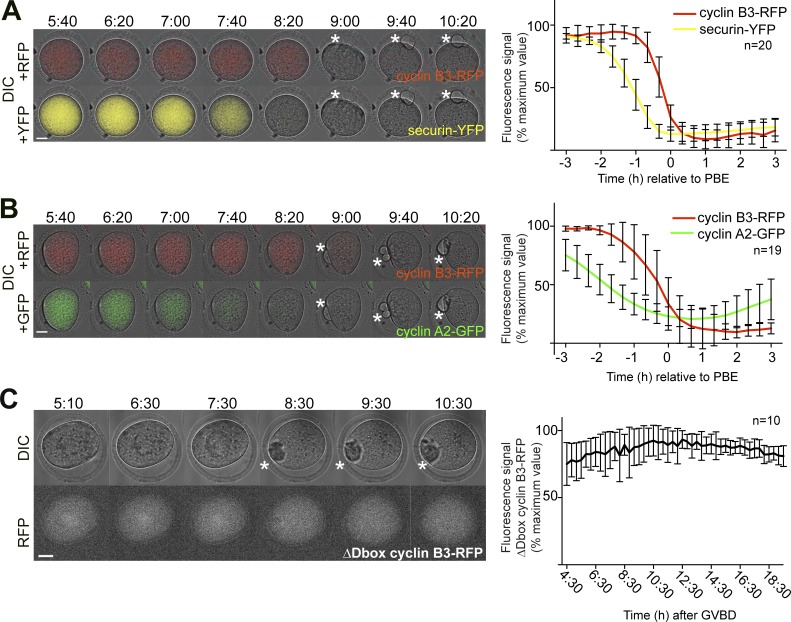
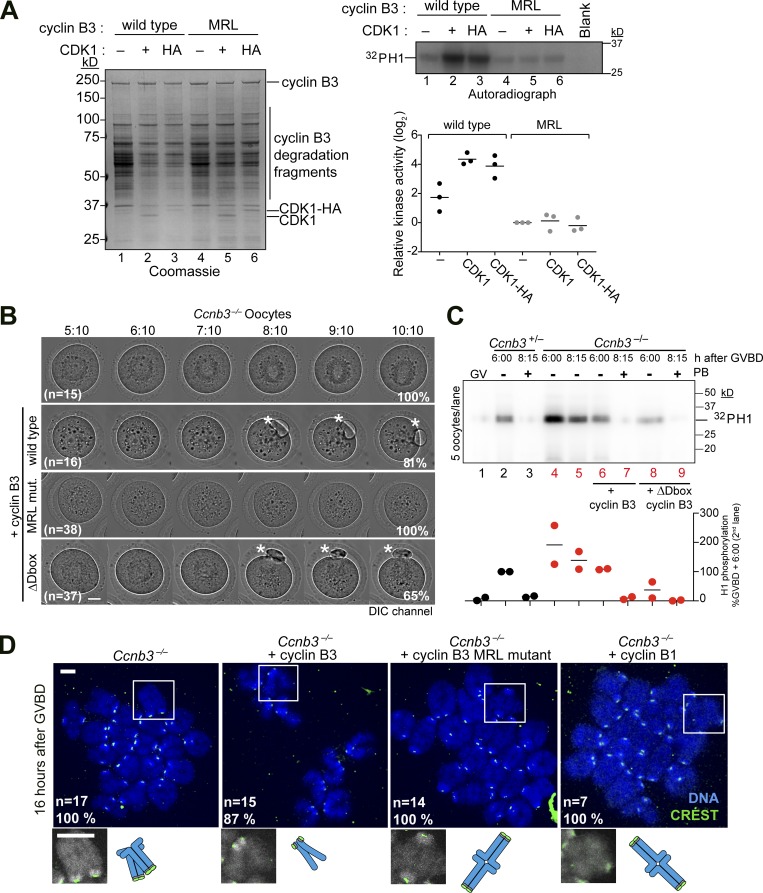
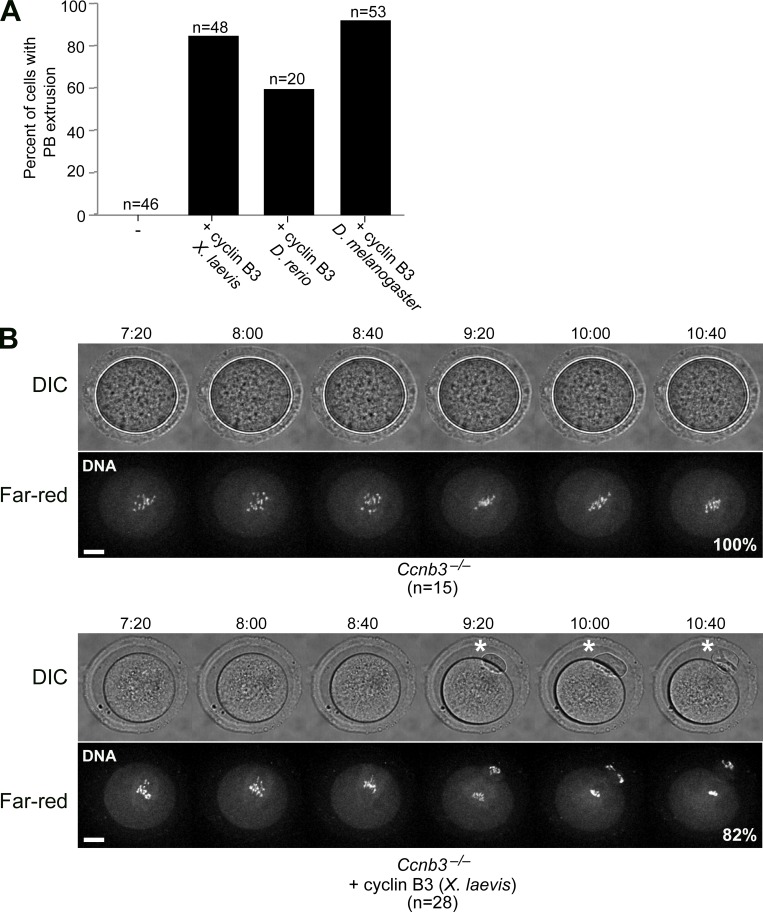
Meiosis poses unique challenges because two rounds of chromosome segregation must be executed without intervening DNA replication. Mammalian cells express numerous temporally regulated cyclins, but how these proteins collaborate to control meiosis remains poorly understood. Here, we show that female mice genetically ablated for cyclin B3 are viable-indicating that the protein is dispensable for mitotic divisions-but are sterile. Mutant oocytes appear normal until metaphase I but then display a highly penetrant failure to transition to anaphase I. They arrest with hallmarks of defective anaphase-promoting complex/cyclosome (APC/C) activation, including no separase activity, high CDK1 activity, and high cyclin B1 and securin levels. Partial APC/C activation occurs, however, as exogenously expressed APC/C substrates can be degraded. Cyclin B3 forms active kinase complexes with CDK1, and meiotic progression requires cyclin B3-associated kinase activity. Cyclin B3 homologues from frog, zebrafish, and fruit fly rescue meiotic progression in cyclin B3-deficient mouse oocytes, indicating conservation of the biochemical properties and possibly cellular functions of this germline-critical cyclin.


Figures

Figure 1.
Figure 1.
Generation of Ccnb3−/− mice reveals a requirement for cyclin B3 in female meiosis. (A) Targeted mutation of Ccnb3. Top: Exons 6 and 7 are shown as black rectangles. A portion of the sequences of the wild-type allele and em1 mutant allele are shown, with guide RNA position in red and the complement of the protospacer adjacent motif (PAM) sequence in blue. Bottom: Schematic of cyclin B3 protein. (B) Immunoprecipitation and Western blot analysis of adult testis extracts using an anti-cyclin B3 monoclonal antibody. (C) Apparently normal folliculogenesis and oocyte reserves in Ccnb3-deficient females. Left: PFA-fixed, anti-MVH–stained ovary sections from 3-mo-old animals. Zoomed images show presence of primary/primordial follicles indicated by black arrows. Scale bars, 500 µm. Right: Oocyte counts from two 3-mo-old females of each genotype. PFA-fixed ovaries were sectioned completely and stained with anti-MVH. Stained oocytes were counted in every fifth ovary section and summed. Each point is the count for one ovary of one animal; means are 1,114 for Ccnb3+/− and 987 for Ccnb3−/−. (D) The scheme illustrates progression through the meiotic divisions until metaphase II arrest in oocytes of the mouse strain used. The graph on the right shows percentages of mature oocytes of the indicated genotypes that underwent GVBD within 90 min in culture after release, and oocytes that extruded PBs. n: total number of oocytes counted in >10 independent experiments (GVBD: 141% Ccnb3+/−: 90.78%; 119 Ccnb3−/−: 89.91%; PB extrusion (PBE): 258 Ccnb3+/−: 78.13%; 342 Ccnb3−/−: 9.06%).
Figure 2.
Figure 2.
Cyclin B3 is required for the metaphase-to-anaphase I transition in oocytes. (A) Live-cell imaging of meiotic maturation. β-Tubulin-GFP and H2B-RFP mRNA, used to visualize spindle and chromosomes, were injected into GV-stage oocytes, which were then induced to enter meiosis I. Selected time frames are shown, with overlay of DIC, GFP, and RFP channels of collapsed z-sections (11 section, 3-µm steps) from a representative video. Time after GVBD is indicated as hours:minutes. n: number of oocytes analyzed. Percentage of oocytes of the observed phenotype from two independent experiments is indicated. White asterisks indicate PBs. Scale bar, 20 µm. Related to Videos 1 and 2. (B) Chromosome spreads 6 h (corresponding to metaphase I) and 16 h (corresponding to metaphase II in controls) after GVBD. Kinetochores were stained with CREST (green) and chromosomes with Hoechst (blue). Insets show typical chromosome figures observed; for better visualization, chromosomes are shown in grayscale. Schematics of metaphase I bivalents or metaphase II univalent chromosomes are shown to aid interpretation. Scale bar, 5 µm. n: number of oocytes analyzed in three independent experiments. (C) Whole-mount immunofluorescence staining of cold-treated spindles. Microtubules were stained with anti-tubulin antibody (green), kinetochores with CREST (red), and chromosomes with Hoechst (blue). Spindle poles typical of metaphase I and metaphase II are indicated with arrows in controls. Scale bar, 5 µm. n: number of oocytes analyzed in three independent experiments.
Figure 3.
Figure 3.
Cell cycle arrest in Ccnb3−/− oocytes is associated with incomplete APC/C activation. (A) Schematic of separase activity sensor. See text for details. (B) Failure to activate separase in the absence of cyclin B3. Separase activity sensor mRNA was injected into GV oocytes, which were released into meiosis I and visualized by spinning-disk confocal microscopy. Selected time frames of collapsed z-sections (11 sections, 3-µm steps) from a representative video are shown. Time points after GVBD are indicated as hours:minutes. Scale bar, 20 µm. White asterisks indicate PBs. n: number of oocytes from three independent experiments. (C) Western blot analysis of cyclin B1 and securin during oocyte maturation, at the time points, indicated as hours:minutes after GVBD. β-Actin served as the loading control. The number of oocytes used and the presence or absence of a PB are indicated. Two mice of each genotype were used per experiment. The data shown are representative of results from two independent experiments. (D) Total cyclin B–CDK1 activity during oocyte maturation, at the time points indicated as hours:minutes after GVBD. Histone H1 was used as a substrate. Five oocytes were used per kinase reaction; presence or absence of a PB is indicated. The graph shows quantification of phosphate incorporation from three independent experiments, and error bars indicate SD (means ± SD: lane 1: 100 [used for normalization]; lane 2: 31.27 ± 37.28; lane 3: 109.34 ± 17.09; lane 4: 104.05 ± 19.33; lane 5: 98.67 ± 50.56; lane 6: 65.40 ± 22.12). (E) CDK inhibition rescues meiosis I division. Oocytes were incubated with siR-DNA to visualize chromosomes. In metaphase I, 6 h 20 min after GVBD, oocytes were treated with 0.2 mM roscovitine (final concentration), where indicated, and the video was started. Selected time frames of collapsed z-sections (11 sections, 3-µm steps) of DIC far-red channel from a representative movie of Ccnb3−/− oocytes with or without roscovitine treatment are shown. The asterisk indicates chromosome segregation in anaphase I. Time points after GVBD are indicated as hours:minutes. Scale bar: 20 µm. n: number of oocytes from three independent experiments. (F) Degradation of exogenous APC/C substrates. Securin-YFP (top) or cyclin B1–GFP (bottom) mRNA was injected into GV oocytes. Stills from representative videos are shown. Time points after GVBD are indicated as hours:minutes. Scale bar, 20 µm. n: number of oocytes from two independent experiment); white asterisk indicates PB extrusion (PBE). Fluorescence intensities (mean ± SD) were quantified from the indicated number of oocytes imaged (securin-YFP: 4 Ccnb3−/−, 6 Ccnb3+/−; cyclin B1–GFP injections: 6 Ccnb3−/−, 8 Ccnb3+/−).
Figure 4.
Figure 4.
SAC activation is not the cause of metaphase I arrest in Ccnb3−/− oocytes. (A) Left: Chromosome spreads were prepared 3 h (early prometaphase I) and 6 h (metaphase I) after GVBD, then stained with Hoechst (blue), CREST (green), and anti-MAD2 (red). Scale bar, 5 µm. Right: Quantification of MAD2 signal intensity relative to CREST; each point is the mean relative intensity averaged across centromeres in an oocyte. n: number of oocytes from three independent experiments. P values are from t tests. Number and means of oocytes stained 3 h after GVBD: 23 Ccnb3+/− (mean: 0.794) and 19 Ccnb3−/− (mean: 0.77); 6 h after GVBD: 26 Ccnb3+/− (mean: 0.302) and 20 Ccnb3−/− (mean: 0.325). (B) Oocytes were treated with reversine to override a potential SAC arrest. Control oocytes were treated with nocodazole from 6 h after GVBD onward, whereas Ccnb3−/− oocytes were allowed to arrest without nocodazole. 6 h 40 min after GVBD, reversine was added, PB extrusion was scored visually (graph on the right, n: number of oocytes scored per genotype. 0% of oocytes extruded PBs, except oocytes treated with nocodazole and reversine, which extruded PBs in 85.29% of oocytes analyzed), and all oocytes were spread 20 h after GVBD. Kinetochores were stained with CREST (green) and chromosomes with Hoechst (blue). Insets show typical chromosome figures observed. Scale bar, 5 µm. n: the number of spreads from three independent experiments that allowed to unambiguously distinguish bivalents from univalents; percentage of oocytes with same phenotype is indicated.
Figure 5.
Figure 5.
Ordered degradation of APC/C substrates in oocyte meiosis I. (A and B) Cyclin B3 was degraded after securin or cyclin A2. mRNA encoding cyclin B3–RFP and either securin-YFP (A; 20 oocytes) or cyclin A2–GFP (B; 19 oocytes) were coinjected into GV oocytes of CD-1 mice. Each panel shows selected frames from a video of a representative oocyte, with an overlay of DIC and RFP channels in the top rows, and DIC and YFP or GFP channels in the bottom rows. (C) The D box of cyclin B3 is required for degradation. CD-1 GV oocytes (10 oocytes) were injected with mRNA encoding cyclin B3–RFP with the D box deleted (ΔDbox). Frames from a representative video are shown, with the DIC channel on top and RFP at the bottom. All panels: Time points after GVBD (BD) are indicated as hours:minutes. Scale bars, 20 µm. White asterisks: PBs. Quantification of fluorescence intensities is shown on the right (mean ± SD of the indicated number of oocytes from three independent experiments).
Figure 6.
Figure 6.
Only cyclin B3 that can support in vitro kinase activity can rescue Ccnb3−/− oocytes. (A) Affinity purification of cyclin B3–CDK1 complexes. MBPHiscyclin B3 or MBPHiscyclin B3 MRL mutant were expressed in insect cells alone or coexpressed with either untagged or HA-tagged CDK1. Left: The eluates from purification on amylose resin were separated on SDS-PAGE and stained with Coomassie. Right: Representative autoradiograph (top) and quantification (bottom) from histone H1 kinase assays. In the graph, values in each experiment (n = 3) were normalized to the signal from the MBPHiscyclin B3 MRL sample (lane 4 in the autoradiograph); lines indicate means (lane 1: 1.733; lane 2: 4.351; lane 3: 3.878; lane 4: 0 [used for normalization]; lane 5: 0.121; lane 6: −0.202). (B) Rescue of Ccnb3−/− oocytes by expression of exogenous cyclin B3. Ccnb3−/− oocytes were sham injected or injected with the indicated cyclin mRNA, then released into meiosis I. Frames of representative videos are shown. Times after GVBD are indicated as hours:minutes, and percentages of oocytes of the shown phenotypes are indicated. Scale bar, 20 µm. White asterisks: PBs. n: number of oocytes from three independent experiments. (C) Total cyclin B–CDK1 activity during oocyte maturation, in control (lane 1–3), and Ccnb3−/− (lanes 4–9, labeled in red) oocytes expressing wild-type cyclin B3 (lanes 6 and 7) or ΔDbox cyclin B3 (lanes 8 and 9), at the time points indicated as hours:minutes after GVBD. Oocytes extruding PBs are indicated. Histone H1 was used as a substrate. A representative example from two independent experiments is shown above; quantification of both experiments is shown below (32P-H1 signal normalized to the signal in lane 2; points are values from each experiment; lines indicate means: lane 1: 6.61; lane 2: 100 [used for normalization]; lane 3: 14.38; lane 4: 191.58; lane 5: 138.53; lane 6: 109.88; lane 7: 9.59; lane 8: 37.36; lane 9: 1.5). (D) Representative chromosome spreads 16 h after GVBD. Chromosomes were stained with Hoechst (blue) and kinetochores with CREST (green). Insets show typical chromosome figures observed (chromosomes are shown in grayscale). Scale bar, 5 µm. n: number of oocytes from three independent experiments. Schematics of metaphase I bivalents or metaphase II univalent chromosomes are shown to aid interpretation.
Figure 7.
Figure 7.
Interspecies cross-complementation of Ccnb3−/− oocytes. (A) Ccnb3−/− oocytes were injected with the indicated mRNA, induced to enter meiosis I, and scored for PB extrusion. n: number of oocytes from three independent experiments; number of oocytes analyzed and percentage of PB extrusion: 46 Ccnb3−/− sham injected oocytes (0% PBs), 48 Ccnb3−/− oocytes injected with mRNA coding for X. laevis cyclin B3 (85.41%), 20 Ccnb3−/− oocytes with D. rerio cyclin B3 mRNA (60%), and 53 Ccnb3−/− oocytes with D. melanogaster cyclin B3 mRNA (92.45%). (B) Selected time frames of collapsed z-sections (12 sections, 3-µm steps) from a representative spinning disk confocal movie of Ccnb3−/− sham-injected oocytes, and Ccnb3−/− oocytes injected with X. laevis cyclin B3 mRNA. Before live imaging, oocytes were incubated with SiR-DNA. Top panel shows the DIC channel and bottom panel shows siR-DNA staining in far-red. Time points after GVBD are indicated as hours:minutes. Scale bar: 20 µm. White asterisks: PBs. n: number of oocytes from three independent experiments.

Similar articles

Cited by

References

    1. Alfieri C., Zhang S., and Barford D.. 2017. Visualizing the complex functions and mechanisms of the anaphase promoting complex/cyclosome (APC/C). Open Biol. 7:170204 10.1098/rsob.170204 - DOI - PMC - PubMed
    1. Baltus A.E., Menke D.B., Hu Y.C., Goodheart M.L., Carpenter A.E., de Rooij D.G., and Page D.C.. 2006. In germ cells of mouse embryonic ovaries, the decision to enter meiosis precedes premeiotic DNA replication. Nat. Genet. 38:1430–1434. 10.1038/ng1919 - DOI - PubMed
    1. Bendris N., Lemmers B., Blanchard J.M., and Arsic N.. 2011. Cyclin A2 mutagenesis analysis: a new insight into CDK activation and cellular localization requirements. PLoS One. 6:e22879 10.1371/journal.pone.0022879 - DOI - PMC - PubMed
    1. Bolcun-Filas E., Rinaldi V.D., White M.E., and Schimenti J.C.. 2014. Reversal of female infertility by Chk2 ablation reveals the oocyte DNA damage checkpoint pathway. Science. 343:533–536. 10.1126/science.1247671 - DOI - PMC - PubMed
    1. Bouchoux C., and Uhlmann F.. 2011. A quantitative model for ordered Cdk substrate dephosphorylation during mitotic exit. Cell. 147:803–814. 10.1016/j.cell.2011.09.047 - DOI - PubMed

Publication types

MeSH terms

Associated data