. 2019 Mar 4;216(3):621-637.
doi: 10.1084/jem.20181216. Epub 2019 Feb 5.

Type I interferon induces CXCL13 to support ectopic germinal center formation

Affiliations

Type I interferon induces CXCL13 to support ectopic germinal center formation

Alice E Denton et al. J Exp Med. .

Abstract

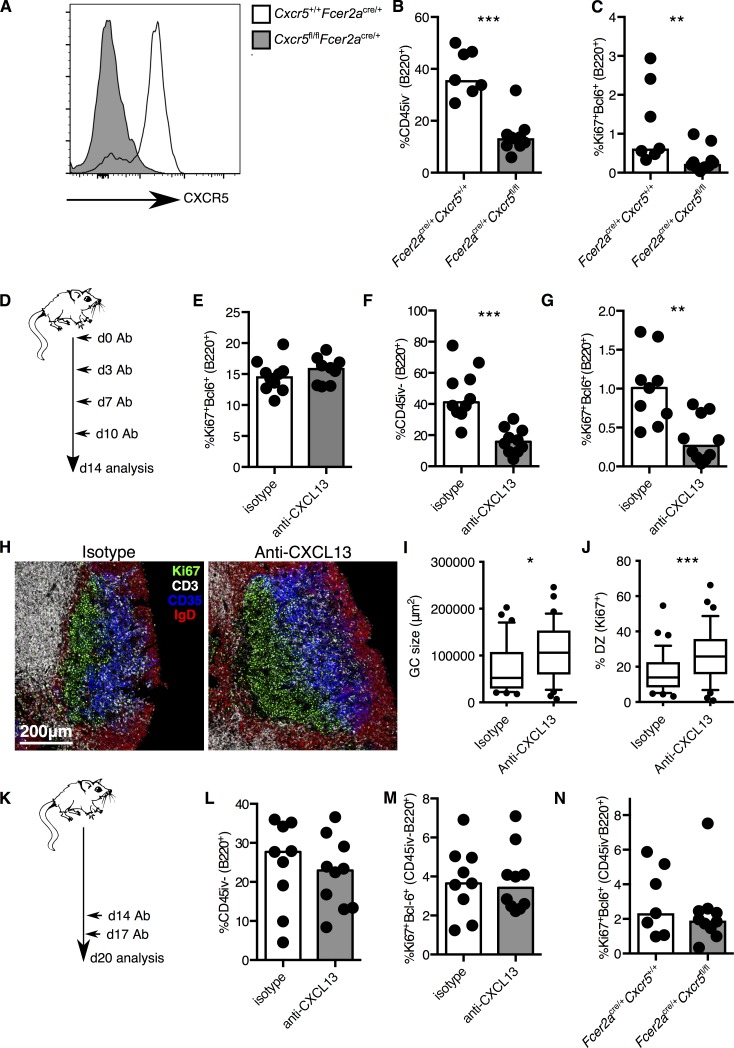
Ectopic lymphoid structures form in a wide range of inflammatory conditions, including infection, autoimmune disease, and cancer. In the context of infection, this response can be beneficial for the host: influenza A virus infection-induced pulmonary ectopic germinal centers give rise to more broadly cross-reactive antibody responses, thereby generating cross-strain protection. However, despite the ubiquity of ectopic lymphoid structures and their role in both health and disease, little is known about the mechanisms by which inflammation is able to convert a peripheral tissue into one that resembles a secondary lymphoid organ. Here, we show that type I IFN produced after viral infection can induce CXCL13 expression in a phenotypically distinct population of lung fibroblasts, driving CXCR5-dependent recruitment of B cells and initiating ectopic germinal center formation. This identifies type I IFN as a novel inducer of CXCL13, which, in combination with other stimuli, can promote lung remodeling, converting a nonlymphoid tissue into one permissive to functional tertiary lymphoid structure formation.


Figures

None
Graphical abstract
Figure 1.
Figure 1.
GCs are induced in the lung after IAV infection. (A) Confocal image of B220 (green), CD3 (white), and AID (huCD2, blue) staining in lung tissue 14 d after IAV infection. Scale bar, 50 µm. (B) Flow cytometric plots identifying Bcl6+Ki67+AID+ GC B cells in the draining medLN and lung 14 d after IAV infection. (C) Quantification of Bcl6+Ki67+AID+ GC B cells (expressed as a percentage of B cells) at indicated time points after IAV infection; symbols show the median, and error bars show the interquartile range. (A–C) Representative of two independent experiments with four to six mice per group. (D–F) Flow cytometric plots and quantification of LZ and DZ phenotype Bcl6+Ki67+B220+CD19+ GC B cells in the medLN and lung 14 d after IAV infection. Numbers in D indicate the proportion of LZ (CXCR4+CD86) and DZ (CXCR4CD86+) cells among GC B cells. Representative of two independent experiments with six or seven mice per group. (G) Confocal image of B220 (white), CD35 (blue), and Ki67 (green) staining in lung tissue 14 d after IAV infection. Scale bar, 200 µm. Representative of two independent experiments with four mice per group. (H) Flow cytometric plots identifying Bcl6+CXCR5+PD-1+CD4+Foxp3 Tfh cells in the draining medLN and lung 14 d after IAV infection. Numbers indicate the proportion of Tfh (CXCR5+PD-1+) or non-Tfh (CXCR5PD-1) cells among T cells. In bar plots, the height of the bar is the median, and each symbol represents one biological replicate. Representative of four independent experiments with four to eight mice per group. Statistical significance was determined with a two-sided Mann–Whitney U test (**, P < 0.01; ***, P < 0.001).
Figure 2.
Figure 2.
Tfh cells are required for lung GC formation. (A) Quantification by flow cytometry of lung Bcl6+Ki67+CD19+ GC B cells (expressed as a percentage of B cells) in Tcra−/− and control C57BL/6 mice 14 d after IAV infection. Representative of two independent experiments with three to eight mice per group. (B and C) Correlation of Bcl6+Ki67+CD19+ GC B cells and Bcl6+PD-1+CD4+Foxp3 Tfh cells in the medLN (B; R2 = 0.82, P < 0.0001) and lung (C; R2 = 0.75, P < 0.0001) 14 d after IAV infection. R2 and P values were calculated using Pearson correlation coefficient. Data are representative of three independent experiments with 15–16 mice per group. (D–F) Flow cytometric dot plots (D) and quantification of CXCR5+PD-1+CD4+Foxp3 Tfh cells (E) and Bcl6+Ki67+CD19+ GC B cells (F) in the lung 14 d after IAV infection of Bcl6fl/flCd4cre/+ mice and Bcl6fl/flCd4+/+ littermate controls. Numbers in D indicate the proportion of CXCR5+PD-1+ Tfh cells among T cells. Data are representative of three independent experiments with six to eight mice per group. (G) Quantification of Bcl6+Ki67+CD19+ GC B cells in the lung 14 d after IAV infection of Sh2d1a−/y mice and Sh2d1a+/y littermate controls. Data are representative of two independent experiments with six mice per group. (H–J) Flow cytometric contour plots (H) and quantification of CXCR3+Tbet+CD4+Foxp3 Th1 cells (I), CXCR5+PD-1+CD4+Foxp3 Tfh cells (J), and Bcl6+Ki67+CD19+ GC B cells (K) in the lung 14 d after IAV infection of Tbx21fl/fl Cd4cre/+ mice and Tbx21fl/fl Cd4+/+ littermate controls. Numbers in H indicate the proportion of CXCR3+T-bet+ cells among T cells. Data are representative of three independent experiments with six to eight mice per group. (L and M) Flow cytometric dot plots (L) and quantification of the proportion of GL-7+CD38B220+CD19+ GC B cells (M) expressing c-Myc (GFP) in the medLN and lung 14 d after IAV infection. Numbers in L indicate the proportion of GFP+ (c-Myc+) cells among GC B cells. Data are representative of three independent experiments with four to eight mice per group. (N) Proportion of IL-7Rα+ cells among CXCR5+PD-1+CD4+ Tfh cells in the medLN and lung 14 d after IAV infection. Data are representative of two independent experiments with six or seven mice per group. In bar plots, the height of the bar is the median, and each symbol represents one biological replicate. Statistical significance was determined with a two-sided Mann–Whitney U test (*, P < 0.05; **, P < 0.01; ***, P < 0.001; ****, P < 0.0001).
Figure 3.
Figure 3.
De novo induction of Cxcl13 recruits B cells into the lung after IAV infection. (A) Proportion of CD4+ T cells and B220+ B cells in the lung parenchyma at the indicated days after IAV infection. Parenchymal lymphocytes are defined as those that do not bind anti-CD45 administered i.v. 3 min before euthanasia. (B) Confocal images of CD31+ blood vessels (red), CD3+ T cells (white), and B220+ B cells (blue) at indicated days after IAV infection. Scale bar, 100 µm. (A and B) Data are representative of two independent experiments with five mice per group. (C) Flow cytometric histogram and quantification of CD45i.v.B220+CD19+ B cells in the lung 6 d after IAV infection of Cxcr3fl/fl Tg(Fcer2acre) mice and Cxcr3+/+ Tg(Fcer2acre) control mice. Data are representative of two independent experiments with four or five mice per group. (D) Representative flow cytometric dot plot, and proportions of polyclonal or HEL-binding B220+CD19+ B cells that are CD45i.v. in the lung 6 d after IAV infection of SWHEL mice. Numbers indicate the proportion of cells within each quadrant among B220+CD19+ B cells. Data are representative of two independent experiments with four mice per group. (E) Proportion of parenchymal B cells, as determined by lack of CD45i.v. labeling, in either WT or Rag2−/−Il2rg−/− mice that have been irradiated and reconstituted with WT BM 8 wk before infection. Data are representative of two independent experiments with 8–10 mice per group. (F and G) Number of B cells in the blood (F; CD45i.v.+B220+CD19+CXCR5+) or the lung parenchyma (G; CD45i.v.B220+CD19+CXCR5+) 6 d after IAV infection, where FTY720 was administered on days 3 and 5 after IAV infection. Data are representative of two independent experiments with five mice per group. (H) Quantitative RT-PCR detection of Cxcl13 and Ccl19 transcripts in whole-lung mRNA at the indicated days after IAV infection. Data are representative of two independent experiments with three mice per group. (I) Quantification of CD45i.v.B220+CD19+ B cells in the lung parenchyma 6 d after IAV infection of B:Ccr7/ chimeras and control B:Ccr7+/+ chimeras. Data are representative of two independent experiments with six to eight mice per group. (J) Quantification of CD45i.v.B220+CD19+ B cells in the lung parenchyma 6 d after IAV infection of Cxcr5fl/fl Tg(Fcer2acre) mice and Cxcr5+/+ Tg(Fcer2acre) control mice. Data are representative of five independent experiments with four to seven mice per group. (K) Quantification of CD45i.v.B220+CD19+ B cells in the lung parenchyma in uninfected Cxcr5fl/fl Tg(Fcer2acre) mice and Cxcr5+/+ Tg(Fcer2acre) control mice. Data are representative of two independent experiments with five mice per group. In A and H, each symbol represents the median; the error bars show standard deviation. In bar plots, the height of the bar is the median, and each symbol represents one biological replicate. In C and E–K, statistical significance was determined with a two-sided Mann-Whitney U test. In D, the P value was calculated using a paired t test and is representative of two independent experiments. **, P < 0.01.
Figure 4.
Figure 4.
B cell–intrinsic CXCR5 expression is required to establish a lung GC response but is dispensable for its maintenance. (A) Flow cytometric histogram of CXCR5 expression on lung CD19+B220+ B cells from Cxcr5fl/fl Tg(Fcer2acre) mice and Cxcr5+/+ Tg(Fcer2acre) control mice 14 d after IAV infection. (B and C) Quantification of CD45i.v.B220+ (B) and Ki67+Bcl6+B220+ GC B cells (C) in the lung parenchyma 14 d after IAV infection of Cxcr5fl/fl Tg(Fcer2acre) mice and Cxcr5+/+ Tg(Fcer2acre) control mice. Data are representative of four independent experiments with five to eight mice per group. (D) Experimental design of experiment to block CXCL13 through IAV infection. (E–G) Proportion of medLN Ki67+Bcl6+B220+ GC B cells (E) and CD45i.v.B220+ B cells (F) in the lung parenchyma and lung Ki67+Bcl6+B220+ GC B cells (G) in WT mice dosed with anti-CXCL13 antibody or isotype control as shown in D. Data are representative of two independent experiments with 10 mice per group. (H) Confocal image of medLNs from mice treated as in D showing the GC as defined by CD3 (white), IgD (red), CD35 (blue), and Ki67 (green) staining. Scale bar, 200 µm. (I and J) Analysis of medLN GC structure after anti-CXCL13 administration, quantifying GC size (in square micrometers; I) and the proportion of the GC that is DZ, as defined by Ki67 positivity (J). Data are representative of two independent experiments with five mice per group. (K) Experimental design of the experiment to block CXCL13 after GC formation. (L and M) Proportion of CD45i.v.B220+ B cells in the lung parenchyma (L) and lung Ki67+Bcl6+B220+ GC B cells (M) in C57BL/6 mice dosed with anti-CXCL13 antibody or isotype control as shown in H. Data are representative of two independent experiments with 10 mice per group. (N) Frequency of Ki67+Bcl6+B220+ GC B cells within the CD45i.v. lung resident B cell population in Cxcr5fl/fl Tg(Fcer2acre) mice and Cxcr5+/+ Tg(Fcer2acre) control mice 14 d after IAV infection. Data are representative of four independent experiments with five to eight mice per group. In bar plots, the height of the bar is the median, and each symbol represents one biological replicate. In I and J, box and whiskers show the 10th–90th percentile range. P values shown were calculated using a Mann–Whitney U test (*, P < 0.05; **, P < 0.01; ***, P < 0.001).
Figure 5.
Figure 5.
IAV infection induces CXCL13 in pulmonary PDGFRα+ fibroblasts. (A) Quantitative RT-PCR analysis of Cxcl13 in the indicated cell populations purified from the uninfected lung or lung 5 d after IAV infection. Data are representative of two independent experiments with three mice per group. (B–D) Confocal images (B) of CXCL13-tdTomato (red), CD31 (white), and B220 (blue) and flow cytometry quantification (C and D) of CXCL13-expressing cells in lung tissue 5 d after IAV infection of Tg(Cxcl13cre-dTomato) or littermate control mice. Scale bar, 100 µm. Numbers in C indicate the proportion of RFP+ cells within the indicated populations. Data are representative of three independent experiments with four to eight mice per group. (E and F) Flow cytometric phenotyping of CD45CD31PDGFRα+CXCL13+ (gray) and CXCL13 (white) cells isolated 5 and 14 d after IAV infection from lung alongside CD45+ cells for staining reference (F only, dashed line). The expression of gp38, PDGFRα, or Sca1 (E) and CD21/35, MHC II, or CD44 (F) in the indicated populations was determined by mean fluorescence intensity (MFI) of staining or proportion of cells expressing the marker (CD21/35 only). Data are representative of three independent experiments with four to six mice per group. P values in A and D were calculated using a two-way ANOVA. P values in E and F were calculated using a Mann–Whitney U test. *, P < 0.05; **, P < 0.01; ***, P < 0.001.
Figure 6.
Figure 6.
Type I IFN induces Cxcl13 expression in the lung in vivo. (A) Cxcl13 induction in whole-lung mRNA in Rag2−/−Il2rg−/− and Rag2+/+Il2rg+/+ WT control mice 5 d after IAV infection. Data are representative of two independent experiments with five or six mice per group. (B) Heat map of cytokine mRNA expression from a whole-lung microarray dataset at the indicated days after IAV infection. Expression for each probeset is shown relative to mock-infected animals. Data were reanalyzed from a previously published dataset (Pommerenke et al., 2012). (C) Quantitative RT-PCR analysis of Cxcl13 in lung fibroblasts stimulated with the indicated cytokine for 6 h in vitro, the dotted line indicates a fold change of one over unstimulated cells. In all dot plots, each symbol represents an independent biological replicate, and data are representative of three independent experiments with four mice per group. (D) Quantitative RT-PCR analysis of Ifnb1 in the indicated cell populations purified from the uninfected lung, or lung 5 d after IAV infection. Ifnb1 level is represented as expression relative to Gapdh in each cell type; nd, not detected. Data are representative of two independent experiments with three mice per group. (E) Regression coefficients for each gene are plotted against mean normalized gene expression values (change from day 1 to day 3; WT vs. Ifnar1−/−). IFN-responsive (top) or chemokine (bottom) genes are highlighted in blue (P > 0.05) or red (P < 0.05; F test across days 1, 3, and 4, after multiple correction testing). (F) Expression of pulmonary Cxcl13 relative to uninfected animals 3 d after IAV infection as determined by microarray. Data were reanalyzed from a previously published dataset (Cilloniz et al., 2010). (G and H) Quantitative RT-PCR for Mx1 (G) and Cxcl13 (H) in whole-lung mRNA samples taken 24 h following i.n. administration of IFNβ. Data are representative of two independent experiments with ten mice per group. For two-way comparisons, P values shown were calculated using a Mann–Whitney U test. **, P < 0.01; ***, P < 0.001. In all dot plots, each symbol represents an independent biological replicate.
Figure 7.
Figure 7.
IFNβ combined with cGAMP induces B cell trafficking and pulmonary GCs. (A and B) WT mice were administered IFNβ i.n. on days 0, 2, and 4 (A), and the ability of B cells to enter the lung parenchyma was determined on day 6 by i.v. anti-CD45 labeling (B). Data are representative of four independent experiments with five mice per group. (C) WT mice were treated with IFNβ and/or cGAMP i.n. as in A, and the proportion of B cells that had entered the lung parenchyma was determined by anti-CD45i.v. labeling. Data are representative of two independent experiments with five mice per group. (D–F) WT mice were administered NP-KLH with IFNβ and/or cGAMP i.n. on days 0, 1, and 2, and the development of GCs was determined in the lung and medLN 14 d after the first dose. GC B cell staining (D) in medLN (top) and lung (bottom) is shown for mice administered NP-KLH/IFNβ/cGAMP, determined by Bcl6 and Ki67 expression on B220+CD19+CD45+ cells. Antigen specificity was also demonstrated by costaining for NP and IgG1 on GC B cells (CD45+CD19+B220+Bcl6+Ki67+). Numbers in flow plots (D) indicate the proportion of GC B cells among B cells and the proportion of GC B cells that are antigen specific. The proportion of GC B cells was also determined in the medLN (E) and lung (F) in all treatment groups. Data are representative of two independent experiments with five mice per group. P values were calculated using a two-way ANOVA test, and each symbol represents a biological replicate. **, P < 0.01; ***, P < 0.001; ns, not significant.

References

    1. Acton S.E., Farrugia A.J., Astarita J.L., Mourão-Sá D., Jenkins R.P., Nye E., Hooper S., van Blijswijk J., Rogers N.C., Snelgrove K.J., et al. . 2014. Dendritic cells control fibroblastic reticular network tension and lymph node expansion. Nature. 514:498–502. 10.1038/nature13814 - DOI - PMC - PubMed
    1. Adachi Y., Onodera T., Yamada Y., Daio R., Tsuiji M., Inoue T., Kobayashi K., Kurosaki T., Ato M., and Takahashi Y.. 2015. Distinct germinal center selection at local sites shapes memory B cell response to viral escape. J. Exp. Med. 212:1709–1723. 10.1084/jem.20142284 - DOI - PMC - PubMed
    1. Anderson K.G., Sung H., Skon C.N., Lefrancois L., Deisinger A., Vezys V., and Masopust D.. 2012. Cutting edge: intravascular staining redefines lung CD8 T cell responses. J. Immunol. 189:2702–2706. 10.4049/jimmunol.1201682 - DOI - PMC - PubMed
    1. Barone F., Nayar S., Campos J., Cloake T., Withers D.R., Toellner K.M., Zhang Y., Fouser L., Fisher B., Bowman S., et al. . 2015. IL-22 regulates lymphoid chemokine production and assembly of tertiary lymphoid organs. Proc. Natl. Acad. Sci. USA. 112:11024–11029. 10.1073/pnas.1503315112 - DOI - PMC - PubMed
    1. Bénézech C., Luu N.T., Walker J.A., Kruglov A.A., Loo Y., Nakamura K., Zhang Y., Nayar S., Jones L.H., Flores-Langarica A., et al. . 2015. Inflammation-induced formation of fat-associated lymphoid clusters. Nat. Immunol. 16:819–828. 10.1038/ni.3215 - DOI - PMC - PubMed

Publication types

MeSH terms