. 2019 Apr 5;294(14):5720-5734.
doi: 10.1074/jbc.RA118.006706. Epub 2019 Feb 5.

Characterization of the ATP4 ion pump in Toxoplasma gondii

Affiliations

Characterization of the ATP4 ion pump in Toxoplasma gondii

Adele M Lehane et al. J Biol Chem. .

Abstract

The Plasmodium falciparum ATPase PfATP4 is the target of a diverse range of antimalarial compounds, including the clinical drug candidate cipargamin. PfATP4 was originally annotated as a Ca2+ transporter, but recent evidence suggests that it is a Na+ efflux pump, extruding Na+ in exchange for H+ Here we demonstrate that ATP4 proteins belong to a clade of P-type ATPases that are restricted to apicomplexans and their closest relatives. We employed a variety of genetic and physiological approaches to investigate the ATP4 protein of the apicomplexan Toxoplasma gondii, TgATP4. We show that TgATP4 is a plasma membrane protein. Knockdown of TgATP4 had no effect on resting pH or Ca2+ but rendered parasites unable to regulate their cytosolic Na+ concentration ([Na+]cyt). PfATP4 inhibitors caused an increase in [Na+]cyt and a cytosolic alkalinization in WT but not TgATP4 knockdown parasites. Parasites in which TgATP4 was knocked down or disrupted exhibited a growth defect, attributable to reduced viability of extracellular parasites. Parasites in which TgATP4 had been disrupted showed reduced virulence in mice. These results provide evidence for ATP4 proteins playing a key conserved role in Na+ regulation in apicomplexan parasites.

Keywords: ATPase; Na+ pump; TgATP4; Toxoplasma gondii; cipargamin; drug action; malaria; membrane transport; protozoan parasite; sodium transporter.


Conflict of interest statement

The authors declare that they have no conflicts of interest with the contents of this article

Figures

Figure 1.
Figure 1.
Phylogenetic analysis of TgATP4. A phylogenetic tree of type II P-type ATPases shows the previously defined groups type IIA, B, C, and D and a new group, the ATP4-type ATPases. The latter group, shaded in green, includes PfATP4 and TgATP4 (indicated by arrows). The tree was created using maximum likelihood analysis of protein amino acid sequence using the phylogenetic software package PHYLIP. PMCA, plasma membrane Ca2+ ATPase; SERCA, sarco/endoplasmic reticulum Ca2+-ATPase; SPCA, secretory pathway Ca2+-ATPase.
Figure 2.
Figure 2.
Localization of TgATP4 and the effect of down-regulating its expression on T. gondii growth. A, Western blotting of TgATP4-HA–expressing parasites performed using an anti-HA antibody. B, immunofluorescence assay of TgATP4-HA protein (green) reveals co-localization with the plasma membrane marker P30 (red). The scale bar represents 2 μm. DIC, differential interference contrast. C, Western blotting of iHA-TgATP4 parasites grown for 0–3 days on ATc. Parasite protein extracts were probed with anti-HA (top) and anti-GRA8, an antibody against a dense granule protein, as a loading control (bottom). D, growth of the WT/Tomato, iHA-TgATP4/Tomato, and iHA-TgATP4/Tomato/cTy1-TgATP4 parasites in the absence of ATc (black symbols), in the presence of ATc (from day 0, red symbols), and in the presence of ATc from 3 days before the start of the assay (gray symbols). The data show the mean ± S.D. of four independent experiments. For each parasite line and day (from Day 1 onward), the growth under the three different conditions was compared using a one-way ANOVA with blocking (see “Experimental procedures”). Statistically significant differences (p < 0.05) were only observed for the iHA-TgATP4/Tomato parasite line. For this line, the difference between the −ATc and +ATc since Day −3 conditions was statistically significant from Day 2 onward, and the difference between the −ATc and +ATc conditions was significant on Days 4 and 5. There was also a significant difference between the +ATc and “+ATc since Day −3 conditions on Days 2, 4, 5, and 6.
Figure 3.
Figure 3.
Investigation of the importance of TgATP4 for intracellular growth, egress, and invasion. A, to measure intracellular parasite growth, WT/Tomato and iHA-TgATP4/Tomato parasites were grown in the presence and absence of ATc for 2 days. Parasites were allowed to invade host cells and then cultured for 24 h before fixing the cells and counting the number of parasites per vacuole. B, the ability of WT and iHA-TgATP4 parasites (maintained for 30 h in the presence or absence of ATc) to egress from their host cells after a 3-min exposure to the Ca2+ ionophore A23187 (2 μm). C, WT/Tomato and iHA-TgATP4/Tomato parasites were grown in the absence and presence of ATc for 2 days and then allowed to invade host cells for 10 min. D, to measure extracellular parasite viability, WT and iHA-TgATP4 parasites were grown in the absence or presence of ATc for 2 days. Intracellular parasites were then mechanically egressed from host cells and incubated as extracellular parasites in (high-[Na+]) growth medium for 0–27 h. The viability of parasites was monitored at predetermined time points by labeling with propidium iodide. In A–C, the bars show the mean values (with the error bars showing S.D.) averaged from three independent experiments. The data from individual experiments are shown with circles. In D, the data shown are the mean values (± S.D.) averaged from four independent experiments (asterisks denote statistically significant differences between iHA-TgATP4 parasites incubated in the presence of ATc and all other parasites and conditions: **, p < 0.01; ***, p < 0.001; one-way ANOVA). Where not shown, error bars fall within the symbols.
Figure 4.
Figure 4.
Virulence of TgATP4-expressing and TgATP4-disrupted parasites in mice. Five BALB/c mice were infected with 103 WT (black), atp4Δ34–1338 (red), or atp4Δ34–1338/cTy1-TgATP4 (blue) parasites and monitored for progression of disease. The data are from a single experiment.
Figure 5.
Figure 5.
Na+ and pH regulation in TgATP4-expressing and TgATP4 knockdown parasites and the effect of cipargamin thereon. A and B, representative traces showing the effects of cipargamin on [Na+]cyt (A) and pHcyt (B) in iHA-TgATP4 parasites expressing TgATP4 (−ATc, black) and in parasites in which TgATP4 is knocked down (+ATc, gray). Each trace is representative of at least three similar experiments. Parasites were suspended in physiological saline, and the concentration of cipargamin added was 50 nm. Calibration traces for 20 mm and 130 mm Na+ are depicted to the left of the main traces. In B, concanamycin A was added at a concentration of 100 nm to inhibit the plasma membrane V-type H+-ATPase.
Figure 6.
Figure 6.
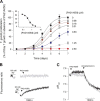
The effect of the pyrazoleamide PA21A050 on T. gondii growth, [Na+]cyt, and pHcyt. A, the effect of various concentrations of the pyrazoleamide PA21A050 on the growth of WT/Tomato parasites over the course of 7 days. The data shown are from a single experiment (with error bars showing the standard deviation of triplicate measurements) and are representative of those obtained in three independent experiments. For clarity, the data points for 5 μm and 10 μm PA21A050 are not shown (they overlapped with those for 2.5 μm PA21A050). Inset, the data for Day 5 shown in the main panel are plotted against the concentration of PA21A050 to generate a dose–response curve. Where not shown, error bars fall within the symbols. B and C, representative traces showing the effects of PA21A050 on [Na+]cyt (B) and pHcyt (C) in iHA-TgATP4 parasites expressing TgATP4 (−ATc, black) and in parasites in which TgATP4 is knocked down (+ATc, gray). Each trace is representative of at least three similar experiments. Calibration traces for 20 mm and 130 mm Na+ are depicted to the left of the main traces. Parasites were suspended in physiological saline, and PA21A050 was added at a concentration of 50 nm. Concanamycin A (C) was added at a concentration of 100 nm to inhibit the V-type H+-ATPase.
Figure 7.
Figure 7.
Ca2+ regulation in TgATP4-expressing and TgATP4 knockdown parasites and the effect of cipargamin. A, traces showing the effects of cipargamin on [Ca2+]cyt in iHA-TgATP4 parasites expressing TgATP4 (−ATc, black) and in parasites in which TgATP4 is knocked down (+ATc, gray). The traces are representative of those obtained in at least three similar experiments for each condition. The parasites were suspended in physiological saline, and the concentration of cipargamin was 50 nm. Cyclopiazonic acid (CPA) was added at a concentration of 10 μm to release the endoplasmic reticulum Ca2+ store (59) and confirm that the assay enabled the detection of changes in [Ca2+]cyt. B, the [Ca2+]cyt in iHA-TgATP4 parasites expressing TgATP4 (−ATc, black symbols) and in parasites in which TgATP4 was knocked down (+ATc, gray symbols) in the presence of varying external [Ca2+] ([Ca2+]out). The data are averaged from those obtained in four independent experiments performed on different days and are shown as the mean ± S.D. The [Ca2+]cyt values for TgATP4-expressing and TgATP4 knockdown parasites were compared at each [Ca2+]out using unpaired t tests. There was no significant difference between the [Ca2+]cyt in the two strains at any of the [Ca2+]out values tested.
Figure 8.
Figure 8.
Schematic illustrating how differences in the lifestyles of P. falciparum and T. gondii might explain their different sensitivities to ATP4 inhibitors. P. falciparum trophozoites modify erythrocytes by inducing new permeability pathways (NPP) that mediate the net influx of Na+ across the erythrocyte plasma membrane, exposing the intracellular parasite to a high external [Na+] (∼130 mm). Uncharacterized “leak pathways” (represented by a dotted line) mediate the influx of Na+ from the host cytosol into the parasite. The cipargamin- and PA21A050-sensitive ATP4 pump extrudes Na+ ions, maintaining a low [Na+] inside the parasite. The pump is proposed to import H+ as it exports Na+, with the imported H+ being extruded from the parasite by the concanamycin A–sensitive V-type H+-ATPase (V-ATP) (10). T. gondii tachyzoites reside in host cells that maintain a low-[Na+] environment ([Na+] ∼10 mm) through the action of the host plasma membrane Na+/K+-ATPase. Under these (low-intracellular-[Na+]) conditions, the parasite is not reliant on its own Na+ regulation mechanisms to maintain a low [Na+]cyt. However, upon egress from their host cells, extracellular tachyzoites are exposed to the high-[Na+] extracellular medium ([Na+] ∼130 mm) and must actively extrude Na+ via ATP4 to maintain a low [Na+]cyt.

References

    1. Blaustein M. P., Kao J. P., and Matteson D. R. (2004) Cellular Physiology, pp. 37–52 Elsevier, Philadelphia, PA
    1. Casey J. R., Grinstein S., and Orlowski J. (2010) Sensors and regulators of intracellular pH. Nat. Rev. Mol. Cell Biol. 11, 50–61 10.1038/nrm2820 - DOI - PubMed
    1. Saliba K. J., and Kirk K. (1999) pH regulation in the intracellular malaria parasite, Plasmodium falciparum: H+ extrusion via a V-type H+-ATPase. J. Biol. Chem. 274, 33213–33219 10.1074/jbc.274.47.33213 - DOI - PubMed
    1. Spillman N. J., Allen R. J., and Kirk K. (2008) Acid extrusion from the intraerythrocytic malaria parasite is not via a Na+/H+ exchanger. Mol. Biochem. Parasitol. 162, 96–99 10.1016/j.molbiopara.2008.07.001 - DOI - PubMed
    1. Allen R. J., and Kirk K. (2004) The membrane potential of the intraerythrocytic malaria parasite Plasmodium falciparum. J. Biol. Chem. 279, 11264–11272 10.1074/jbc.M311110200 - DOI - PubMed

Publication types