. 2019 Feb 5;10(1):604.
doi: 10.1038/s41467-019-08379-8.

TGFβ/BMP immune signaling affects abundance and function of C. elegans gut commensals

Affiliations

TGFβ/BMP immune signaling affects abundance and function of C. elegans gut commensals

Maureen Berg et al. Nat Commun. .

Abstract

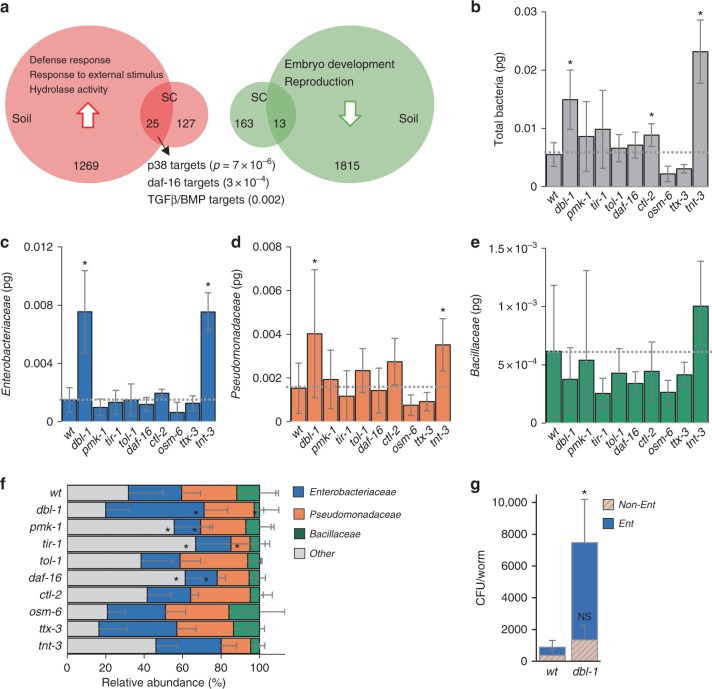
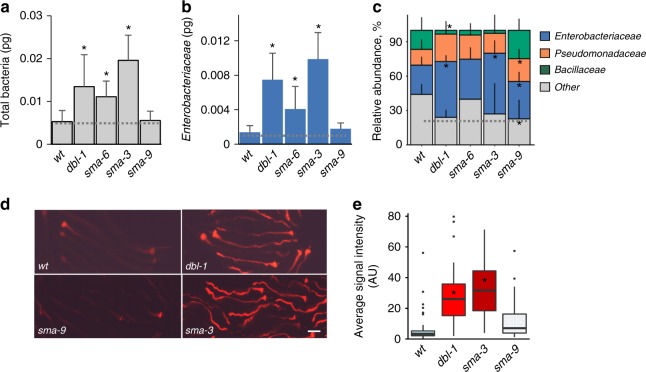
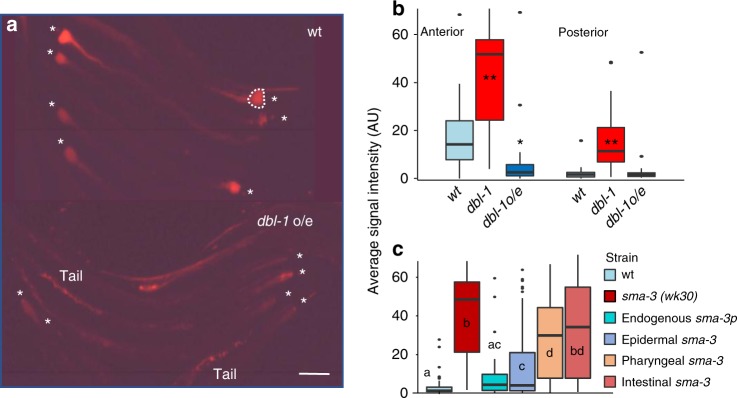
The gut microbiota contributes to host health and fitness, and imbalances in its composition are associated with pathology. However, what shapes microbiota composition is not clear, in particular the role of genetic factors. Previous work in Caenorhabditis elegans defined a characteristic worm gut microbiota significantly influenced by host genetics. The current work explores the role of central regulators of host immunity and stress resistance, employing qPCR and CFU counts to measure abundance of core microbiota taxa in mutants raised on synthetic communities of previously-isolated worm gut commensals. This revealed a bloom, specifically of Enterobacter species, in immune-compromised TGFβ/BMP mutants. Imaging of fluorescently labeled Enterobacter showed that TGFβ/BMP-exerted control operated primarily in the anterior gut and depended on multi-tissue contributions. Enterobacter commensals are common in the worm gut, contributing to infection resistance. However, disruption of TGFβ/BMP signaling turned a normally beneficial Enterobacter commensal to pathogenic. These results demonstrate specificity in gene-microbe interactions underlying gut microbial homeostasis and highlight the pathogenic potential of their disruption.


Conflict of interest statement

The authors declare no competing interests.

Figures

Fig. 1
Fig. 1
Genes affected by host–microbiota interactions and involved in shaping the gut microbiota. a Numbers of, and annotations enriched among, genes differentially expressed in worms raised on complex environmental microbiotas compared with those raised on E. coli (detailed in Supplementary Data files 1 and 2 and Supplementary Table 1). be Bacterial load in worms of the designated strains raised on the SC1 community (in pg 16S rDNA, see Methods): b All Eubacteria, c Enterobacteriaceae, d Pseudomonadaceae, e Bacillaceae. Shown are averages ± SD of 2–4 independent experiments. Measurements were performed on a pool of 30 worms per experiment. f Relative abundances of each group were calculated based on the values shown in ad; light gray bars represent relative abundance of all ‘other’ bacterial groups not directly measured. *p < 0.05 (analysis of variance (ANOVA)) compared with N2. g Colony-forming units (CFUs) representing live bacteria extracted from worm guts, cultured and counted on Enterobacteriaceae-selective media plates (Ent) or on rich media plates (LB), which following subtraction of Ent stands for non-Enterobacteriaceae bacteria. Shown are averages ± SD of counts from four plates (n = 10 worms) per group from a representative experiment of four showing similar results. *p = 0.006, t-test
Fig. 2
Fig. 2
Enterobacteriaceae expansion in dbl-1 mutants is reproduced in different environments. Total bacterial load (a), and abundance of Enterobacteriaceae (b) in the gut of wild-type (N2) or dbl-1 worms raised on synthetic communities SC1 or SC2. Shown are averages ± SD of two independent experiments (n = 30 worms per group per experiment). cf Total bacterial load (c), and abundance of Enterobacteriaceae (d) and Pseudomonadaceae (e), in worms raised in soil microcosms; f calculated relative abundance, as in Fig. 1. Averages ± SD of four independent populations per genotype (n = 100 worms per group). *p < 0.05 compared with wild-type animals, t-test
Fig. 3
Fig. 3
dbl-1 disruption specifically affects Enterobacter species. a Microbiota size in worms of the designated strains raised on different versions of the SC1 synthetic community—without Pseudomonas and most of the Enterobacteriaceae isolates (SC1R), without most Enterobacteriaceae (SC1R*), or without Enterobacter isolates (SC1R**). Average ± SD of two independent populations (n = 30/experiment); *p < 0.05 compared with wild-type, t-test. b Measurements of the Enterbacter load (assessed with calibrated qPCR using Enterobacter-specific primers) in wild-type animals (N2) and dbl-1 mutants raised on SC1. Average ± SD of two independent populations (n = 30 worms per population). *p < 0.05 compared with N2, t-test. c Representative images and quantification of worm colonization by tdTomato-expressing Enterobacter cloacae CEent1. H high, M moderate, L light, N none. Averages ± SD of two independent experiments (n = 62–180 worms per experiment). *p < 0.05, Tukey’s HSD test. Size bar, 0.3 mm
Fig. 4
Fig. 4
Disruption of TGFβ/BMP signaling alters gut microbiota size and composition independent of effects on body size. a, b Bacterial load in wild-type worms and TGFβ mutants—dbl-1(nk3), sma-6(wk7), sma-3(e491), and sma-9(wk55), raised on the SC1 community, showing abundance of all Eubacteria (a), or Enterobacteriaceae (b). Average ± SD of two independent experiments. Measurements were performed on a pool of n = 30 worms per experiment. c Relative abundance of all measured taxa (including also Pseudomonadaceae and Bacillaceae), calculated based on the absolute quantities, as in Fig. 1; light gray bar represents relative abundance of all ‘other’ bacterial groups not directly measured. *p < 0.05 (analysis of variance (ANOVA)) compared with wild-type animals. d, e Representative images (d) and quantification (e) of colonization of TGFβ/BMP mutants by tdTomato-expressing CEent1. Box plots present medians (center line), first and third quartiles (bottom and top of box, respectively), minimum and maximum values (whiskers), and outliers (dots, defined as >1.5 times above/below the interquartile range). *p < 10E–13 (generalized linear model) compared with wild-type animals; N(wt) = 47, N(dbl-1) = 42, N(sma-3) = 66, N(sma-9) = 89. Size bar, 0.1 mm
Fig. 5
Fig. 5
TGFβ/BMP signaling controls Enterobacter colonization in the anterior intestine through multi-tissue contributions. a Representative images of wild-type and dbl-1 overexpressing (o/e) worms raised to adulthood on tdTomato-expressing CEent1. Asterisks mark the posterior pharynx, size bar, 0.1 mm. b Box plots (described under Fig. 4) quantifying fluorescent signal (normalized to area) in images as in a, either in the anterior gut (dashed line in a), or posterior to that. n = 38 (wt), 50 (dbl-1), 28 (dbl-1 o/e); **p < 0.0001, *p < 0.05, generalized linear model. c Similar quantification in the anterior gut of wild-type worms, or sma-3 mutants, as well as in sma-3 derivatives with transgenic tissue-specific sma-3 expression. Statistically distinct groups (p < 0.05) are marked with different letters (analysis of variance (ANOVA) followed by a Tukey’s post hoc test; n = 71(wt), 60 (sma-3 mutants), 48 (endogenous sma-3 promoter), 86 (epidermal sma-3), 40 (pharyngeal sma-3), 33 (intestinal sma-3), all hermaphrodites)
Fig. 6
Fig. 6
Normally beneficial Enterobacter commensal is detrimental in dbl-1 mutants. ae Fraction survival of worms of the designated strains on the pathogen E. faecalis, following growth (until larval stage L4) on control E. coli (EC) or CEent1. Shown are averages ± SDs for representative experiments performed in duplicate or triplicate. P-values were obtained using log-rank test. f An overlay of visible light and fluorescent images demonstrating colonization of sma-3 mutants with tdTomato-expressing CEent1 24 h after shift from CEent1 to E. faecalis (a representative image from one experiment of two showing similar results); size bar, 0.2 mm

References

    1. McKenney PT, Pamer EG. From hype to hope: the gut microbiota in enteric infectious disease. Cell. 2015;163:1326–1332. doi: 10.1016/j.cell.2015.11.032. - DOI - PMC - PubMed
    1. Nicholson JK, et al. Host-gut microbiota metabolic interactions. Sci. (80-.) 2012;336:1262–1267. doi: 10.1126/science.1223813. - DOI - PubMed
    1. Sampson TR, Mazmanian SK. Control of brain development, function, and behavior by the microbiome. Cell. Host. Microbe. 2015;17:565–576. doi: 10.1016/j.chom.2015.04.011. - DOI - PMC - PubMed
    1. Sison-Mangus MP, Mushegian AA, Ebert D. Water fleas require microbiota for survival, growth and reproduction. ISME. J. 2015;9:59–67. doi: 10.1038/ismej.2014.116. - DOI - PMC - PubMed
    1. Sommer F, Backhed F. The gut microbiota--masters of host development and physiology. Nat. Rev. Microbiol. 2013;11:227–238. doi: 10.1038/nrmicro2974. - DOI - PubMed

Publication types

MeSH terms

Substances