. 2019 Feb 5;10(1):595.
doi: 10.1038/s41467-019-08526-1.

Identification and characterization of a direct activator of a gene transfer agent

Affiliations

Identification and characterization of a direct activator of a gene transfer agent

Paul C M Fogg. Nat Commun. .

Abstract

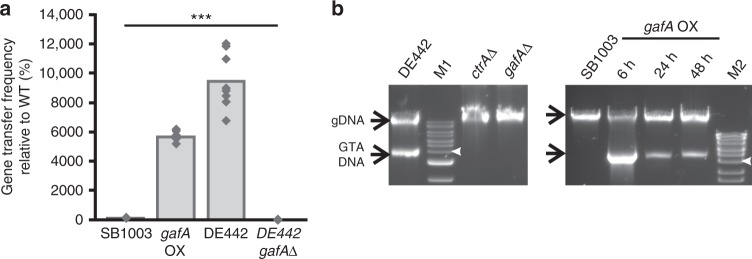
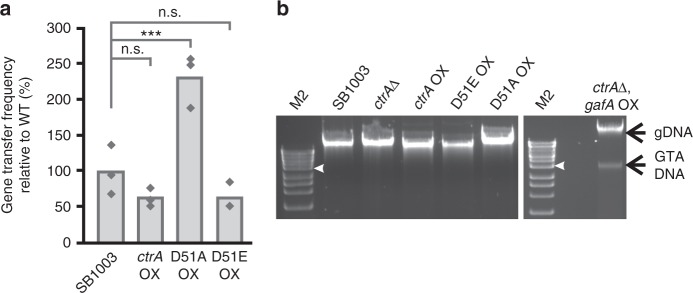
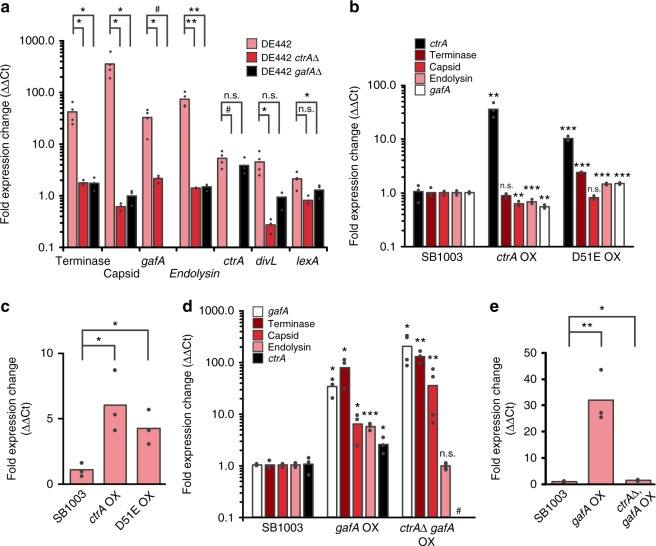
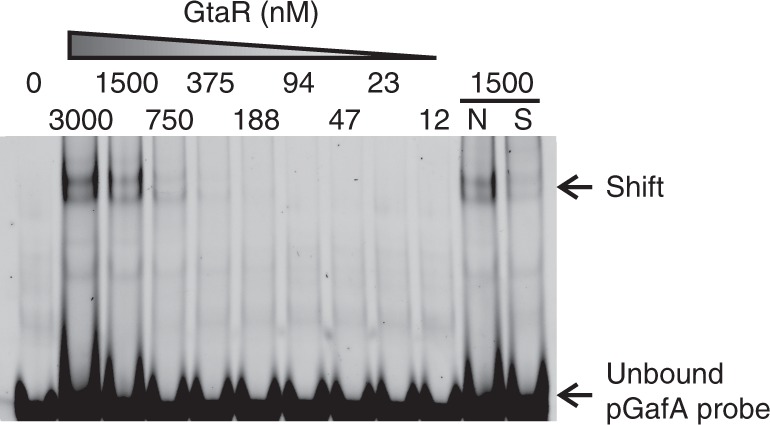
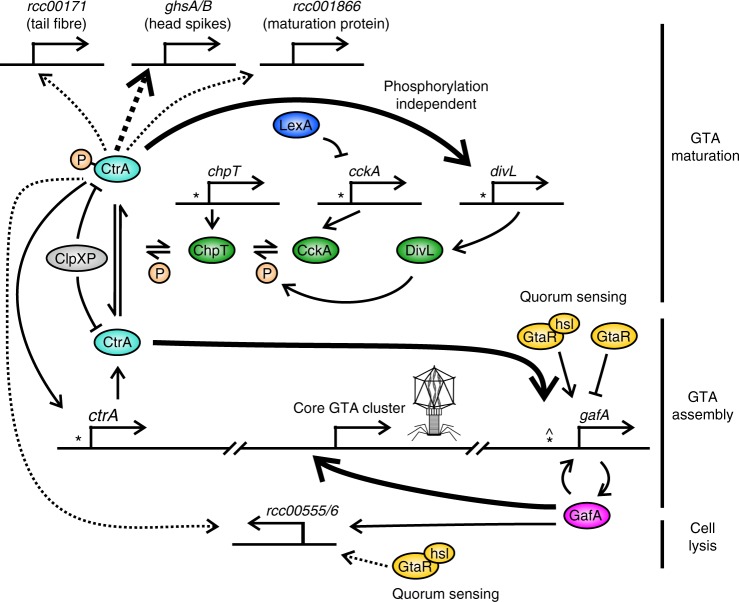
Gene transfer agents (GTAs) are thought to be ancient bacteriophages that have been co-opted into serving their host and can now transfer any gene between bacteria. Production of GTAs is controlled by several global regulators through unclear mechanisms. In Rhodobacter capsulatus, gene rcc01865 encodes a putative regulatory protein that is essential for GTA production. Here, I show that rcc01865 (hereafter gafA) encodes a transcriptional regulator that binds to the GTA promoter to initiate production of structural and DNA packaging components. Expression of gafA is in turn controlled by the pleiotropic regulator protein CtrA and the quorum-sensing regulator GtaR. GafA and CtrA work together to promote GTA maturation and eventual release through cell lysis. Identification of GafA as a direct GTA regulator allows the first integrated regulatory model to be proposed and paves the way for discovery of GTAs in other species that possess gafA homologues.


Conflict of interest statement

The author declares no competing interests.

Figures

Fig. 1
Fig. 1
Confirmation of the RcGTA Activator, GafA. a GTA gene transfer assays for R. capsulatus SB1003 (WT), SB1003 gafA overxpressor (gafA OX), RcGTA hyperproducer strain R. capsulatus DE442 (DE442) and DE442 with gafA deleted (DE442 gafAΔ). Individual replicates are shown as diamonds. All conditions were significantly different; One Way ANOVA significance is indicated above the bars (n = 8, *** = p < 0.001). b Agarose gels of total DNA isolated from the annotated R. capsulatus strains - RcGTA hyperproducer strain R. capsulatus DE442, ctrA (ctrAΔ) and gafA (gafAΔ) knockouts in DE442, wild-type R. capsulatus SB1003 compared to gafA overexpressor (OX) derivatives of SB1003. Time post induction of gafA is noted in hours, GTA and genomic DNA (gDNA) are indicated by labelled arrows. NEB 1 kb Extend DNA Ladder (M1) or Bioline HyperLadder 1 kb DNA ladder were used (M2); the 4 kb band is annotated with a white arrow head. Source data are provided as a Source Data file
Fig. 2
Fig. 2
The role of CtrA in RcGTA production. a GTA gene transfer assays for R. capsulatus SB1003, ctrA overexpressor (ctrA OX), non-phosphorylatable ctrA overexpressor (D51A) and phosphomimetic ctrA overexpressor (D51E OX). Individual replicates are shown as diamonds (n = 3), One Way ANOVA significance versus the control (SB1003) is indicated above the chart (n.s. not significant i.e. p > 0.05, ***p < 0.001). b, Agarose gels of total DNA isolated from R. capsulatus SB1003 and the annotated derivatives – wild-type R. capsulatus SB1003, ctrA knockout (ctrAΔ), ctrA overexpressor (ctrA OX), phosphomimetic ctrA overexpressor (D51E OX), non-phosphorylatable ctrA overexpressor (D51A OX) and a gafA overexpressor in a ctrA knockout background (ctrAΔ, gafA OX). GTA and genomic DNA (gDNA) are indicated by labelled arrows. Bioline HyperLadder 1 kb DNA ladder was used (M2); the 4 kb band is annotated with a white arrow head. Source data are provided as a Source Data file
Fig. 3
Fig. 3
Relative Transcription of RcGTA-Related Genes. The R. capsulatus strains and gene targets assessed are annotated on each graph. OX indicates a gene overexpressor and Δ is a gene knockout. All Y-axis fold expression changes are normalized using uvrD as an endogenous reference gene (ΔCt) and relative to the wild-type SB1003 strain (ΔΔCt). Dot plots of individual replicates are overlaid onto each bar (biological replicates, n ≥ 3 for all samples). Statistical significance was determined using a two-tail t-test (*p < 0.05, **p < 0.01, ***p < 0.001, #transcript not detected in knockout lines, n.s. not significant i.e., p > 0.05). Total transcripts were measured in (a, b, d) and transcripts originating from the native promoter only in (c, e). Source data are provided as a Source Data file
Fig. 4
Fig. 4
CtrA binding to the gafA promoter. a Alignment of the DNA probe sequences containing CtrA-binding sites that were used for EMSAs (double headed arrow). CtrA binding sites are annotated with half sites represented by solid lines and the spacer sequence as a dashed line. The predicted Shine Delgarno −10 site is annotated. mRNA transcript coverage for the gafA promoter, obtained from RNAseq data, is shown as a histogram above the alignment. b EMSA band shift of Cy5-labelled gafA promoter DNA incubated with the protein concentrations specified. The lane labelled N contained 500-fold excess of an unlabelled non-specific competitor and S contained 500-fold excess of an unlabelled specific competitor. c Quantification of two independent band shifts of CtrA vs. the gafA promoter. Error bars are standard deviation, n = 2. Source data are provided as a Source Data file
Fig. 5
Fig. 5
Binding of the GtaR quorum-sensing protein to the gafA promoter. EMSA band shift of Cy5-labelled gafA promoter DNA (see Fig. 4a) incubated with the protein concentrations specified. The lane labelled N contained 500-fold excess of an unlabelled non-specific competitor and S contained 500-fold excess of an unlabelled specific competitor. Source data are provided as a Source Data file
Fig. 6
Fig. 6
GafA binding to the RcGTA cluster promoter. a Map of the RcGTA structural gene cluster promoter indicating the predicted locations of the Shine Delgarno −10 and −35 sites, the ribosome-binding site (RBS), RcGTA g1 start codon and transcription start site (TSS). mRNA transcript coverage, obtained from RNAseq data, is shown as a histogram. b Map of the overlapping 50 bp regions of the RcGTA promoter used as EMSA probes (pGTA1-5). c EMSA band shifts of Cy5-labelled pGTA1-5 vs. 2 µM GafA protein. d EMSA band shift of titrated GafA protein at the concentrations indicated versus Cy5-pGTA2. The lane labelled N contained 500-fold excess of an unlabelled non-specific competitor and S contained 500-fold excess of an unlabelled specific competitor. e Unshifted Cy5 labelled, 633 bp RcGTA promoter DNA after incubation with up to 4 µM of either CtrA or GafA. Source data are provided as a Source Data file
Fig. 7
Fig. 7
Model of RcGTA regulation. The interactions depicted are inferred from the data in this study, raw microarray data and published results,,,. Bent, perpendicular arrows represent promoters and are annotated with the proceeding gene name. CtrA (*) or GtaR (^) binding sites are labelled where known. Proteins are depicted as coloured ellipses with phosphate groups (P) in orange circles. Solid arrows indicate direct regulation, dashed arrows indicate indirect or unknown route of regulation and emboldened arrows indicate that the regulator is essential for target expression

References

    1. Soucy SM, Huang J, Gogarten JP. Horizontal gene transfer: building the web of life. Nat. Rev. Genet. 2015;16:472–482. doi: 10.1038/nrg3962. - DOI - PubMed
    1. Koonin EV, Wolf YI. Genomics of bacteria and archaea: the emerging dynamic view of the prokaryotic world. Nucleic Acids Res. 2008;36:6688–6719. doi: 10.1093/nar/gkn668. - DOI - PMC - PubMed
    1. Chen J, et al. Genome hypermobility by lateral transduction. Science. 2018;362:207–212. doi: 10.1126/science.aat5867. - DOI - PubMed
    1. Lang AS, Zhaxybayeva O, Beatty JT. Gene transfer agents: phage-like elements of genetic exchange. Nat. Rev. Microbiol. 2012;10:472–482. doi: 10.1038/nrmicro2802. - DOI - PMC - PubMed
    1. Solioz M, Marrs B. The gene transfer agent of Rhodopseudomonas capsulata. Purification and characterization of its nucleic acid. Arch. Biochem. Biophys. 1977;181:300–307. doi: 10.1016/0003-9861(77)90508-2. - DOI - PubMed

Publication types

MeSH terms