. 2019 Jan 22;4(1):57-66.
doi: 10.1016/j.synbio.2019.01.002. eCollection 2019 Mar.

Miniaturisation of high-throughput plasmid DNA library preparation for next-generation sequencing using multifactorial optimisation

Affiliations

Miniaturisation of high-throughput plasmid DNA library preparation for next-generation sequencing using multifactorial optimisation

Lorna Suckling et al. Synth Syst Biotechnol. .

Erratum in

  • Erratum regarding previously published articles.
    [No authors listed] [No authors listed] Synth Syst Biotechnol. 2020 Oct 12;5(4):328. doi: 10.1016/j.synbio.2020.10.003. eCollection 2020 Dec. Synth Syst Biotechnol. 2020. PMID: 33102826 Free PMC article.

Abstract

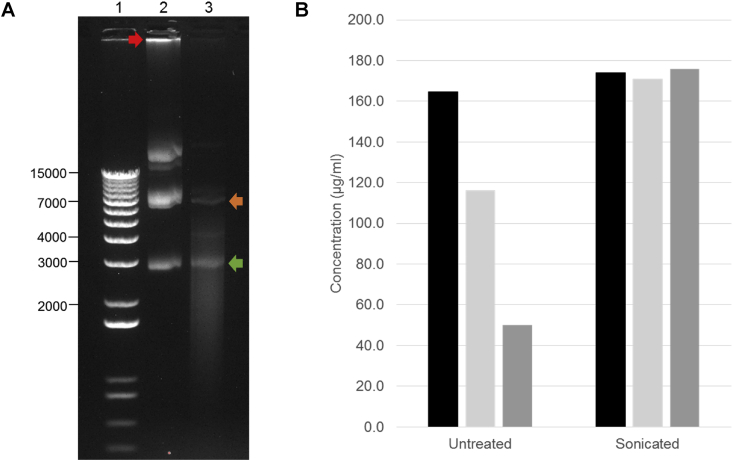
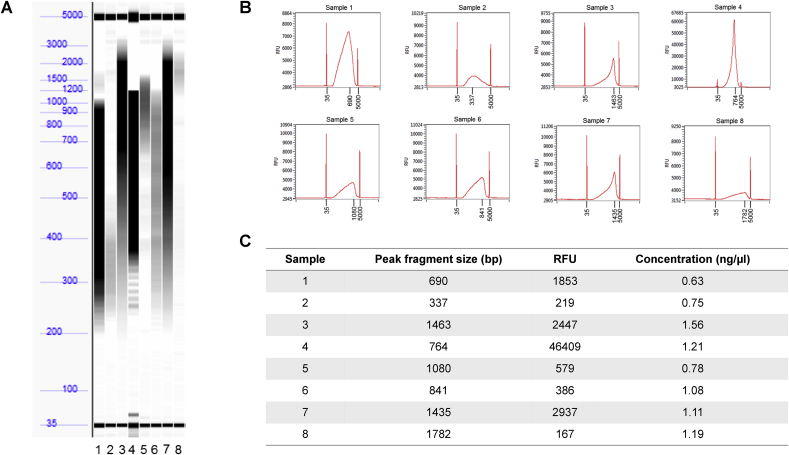
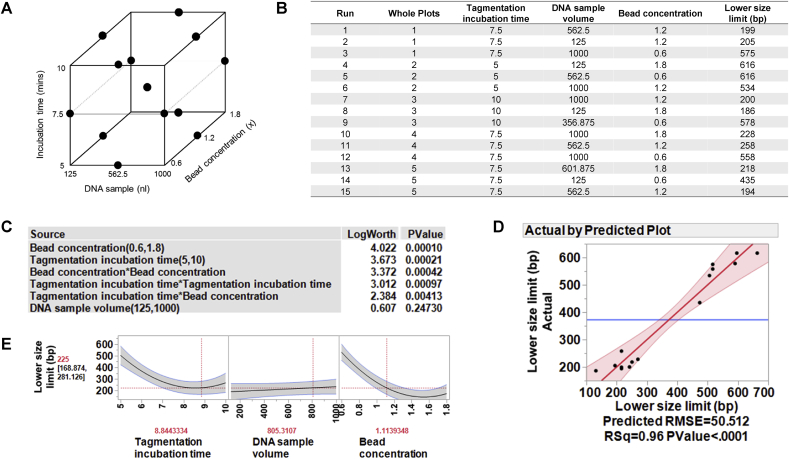
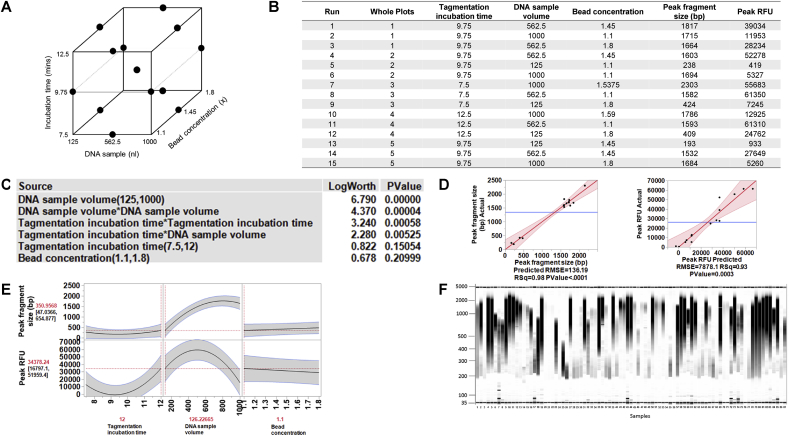
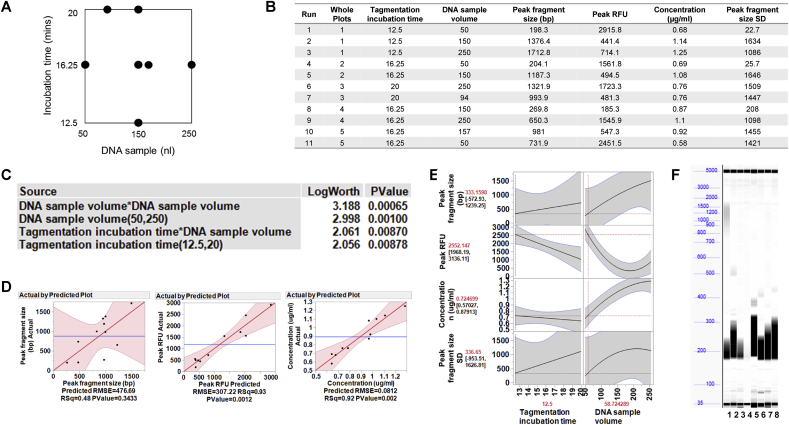
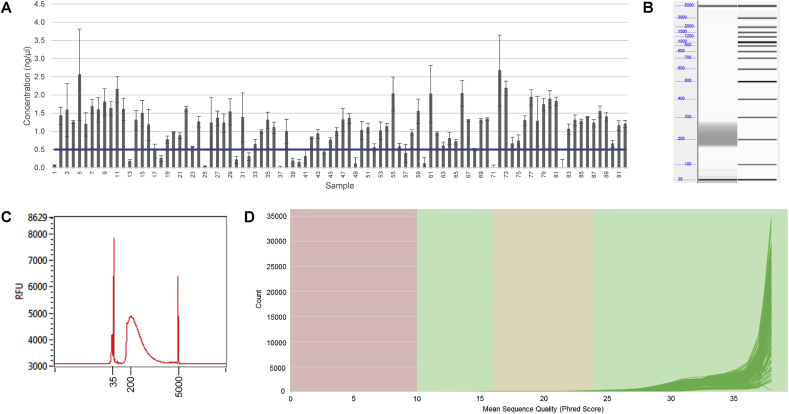
High-throughput preparation of plasmid DNA libraries for next-generation sequencing (NGS) is an important capability for molecular biology laboratories. In particular, it is an essential quality control (QC) check when large numbers of plasmid variants are being generated. Here, we describe the use of the Design of Experiments (DOE) methodology to optimise the miniaturised preparation of plasmid DNA libraries for NGS, using the Illumina® Nextera XT technology and the Labcyte Echo® acoustic liquid dispensing system. Furthermore, we describe methods which can be implemented as a QC check for identifying the presence of genomic DNA (gDNA) in plasmid DNA samples and the subsequent shearing of the gDNA, which otherwise prevents the acoustic transfer of plasmid DNA. This workflow enables the preparation of plasmid DNA libraries which yield high-quality sequencing data.


Figures

Fig. 1
Fig. 1
Long linear DNA fails to transfer by acoustic dispensing. PicoGreen® dsDNA dye was used to measure the fluorescent signal from long, linear lamda DNA (A) or supercoiled plasmid DNA (B) at a range of concentrations after 1 μl sample was transferred either by manual pipetting or acoustically using the Echo®, in triplicate. At concentrations above 5 μg/ml, lamda DNA does not transfer well on the Echo®. However, supercoiled plasmid DNA transfers efficiently at all tested concentrations. The concentration of 7 plasmid DNA samples was measured using the PicoGreen® reagent. The plasmid DNA samples were either transferred by manual pipetting (C) or using acoustic dispensing on the Labcyte Echo® 550 (D). All samples were tested in 3 replicates, as represented by different coloured bars. The data show that 3 samples failed to transfer by acoustic dispensing (samples 1–3) while one transfers with variable amounts (sample 5). (E) The plasmid DNA samples were run in 1% w/v agarose gel (in 1× TAE) at 80 V for 1 h; M = 1 Kb Plus DNA Ladder (ThermoFisher Scientific). Due to the large size of gDNA, it remains above the range of the ladder, as indicated by the red arrow. The gel shows the presence of gDNA in samples 1–3, which are those that did not transfer acoustically. (F) The concentrations of plasmid DNA samples in (C) and (D) were interpolated from a standard curve, generated using a plasmid DNA sample of a known concentration.
Fig. 2
Fig. 2
Sonication of DNA samples fragments gDNA while maintaining the plasmid DNA intact. (A) Samples were run in 1% w/v agarose gel (in 1× TAE) at 60 V for 90 min; Lane 1: 1 Kb Plus DNA Ladder (ThermoFisher Scientific); Lane 2: DNA plasmid part, 50 ng/μl/kbp; Lane 3: DNA plasmid part, 50 ng/μl/kbp, after sonication (3 min, 2 s pulse, 10% amplitude). The red arrow indicates gDNA visible in the untreated sample (lane 2). The green arrow indicates the supercoiled plasmid DNA, seen in both the untreated (lane 2) and the sonicated (lane 3) samples. The orange arrow indicates the open circular form of the plasmid DNA. (B) The untreated and sonicated plasmid DNA samples were tested in triplicate in the miniaturised gDNA QC assay and the concentration of dsDNA was calculated, according to the standard curve. In the untreated sample, variable concentrations were measured in each of the three replicates, likely due to contamination of the plasmid DNA sample by gDNA. In the sonicated sample, all replicates gave a similar quantification, indicating successful acoustic dispense and shearing of gDNA.
Fig. 3
Fig. 3
Preparation of plasmid DNA libraries for NGS using miniaturised gDNA method. (A) Eight plasmid DNA samples were prepared according to Labcyte's miniaturised NGS gDNA library preparation method [2], using the Nextera XT kit. After purification, the samples were run on the Fragment Analyzer to determine the size of the fragments. (B) Plots of the Fragment Analyzer data show the peak fragment size for 7/8 of the samples is greater than 400 bp, which is the maximum limit required for sequencing. (C) Summary of the data shows variable relative fluorescence units (RFU) for the 8 samples. The concentration of each purified sample, as measured using the PicoGreen dsDNA assay, is within the range required (0.5–5 ng/μl).
Fig. 4
Fig. 4
Design of experiments (DOE) model number 1 for NGS plasmid DNA library preparation: Optimisation of the lower size limit of fragments. (A) Three factors were evaluated using a custom designed model generated with JMP® software: tagmentation incubation time, plasmid DNA sample volume, and the concentration of magnetic beads used in the automated DNA purification method. The evaluated range for each variable is shown. (B) There was a total of 15 runs in random order from 5 whole plots. Each whole plot represents the same condition for the tagmentation incubation time and was performed in a separate plate. The response variable to be optimised was the lower size limit (the lowest size of DNA fragment detected after magnetic bead purification). A plasmid DNA sample was prepared with the Nextera XT library preparation kit using the miniaturised method, according to each set of conditions defined in the DOE model. After magnetic bead purification, samples were run neat on the Fragment Analyzer. (C) The data were modelled according to the DOE design, using JMP® software. Both bead concentration and tagmentation incubation time has a significant effect on the lower size limit of the fragmented DNA (Log Worth >2). (D) The data predicted by the DOE model correlated with the actual data with an R2 value of 0.96, indicating a very good correlation. (E) Visualisation of the optimal lower size limit model using the prediction profiler tool in the JMP® software, shows that the desired lower size limit of less than 300 bp is achieved with a tagmentation incubation time of >7.5 min and a magnetic bead concentration of between 1.1–1.8x sample volume.
Fig. 5
Fig. 5
Design of experiments (DOE) model number 2 for NGS plasmid DNA library preparation: Optimisation of fragment size and concentration. (A) Three factors were evaluated using a custom designed model generated with JMP® software: tagmentation incubation time, plasmid DNA sample volume, and the concentration of magnetic beads used in the automated DNA purification method. The evaluated range for each variable is shown. (B) There was a total of 15 runs in random order from 5 whole plots. Each whole plot represents the same condition for the tagmentation incubation time and was performed in a separate plate. There were two response variables to be optimised: the peak fragment size (representing the size of most DNA fragments); and the peak relative fluorescence unit (RFU), indicative of concentration. A plasmid DNA sample was prepared with the Nextera XT library preparation kit using the miniaturised method, according to each of the conditions defined in the DOE model. After magnetic bead purification, samples were run neat on the Fragment Analyzer. (C) The data were modelled according to the DOE design using JMP® software. The effect summary shows that the tagmentation incubation time and DNA sample volume had a significant effect individually on the output variables. There was also a significant interaction between these two input variables. (D) The peak fragment size predicted by the DOE model correlated with the actual data with an R2 value of 0.98, while the predicted peak RFU data correlated with the actual data with an R2 value of 0.93, both indicative of a very good correlation. (E) The prediction profiler tool in the JMP® software was used to visualise the data. When the desirability was maximised (peak fragment size of 200–400 bp and maximum RFU), the optimised conditions suggested by the model are a DNA sample volume of 126 nl and a tagmentation incubation time of 12 min. (F) When the optimised conditions were tested on a multiwell plate of 96 samples, some samples had the desired peak fragment size (200–400 bp), however, many had larger fragment sizes than desired. Therefore, although the conditions optimised here are applicable to some plasmid DNA samples, further optimisation was required to establish the correct conditions for all plasmid DNA preparations.
Fig. 6
Fig. 6
Design of experiments (DOE) model number 3 for NGS plasmid DNA library preparation: Optimising the reproducibility between different plasmid DNA preparations. (A) Two factors were evaluated using a custom designed model generated with JMP® software: tagmentation incubation time and plasmid DNA sample volume. The evaluated range for each variable is shown. (B) There was a total of 11 runs in random order from 5 whole plots. Each whole plot represents the same condition for the tagmentation incubation time and was performed in a separate plate. There were three response variables: the peak fragment size (representing the size at which most DNA fragments are); the peak relative fluorescence unit (RFU); and the concentration of the sample, after magnetic bead purification. 8 plasmid DNA samples were prepared with the Nextera XT library preparation kit using the miniaturised method, according to each of the conditions defined in the DOE model. After magnetic bead purification, samples were run neat on the Fragment Analyzer. The concentration of the purified samples was also determined using the PicoGreen® dsDNA quantification assay. (C) The data were modelled according to the DOE design using JMP® software. The effect summary shows that tagmentation incubation time and DNA sample volume each had a significant effect individually. There was also a significant interaction between the two variables. (D) The data predicted by the DOE model correlated with the actual data with an R2 value of 0.48, 0.93 and 0.92 for the peak fragment size, peak RFU and concentration respectively. (E) The prediction profiler tool in the JMP® software was used to visualise the data. When the desirability was maximised (peak fragment size of 200–400 bp, maximum RFU, a concentration of 0.5–5 ng/μl and minimised peak fragment size standard deviation), the optimised conditions suggested by the model are a DNA sample volume of 58.7 nl and a tagmentation incubation time of 12.5 min. (F) The Fragment Analyzer outputs for 8 samples, run with a 12.5 min tagmentation incubation time and 50 nl DNA, show that 7/8 of the samples have a peak fragment size of between 200 and 300 bp and an average concentration of 0.68 ng/μl (±0.33 SD). The undetected sample (sample 4) had a concentration below the limit of detection of the Fragment Analyzer (<0.5 ng/μl). These optimised conditions give reproducible results across multiple plasmid DNA samples.
Fig. 7
Fig. 7
Next generation sequencing of plasmid DNA libraries, prepared using a miniaturised method with the Nextera XT library preparation kit. 96 plasmid DNA libraries were prepared for NGS with the Nextera XT library preparation kit, using optimised conditions (12.5 min incubation, 50 nl sample, 1.8x magnetic bead solution). (A) After purification, the samples were quantified in the PicoGreen® dsDNA quantification assay. The data show that 75/92 samples have a concentration within the desired range (0.5–5 ng/μl), with an average concentration of 1.1 ng/μl. These samples were pooled, with a final concentration of 6.64 nM and run on the Fragment Analyzer (B) and (C). All fragments in the pooled libraries are of the desired size (200–400 bp). (D) The pooled library was sequenced on the Illumina® MiSeq system (2 × 150 method). The mean sequence quality (Phred) scores are plotted for each sample. For all samples, the sequence quality (Phred) score was >30 for more than 85% of the base pairs, indicating that all samples passed the QC criteria.
Fig. 8
Fig. 8
High-throughput workflow for the preparation of plasmid DNA libraries for NGS. Plasmid DNA samples are isolated from bacteria cells using a high-throughput plasmid isolation method on the CyBio® FeliX robot. All steps performed using the FeliX platform are highlighted with a grey outline. The isolated plasmid samples are tested for the presence of genomic DNA (gDNA), prior to library preparation, using the Labcyte Echo®. All steps performed using the Labcyte Echo® are highlighted with a shaded grey box. If samples are free from gDNA, they are diluted to 0.4 ng/μl in H2O. If gDNA is detected, the samples are sonicated prior to re-testing in the gDNA QC assay. Using reagents from the Nextera XT kit, a tagmentation reaction is performed on all samples under the optimised conditions, followed by neutralization of the reaction. Unique combinations of index primers are added to all samples via 12 PCR cycles, followed by magnetic bead purification of the PCR products. The concentration of the purified dsDNA is then determined using the PicoGreen® reagent assay and the libraries are pooled to give a final concentration of 4–10 nM, in a minimum volume of 15 μl. The average fragment size of the pooled libraries is measured using the Fragment Analyzer before being sequenced on the Illumina® MiSeq system.
None

References

    1. van Dijk E.L., Auger H., Jaszczyszyn Y., Thermes C. Ten years of next-generation sequencing technology. Trends Genet. 2014;30:418–426. - PubMed
    1. Technical note: effective miniaturization of Illumina Nextera XT library prep for multiplexed whole genome sequencing and microbiome applications [internet] Labcyte Inc; San Jose, CA: 2017. http://learn.labcyte.com/rs/450-DEG-211/images/APP-G121-Miniaturization-... Available:
    1. Shapland E.B., Holmes V., Reeves C.D., Sorokin E., Durot M., Platt D. Low-cost, high-throughput sequencing of DNA assemblies using a highly multiplexed Nextera process. ACS Synth Biol. 2015;4:860–866. - PubMed
    1. Tan S.J., Phan H., Gerry B.M., Kuhn A., Hong L.Z., Ong Y.M. A microfluidic device for preparing next generation DNA sequencing libraries and for automating other laboratory protocols that require one or more column chromatography steps. PLoS One. 2013;8 - PMC - PubMed
    1. Agrawal S., Cifelli S., Johnstone R., Pechter D., Barbey D.A., Lin K. Utilizing low-volume Aqueous acoustic transfer with the Echo 525 to enable miniaturization of qRT-PCR assay. J Lab Autom. 2016;21:57–63. - PubMed