

The effect of respiratory motion on electronic portal imaging device dosimetry
- PMID: 30724011
- PMCID: PMC6414145
- DOI: 10.1002/acm2.12541
The effect of respiratory motion on electronic portal imaging device dosimetry
Abstract
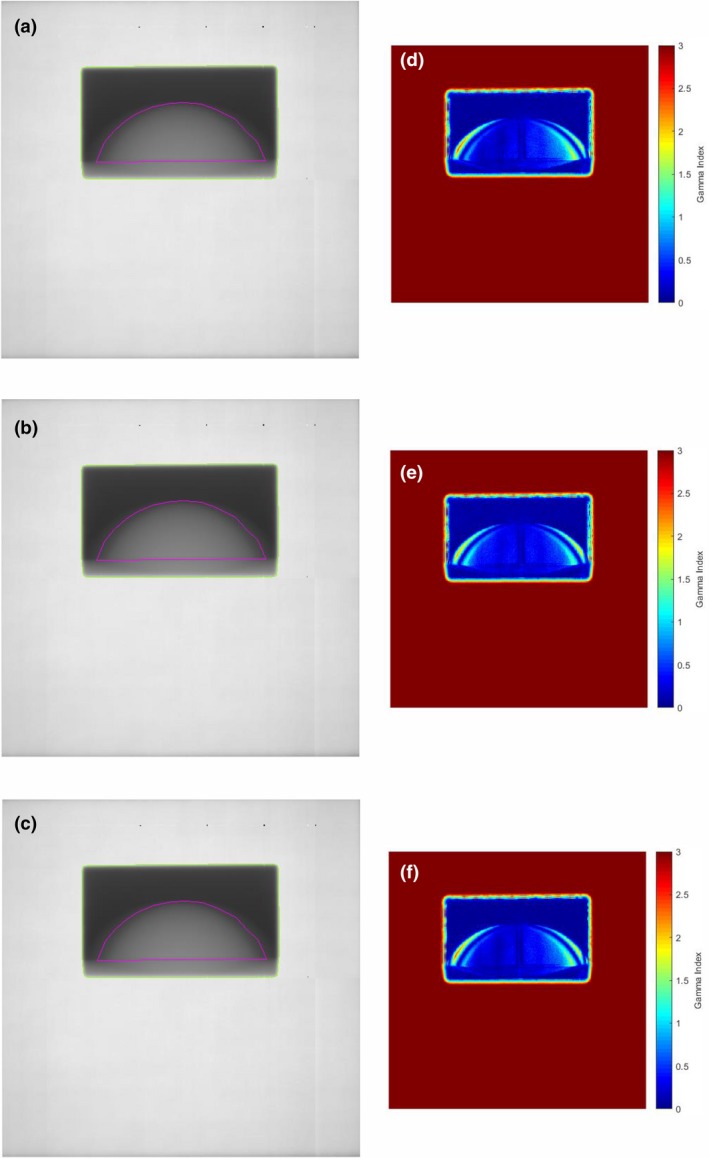
There is an increasing need to develop methods for in vivo verification of the delivery of radiotherapy treatments. Electronic portal imaging devices (EPID's) have been demonstrated to be of use for this application. The basic principle is relatively straightforward, the EPID is used to measure a two-dimensional (2D) planar exit or portal dose map behind the patient during the treatment delivery that can provide information on any errors in linear accelerator output or changes in the patient anatomy. In this paper we focused on the effect of intra-fraction motion, particularly respiratory motion, on the measured 2D EPID dose-response. Measurements were made with a breast phantom undergoing one-dimensional (1D) sinusoidal motion with a range of amplitudes (0.5, 1.0, and 1.5 cm) and frequencies (12, 15, and 20 cycles/min). Further measurements were made with the phantom undergoing breathing sequences measured during patient planning computed tomography simulation. We made use of the quadratic calibration method that converts the EPID images to a surrogate for dose, equivalent thickness of Plastic Water® . Comparisons were made of the 2D thickness maps derived for the different motions compared to the static phantom case and the resulting dose difference analyzed over the "breast" region of interest. A 2D gamma analysis within the same region of interest was performed of the motion images compared to static reference image. Comparisons were made of 1D thickness profiles for the moving and static phantom. The 1D and 2D analyses show the method to be sensitive to the smallest motion amplitude of 0.5 cm tested in the phantom measurements. The results using the phantom demonstrate the method to be a potentially useful tool for monitoring intra-fraction motion during the delivery of patient radiotherapy treatments as well as more generally providing information on the effects of motion on EPID based in vivo dosimetric verification.
Keywords: EPIDs; dosimetry; motion; radiotherapy.
© 2019 The Authors. Journal of Applied Clinical Medical Physics published by Wiley Periodicals, Inc. on behalf of American Association of Physicists in Medicine.
Conflict of interest statement
The authors declare no conflict of interest.
Figures


References
-
- The Royal College of Radiologists, Society and College of Radiographers, Institute of Physics and Engineering in Medicine, National Patient Safety Agency, British Institute of Radiology . Towards Safer Radiotherapy. London: The Royal College of Radiologists; 2008.
-
- Kairn T, Cassidy D, Sandford PM, Fielding AL. Radiotherapy treatment verification using radiological thickness measured with an amorphous silicon electronic portal imaging device: Monte Carlo simulation and experiment. Phys Med Biol. 2008;53:3903–3919. - PubMed
-
- van Elmpt W, McDermott L, Nijsten S, Wendling M, Lambin P, Mijnheer B. A literature review of electronic portal imaging for radiotherapy dosimetry. Radiother Oncol. 2008;88:289–309. - PubMed
-
- Woodruff HC, Fuangrod T, Van Uytven E, et al. First experience with real‐time EPID‐based delivery verification during IMRT and VMAT sessions. Int J Radiat Oncol Biol Phys. 2015;93:516–522. - PubMed
MeSH terms
Grants and funding
LinkOut - more resources
Full Text Sources
