Review
. 2019 Feb 6;10(1):11.
doi: 10.1186/s13244-019-0697-7.

Dural masses: meningiomas and their mimics

Affiliations
Review

Dural masses: meningiomas and their mimics

Daniel Lyndon et al. Insights Imaging. .

Abstract

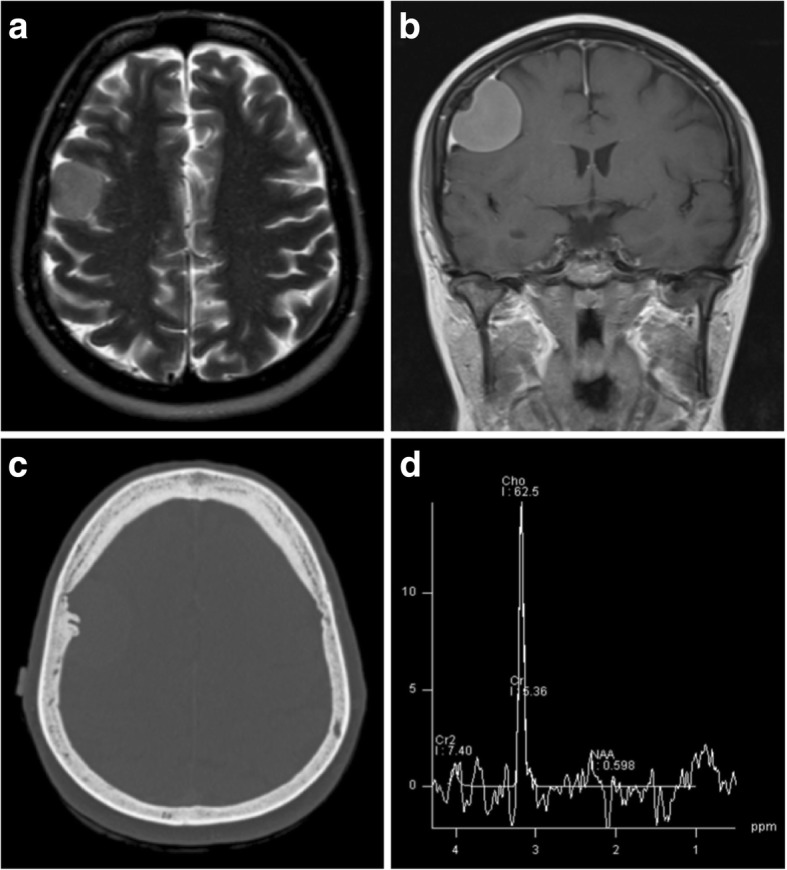
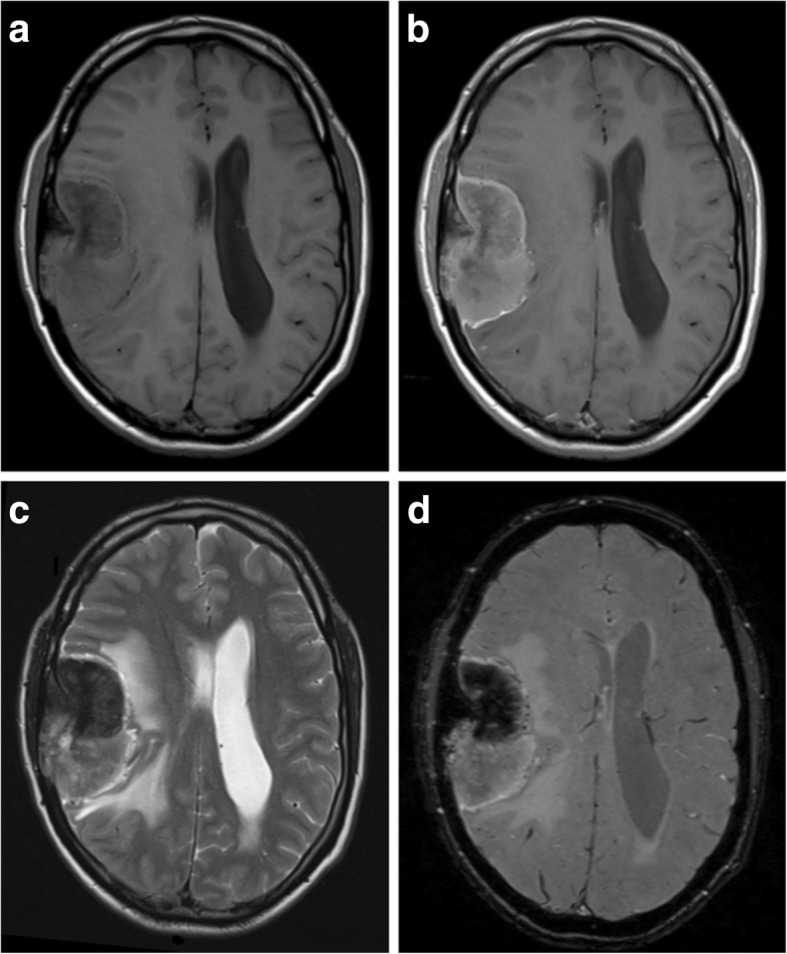
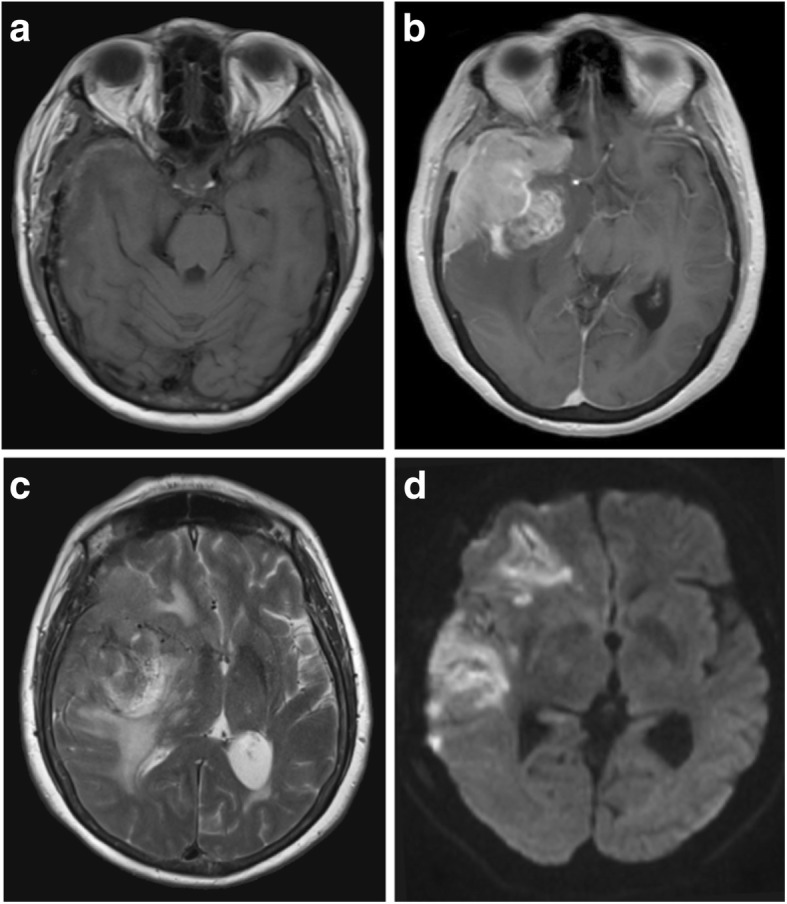
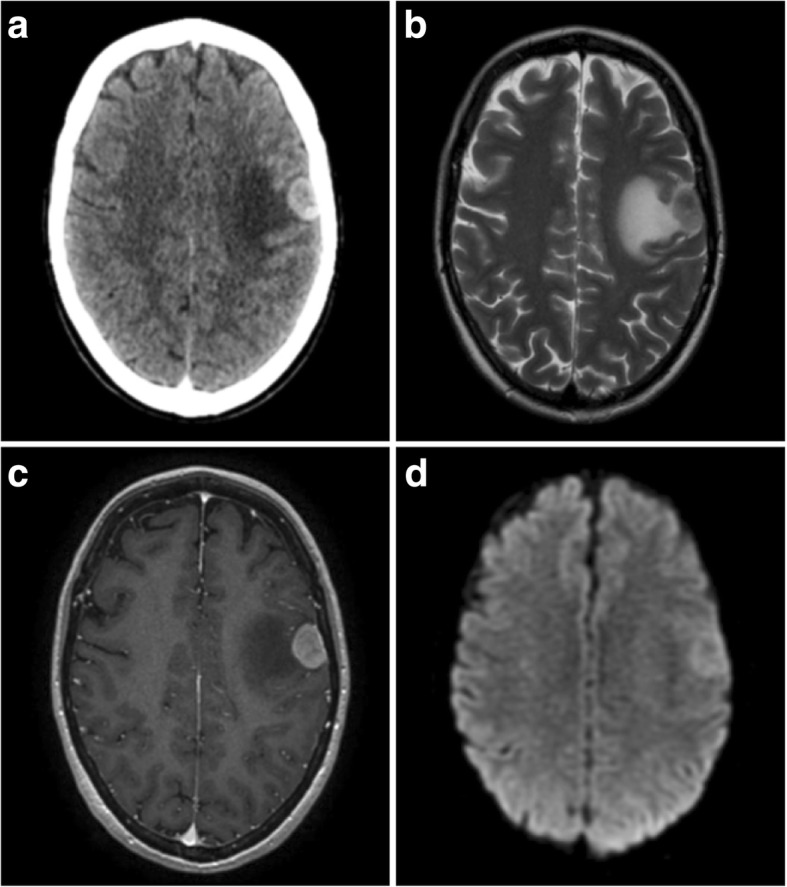
Meningiomas are the most common dural tumour. They are regularly being seen as an incidental finding on brain imaging and treated conservatively. However, there are many other dural masses which mimic their appearances, including primary neoplastic processes, metastases, granulomatous diseases and infection. While some of these are rare, others such as metastases and tuberculosis arise relatively frequently in practice. Although not pathognomonic, key features which increase the probability of a lesion being a meningioma include intralesional calcifications, skull hyperostosis, local dural enhancement and increased perfusion. It is important to have an awareness of these entities as well as their main imaging findings, as they have a wide range of prognoses and differing management strategies. This review outlines several of the most important mimics along with their imaging findings on both standard and advanced techniques with key features which may be used to help differentiate them from meningiomas.

Keywords: Diagnosis; Diagnostic; Differential; Dura mater; Imaging; Meningeal neoplasms; Meningioma.


Conflict of interest statement

Competing interests

The authors declare that they have no competing interests.

Publisher’s Note

Springer Nature remains neutral with regard to jurisdictional claims in published maps and institutional affiliations.

Figures

Fig. 1
Fig. 1
Typical meningioma. a Axial T2-weighted MR image of a well-circumscribed meningioma indenting the cortex with a small cleft of CSF. b Coronal post-contrast T1-weighted image showing uniform enhancement, an enhancing-thickened dural tail and hyperostosis of the overlying calvarium. c Unenhanced CT illustrating the adjacent hyperostosis of the skull. d Magnetic resonance spectroscopy of a similar meningioma demonstrating a high choline:creatine (Cho:Cr) ratio and a low N-acetylaspartate (NAA) peak
Fig. 2
Fig. 2
Atypical meningioma. a, b Pre- and post-contrast axial T1-weighted MR images showing a heterogeneously enhancing mass with a wide dural base, CSF cleft and bony involvement. The cortical interface is less distinct when compared with Fig. 1, and there is a moderate amount of associated vasogenic oedema. c Axial T2-weighted MR image of the same lesion. d Susceptibility-weighted images show internal calcification
Fig. 3
Fig. 3
Atypical meningioma. a, b Pre- and post-contrast axial T1-weighted MR images showing a heterogeneously enhancing mass with a wide dural bass, dural tail and CSF cleft. The cortical interface is poorly outlined suggestive invasion of the underlying brain parenchyma as well as the adjacent skull. c Axial T2-weighted MR image of the same lesion with surrounding vasogenic oedema and midline shift. d A diffusion-weighted image shows heterogeneous areas of restricted diffusion extending into the adjacent cortex
Fig. 4
Fig. 4
Breast cancer metastasis. a Post-contrast axial CT showing a strongly enhancing extra-axial lesion with a wide dural base and associated vasogenic oedema. There is no bony hyperostosis or erosion. b T2-weighted axial image of the same lesion which has an indistinct cortical interface suggestive of involvement. c Post-contrast axial T1-weighted MR image of the lesion with some slight heterogeneous but strong enhancement. d Diffusion-weighted imaging demonstrated intermediate restricted diffusion within the lesion
Fig. 5
Fig. 5
Non-germ cell seminoma metastasis. a Sagittal unenhanced CT image showing an irregular and hyperdense extra-axial mass with a wide dural attachment and only minimal vasogenic oedema. b Sagittal CT image on the bone windowing showing bony destruction adjacent to the lesion (white arrowheads) and no hyperostosis. c Post-contrast sagittal T1-weighted MR image showing only minimal irregular peripheral enhancement and no dural tail. The sagittal sinus is involved and occluded. On unenhanced T1-weighted images, the lesion was isointense to white matter and contained small areas of T1-shortening consistent with haemorrhage. d Coronal T2-weighted image of the same lesion
Fig. 6
Fig. 6
Dural glioblastoma metastasis. a Post-contrast sagittal T1-weighted MR image showing an avidly enhancing intra-dural, extra-medullary lesion within the upper posterior cervical spine. An enhancing dural tail is seen superiorly (white arrow). b T2-weighted sagittal images of the same lesion. c, d Axial T1 and T2-weighted images show the posterior intra-dural and extra-medullary location of the lesion which is compressing the cord to the left
Fig. 7
Fig. 7
Solitary fibrous tumour. a, b Pre- and post-contrast axial T1-weighted MR images showing an avidly enhancing extra-axial lesion straddling the falx cerebri. An enhancing dural tail is seen anteriorly (white arrow). c On T2 FLAIR images, the lesion has regions of high and low signal consistent with its fibrous collagen composition. Note how these low signal regions enhance with administration of contrast in Fig. 7b. d On unenhanced CT images, the mass is largely hyperdense with no areas of calcification
Fig. 8
Fig. 8
Lymphomatous deposit. a, b Pre- and post-contrast sagittal T1-weighted MR images showing a solitary extra-axial lymphomatous deposit with a wide dural base and avid enhancement. It is lobulated, and its border is ‘fluffy’ and less distinct than that of the typical meningioma. There was no skull hyperostosis or intratumoural calcification on CT imaging. c Axial T2-weighted MR image of the same lesion showing marked vasogenic oedema. d Maximum intensity projected FDG PET image demonstrates avid tracer uptake within the lesion
Fig. 9
Fig. 9
Multifocal dural lymphoma. a, b Pre- and post-contrast axial T1-weighted MR images showing diffuse dural thickening and enhancement with superimposed dural masses. c Axial T2-weighted MR image of the same lesions. d Apparent diffusion coefficient (ADC) map showing intense restricted diffusion within the multiple dural mass lesions in keeping with high cellularity
Fig. 10
Fig. 10
Glioblastoma. a, b Pre- and post-contrast sagittal T1-weighted MR images showing a vascular and heterogeneously enhancing lesion with areas of internal necrosis and haemorrhage. c T2-weighed axial MR image of the same lesion showing internal flow voids, an apparent thin CSF cleft and a small amount of perilesional oedema. d Selective right internal carotid artery angiogram demonstrates a highly vascular mass with multiple abnormal and aneurysmal vessels (performed pre-embolisation)
Fig. 11
Fig. 11
Solitary tuberculoma. a, b Pre- and post-contrast axial T1-weighted MR images showing a strongly and homogenously enhancing lesion with a wide dural base at the right orbital apex (outlined arrow). No other intracerebral or meningeal lesions were seen. c T2-weighed axial MR image of the same lesion showing an isointense lesion with no associated vasogenic oedema. d Post-contrast coronal T1-weighted MR image demonstrating the lesion’s dural attachment (solid white arrow)
Fig. 12
Fig. 12
Granulomatosis with polyangiitis of the skull base. a, b Post-contrast T1-weighted axial and coronal MR images showing enhancing inflammatory soft tissue involving the skull base and cavernous sinuses. There is also inflammatory change within the adjacent sphenoid sinus. c T2-weighted axial image of the same lesion at the level of the cavernous sinuses. d Post-contrast axial CT image again showing avid enhancement within durally based abnormal soft tissue
Fig. 13
Fig. 13
IgG4-related hypertrophic pachymeningitis with skull invasion. a Post-contrast coronal T1-weighted MR image showing linear dural thickening and enhancement overlying the left cerebral convexity. Note that the overlying calvarial bone marrow signal is abnormal. b Apparent diffusion coefficient (ADC) map showing restricted diffusion in the lesion overlying the left parietal region. c Post-contrast axial T1-weighted image of the same lesion with enhancing soft tissue seen invading the skull. d Axial fluid attenuated inversion recovery (FLAIR) image showing the lesion is predominantly hypointense due to fibrosis with foci of hyperintensity

References

    1. Weber DC, Lovblad KO, Rogers L. New pathology classification, imagery techniques and prospective trials for meningiomas: the future looks bright. Curr Opin Neurol. 2010;23(6):563–570. doi: 10.1097/WCO.0b013e328340441e. - DOI - PubMed
    1. Ghosal N, Dadlani R, Gupta K, Furtado SV, Hegde AS. A clinicopathological study of diagnostically challenging meningioma mimics. J Neurooncol. 2012;106(2):339–352. doi: 10.1007/s11060-011-0669-3. - DOI - PubMed
    1. Laigle-Donadey F, Taillibert S, Mokhtari K, Hildebrand J, Delattre JY (2005) Dural metastases. J Neurooncol 75(1):57–61 - PubMed
    1. Cea-Soriano L, Wallander MA, García Rodríguez LA. Epidemiology of meningioma in the United Kingdom. Neuroepidemiology. 2012;39(1):27–34. doi: 10.1159/000338081. - DOI - PubMed
    1. Louis DN, Perry A, Reifenberger G, et al. The 2016 World Health Organization classification of tumors of the central nervous system: a summary. Acta Neuropathol. 2016;131(6):803–820. doi: 10.1007/s00401-016-1545-1. - DOI - PubMed

LinkOut - more resources