. 2019 May;33(5):5850-5863.
doi: 10.1096/fj.201801145R. Epub 2019 Feb 6.

Muscle cannabinoid 1 receptor regulates Il-6 and myostatin expression, governing physical performance and whole-body metabolism

Affiliations

Muscle cannabinoid 1 receptor regulates Il-6 and myostatin expression, governing physical performance and whole-body metabolism

Isabel González-Mariscal et al. FASEB J. 2019 May.

Abstract

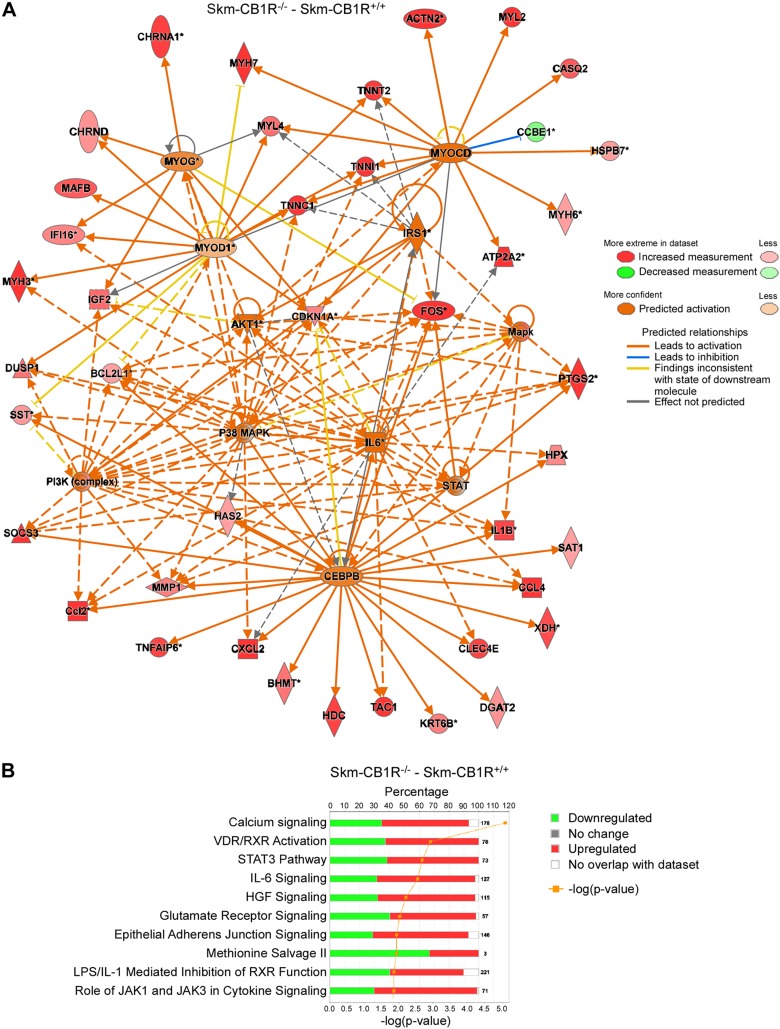
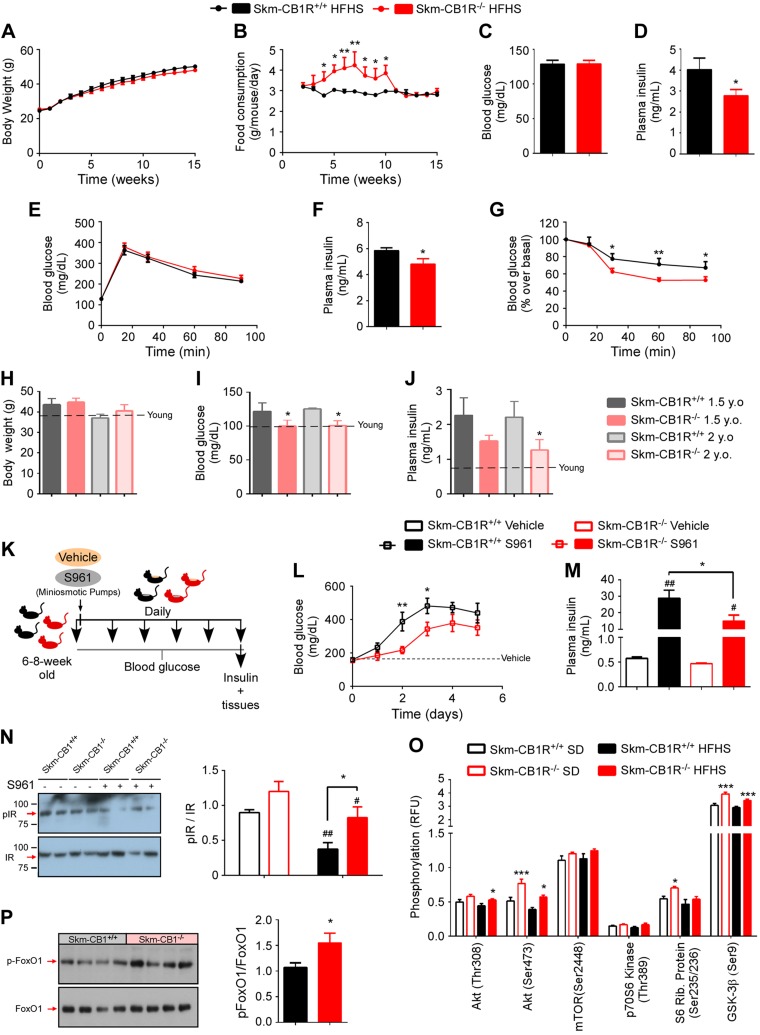
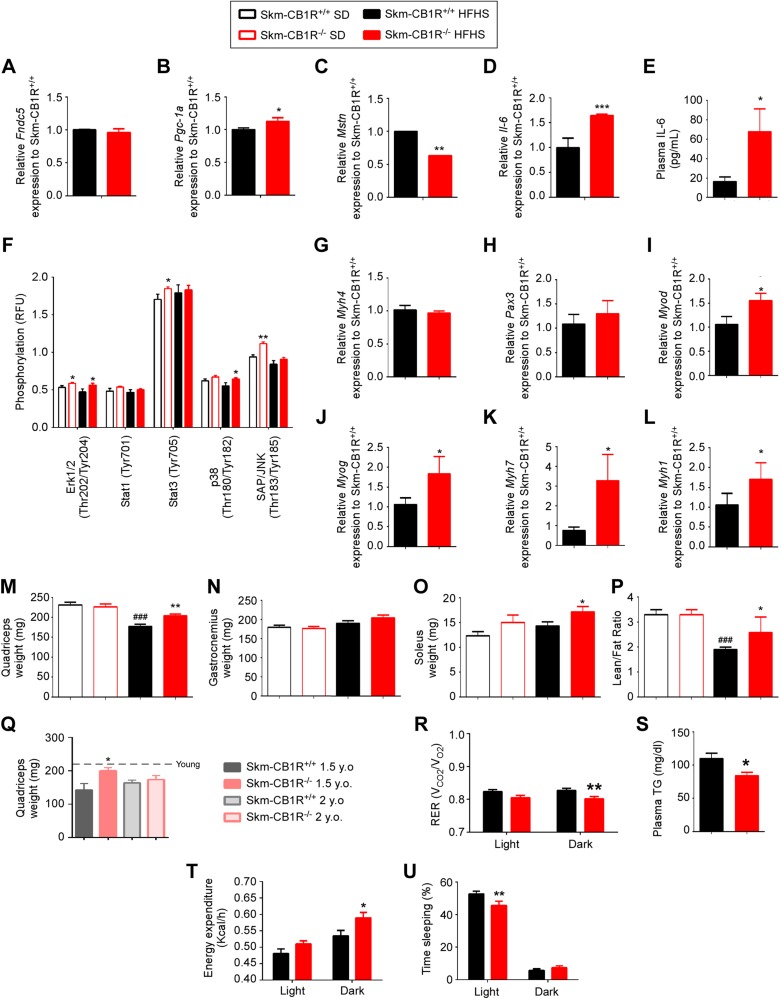
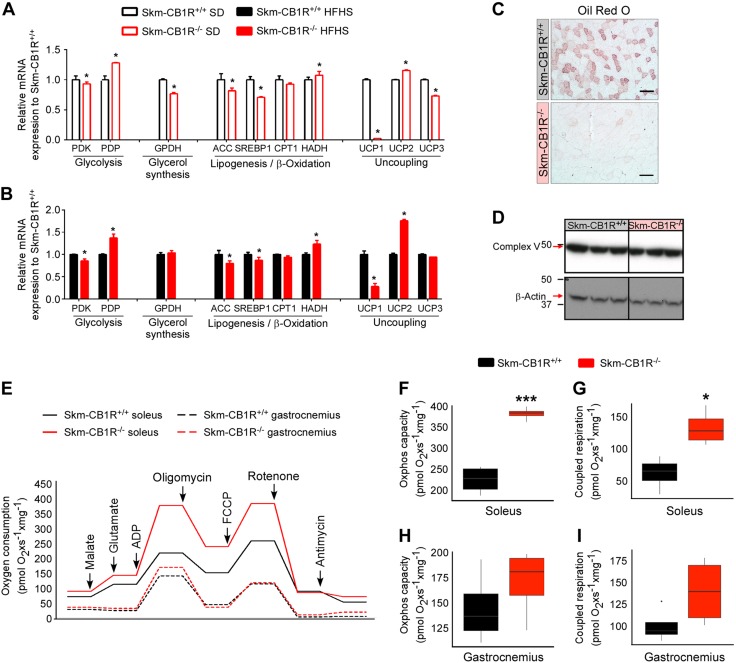
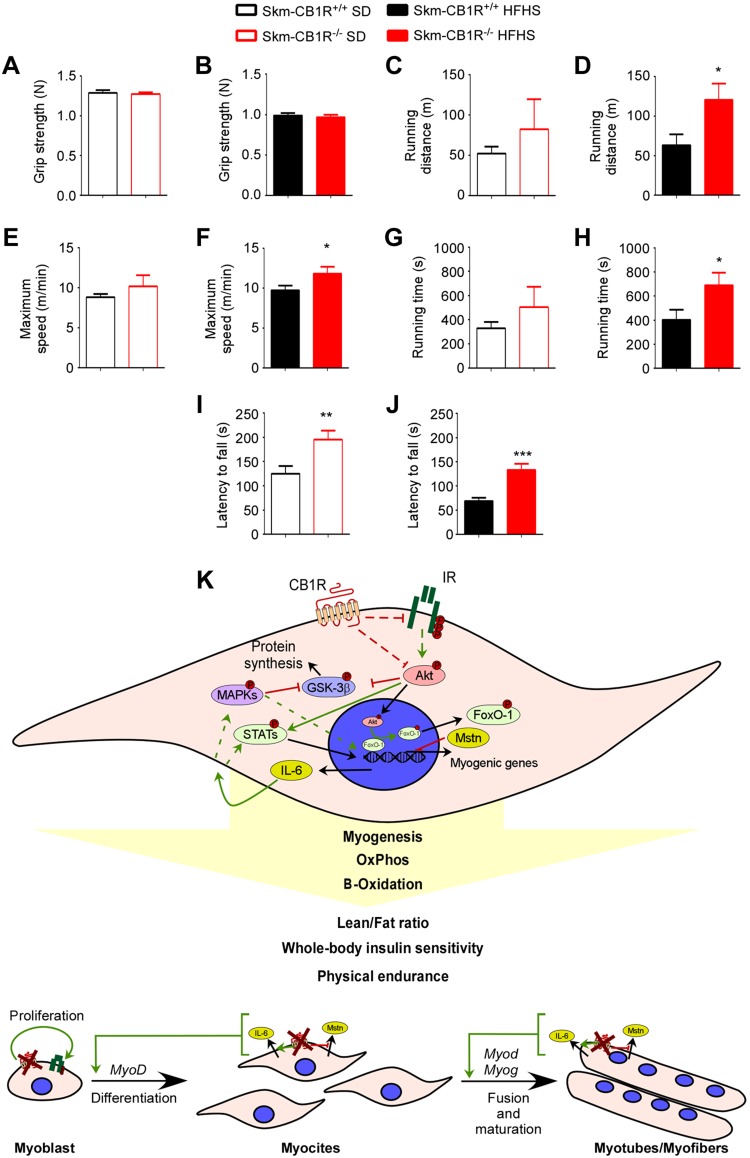
Sarcopenic obesity, the combination of skeletal muscle mass and function loss with an increase in body fat, is associated with physical limitations, cardiovascular diseases, metabolic stress, and increased risk of mortality. Cannabinoid receptor type 1 (CB1R) plays a critical role in the regulation of whole-body energy metabolism because of its involvement in controlling appetite, fuel distribution, and utilization. Inhibition of CB1R improves insulin secretion and insulin sensitivity in pancreatic β-cells and hepatocytes. We have now developed a skeletal muscle-specific CB1R-knockout (Skm-CB1R-/-) mouse to study the specific role of CB1R in muscle. Muscle-CB1R ablation prevented diet-induced and age-induced insulin resistance by increasing IR signaling. Moreover, muscle-CB1R ablation enhanced AKT signaling, reducing myostatin expression and increasing IL-6 secretion. Subsequently, muscle-CB1R ablation increased myogenesis through its action on MAPK-mediated myogenic gene expression. Consequently, Skm-CB1R-/- mice had increased muscle mass and whole-body lean/fat ratio in obesity and aging. Muscle-CB1R ablation improved mitochondrial performance, leading to increased whole-body muscle energy expenditure and improved physical endurance, with no change in body weight. These results collectively show that CB1R in muscle is sufficient to regulate whole-body metabolism and physical performance and is a novel target for the treatment of sarcopenic obesity. -González-Mariscal, I., Montoro, R. A., O'Connell, J. F., Kim, Y., Gonzalez-Freire, M., Liu, Q.-R., Alfaras, I., Carlson, O. D., Lehrmann, E., Zhang, Y., Becker, K. G., Hardivillé, S., Ghosh, P., Egan, J. M. Muscle cannabinoid 1 receptor regulates Il-6 and myostatin expression, governing physical performance and whole-body metabolism.

Keywords: CB1R; insulin sensitivity; myokines; skeletal muscle.


Conflict of interest statement

This work was supported by the U.S. National Institutes of Health, National Institute on Aging Intramural Research Program. S961 was donated by Novo Nordisk. The authors declare no conflicts of interest.

Figures

Figure 1
Figure 1
Analysis of gene expression array by IPA of skeletal muscle from Skm-CB1R+/+ and Skm-CB1R−/− mice. A) Microarray analysis of RNA extracted from Skm-CB1R+/+ and Skm-CB1R−/− muscle (gastrocnemius). Changes were analyzed by IPA software and Ingenuity Upstream Regulator Analysis is shown. B) Canonical pathway expression changes in a microarray of RNA from Skm-CB1R+/+ and Skm-CB1R−/− muscle (n = 4 unique mice/group). HGF, human growth factor.
Figure 2
Figure 2
Skm-CB1R−/− mice are protected from insulin resistance compared with Skm-CB1R+/+ mice. Skm-CB1R−/− and Skm-CB1R+/+ male mice (6–8 wk old) were fed an HFHS for 3 mo. A–G) Body weight (A) and food consumption (B) over the course of 15 wk. Fasting blood glucose (C) and fasting plasma insulin (D) levels after 15 wk. Blood glucose during an IPGTT (E), plasma insulin 15 min after glucose administration (F), and ITT after 15 wk of HFHS (G) (n = 9 mice). Data show means ± sem. F = 9.6, F = 25.8, F = 10.1. *P ≤ 0.05, **P ≤ 0.01 (ANOVA or Student’s t test). HJ) Skm-CB1R+/+ and Skm-CB1R−/− mice were aged up to 2 yr. Body weight (H), fasting blood glucose (I), and fasting plasma insulin (J) levels were measured at 1.5 and 2 yr of age. Dotted line shows levels at 6 mo of age (n = 6–17 mice). Data show means ± sem. *P ≤ 0.05 compared with Skm-CB1R+/+ mice (Student’s t test). K) Male mice (6–8 wk old) were continuously infused with S961, an IR antagonist, for 5 d. L) Circulating blood glucose was measured daily. M) Circulating plasma insulin at d 5 of S961 or vehicle infusion. N) Postmortem analysis (d 5 of S961 or vehicle infusion) of insulin signaling in Skm-CB1R+/+ and Skm-CB1R−/− quadriceps by Western blot for phospho-IR and total IR (n = 6–7 mice). Data show means ± sem. F = 5.6. *P ≤ 0.05 compared with Skm-CB1R+/+ mice, #P ≤ 0.05, ##P ≤ 0.01 compared with vehicle (ANOVA or Student’s t test). O) Quantification of protein phosphorylation downstream of insulin in skeletal muscle (gastrocnemius) from SD- (empty bars) or HFHS-fed (filled bars) Skm-CB1R+/+ and Skm-CB1R−/− mice as measured by phosphoprotein array. P) Western blot for phospho-FoxO1 and total FoxO1 and densitometry quantification (n = 6–9 mice each run in duplicates). P, phosphorylated; Rib, ribosomal; RFU, relative fluorescence units. Data show means ± sem. *P ≤ 0.05, **P ≤ 0.01, ***P ≤ 0.001 compared with Skm-CB1R+/+ mice (Student’s t test).
Figure 3
Figure 3
Skeletal muscle–CB1R ablation impacts myokine expression and induces myogenesis and whole-body energy expenditure. A–C) Analysis of relative mRNA expression of myokines by real-time PCR in skeletal muscle (gastrocnemius) from HFHS-fed Skm-CB1R−/− and Skm-CB1R+/+ mice. Irisin (Fndc5) (A), Pgc1a (B), and Mstn (C) relative mRNA expression to Skm-CB1R+/+ mice. D) Il-6 relative mRNA expression to Skm-CB1R+/+ mice. E) Plasma levels of Il-6. F) Quantification of protein phosphorylation (MAPK) in skeletal muscle (gastrocnemius) from SD- (empty bars) or HFHS-fed (filled bars) Skm-CB1R+/+ and Skm-CB1R−/− mice as measured by phosphoprotein array (n = 6–9 mice, each run in duplicates). GL) Analysis of relative mRNA expression of myogenic genes. Expression data was corrected to β-actin; N = 9 mice. Data show means ± sem. *P ≤ 0.05, **P ≤ 0.01, ***P ≤ 0.001 compared with Skm-CB1R+/+ mice (Student’s t test). M–O) Weight of SD-fed and HFHS-fed quadriceps (M), gastrocnemius (N), and soleus (O) from Skm-CB1R−/− and Skm-CB1R+/+ mice. P) Lean and fat mass ratio were calculated by NMR in SD-fed and HFHS-fed Skm-CB1R+/+ and Skm-CB1R−/− mice, after which mice were euthanized (n = 9 mice). Data show means ± sem. F = 1.9, F = 12, F = 3.5; *P ≤ 0.05, **P ≤ 0.01, compared with Skm-CB1R+/+ mice, ###P ≤ 0.001 compared with SD (ANOVA). Q) Weight of quadriceps in 1.5- and 2-yr-old Skm-CB1R+/+ and Skm-CB1R−/− mice. Dotted line shows weight at 6 mo of age (n = 5–11). R) RER was measured during light (resting) and dark (active) cycles at wk 15 of diet. S) Plasma levels of triglycerides (TG) in HFHS-fed Skm-CB1R+/+ and Skm-CB1R−/− mice. T, U) Energy expenditure (T) and sleeping time (U) during light and dark cycles (n = 9 mice). RFU, relative fluorescence units. Data show means ± sem. *P ≤ 0.05, **P ≤ 0.01, ***P ≤ 0.001 (Student’s t test).
Figure 4
Figure 4
Ablation of CB1R induces a metabolic change in muscle and improves mitochondrial performance. A, B) Analysis of relative mRNA expression of metabolic genes in muscle from SD-fed (A) and HFHS-fed (B) Skm-CB1R+/+ and Skm-CB1R−/− mice (n = 9 mice). Data show means ± sem. *P ≤ 0.05 compared with Skm-CB1R+/+ mice (Student’s t test). C) Oil Red O staining of skeletal muscle from Skm-CB1R+/+ and Skm-CB1R−/− mice. Scale bars, 50 µm. D) Western blot of the mitochondrial complex V of the respiratory chain. E) Analysis of oxygen consumption in Skm-CB1R+/+ and Skm-CB1R−/− digitonized myofibers. F–I) Analysis of maximum oxidative phosphorylation capacity (F, H) and oxygen consumption coupled to ATP production (G, I) in soleus (F, G) and gastrocnemius (H, I) (n = 4 mice). ACC, acetyl-coA carboxylase; CPT1, carnitine palmitoyl transferase-1; HADH, hydroxyacyl-coenzyme A dehydrogenase; GPDH, glycerol-3-phosphate dehydrogenase; PDK, pyruvate dehydrogenase kinase; PDP, pyruvate dehydrogenase phosphatase. Data show medians ± range. *P ≤ 0.05, ***P ≤ 0.001 compared with Skm-CB1R+/+ mice (Student’s t test).
Figure 5
Figure 5
Skm-CB1R−/− mice have more physical endurance than Skm-CB1R+/+ mice. A–H) Grip strength was measured in SD-fed (A) and HFHS-fed (B) Skm-CB1R+/+ and Skm-CB1R−/− mice. Maximum running distance (C, D), maximum running speed (E, F), and maximum running time (G, H) in SD-fed and HFHS-fed Skm-CB1R+/+ and Skm-CB1R−/− mice measured in a treadmill test. I, J) Mice were placed on a rotarod and time to fall in seconds was measured (n = 9 mice). Data show means ± sem. *P ≤ 0.05, **P ≤ 0.01, ***P ≤ 0.001 (Student’s t test). K) Schema of CB1R function in skeletal muscle. CB1R down-regulates IR/AKT signaling, impacting the transcriptional regulation of the myokines Mstn and Il-6. IL-6, when secreted, activates via MAPKs signaling the myogenesis. IL-6 also impacts muscle metabolism by inducing β-oxidation and oxidative phosphorylation. Therefore, ablation of CB1R in muscle would lead to an increase in muscle mass (induce proliferation, differentiation, and fusion/maturation) and lean/fat ratio, improved whole-body insulin sensitivity, and physical endurance.

References

    1. Gonzalez-Freire M., Semba R. D., Ubaida-Mohien C., Fabbri E., Scalzo P., Højlund K., Dufresne C., Lyashkov A., Ferrucci L. (2017) The human skeletal muscle proteome project: a reappraisal of the current literature. J. Cachexia Sarcopenia Muscle 8, 5–18 - PMC - PubMed
    1. Ali S., Garcia J. M. (2014) Sarcopenia, cachexia and aging: diagnosis, mechanisms and therapeutic options - a mini-review. Gerontology 60, 294–305 - PMC - PubMed
    1. Waters D. L., Baumgartner R. N. (2011) Sarcopenia and obesity. Clin. Geriatr. Med. 27, 401–421 - PubMed
    1. Pedersen B. K., Febbraio M. A. (2012) Muscles, exercise and obesity: skeletal muscle as a secretory organ. Nat. Rev. Endocrinol. 8, 457–465 - PubMed
    1. Langley B., Thomas M., Bishop A., Sharma M., Gilmour S., Kambadur R. (2002) Myostatin inhibits myoblast differentiation by down-regulating MyoD expression. J. Biol. Chem. 277, 49831–49840 - PubMed

Publication types

MeSH terms