. 2019 Mar 21;30(7):907-922.
doi: 10.1091/mbc.E18-10-0633. Epub 2019 Feb 6.

The RhoGAP SPV-1 regulates calcium signaling to control the contractility of the Caenorhabditis elegans spermatheca during embryo transits

Affiliations

The RhoGAP SPV-1 regulates calcium signaling to control the contractility of the Caenorhabditis elegans spermatheca during embryo transits

Jeff Bouffard et al. Mol Biol Cell. .

Abstract

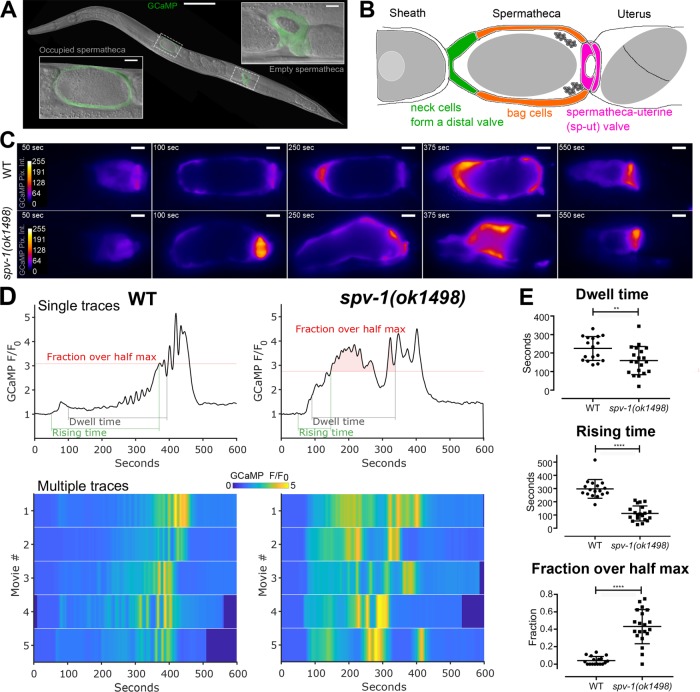
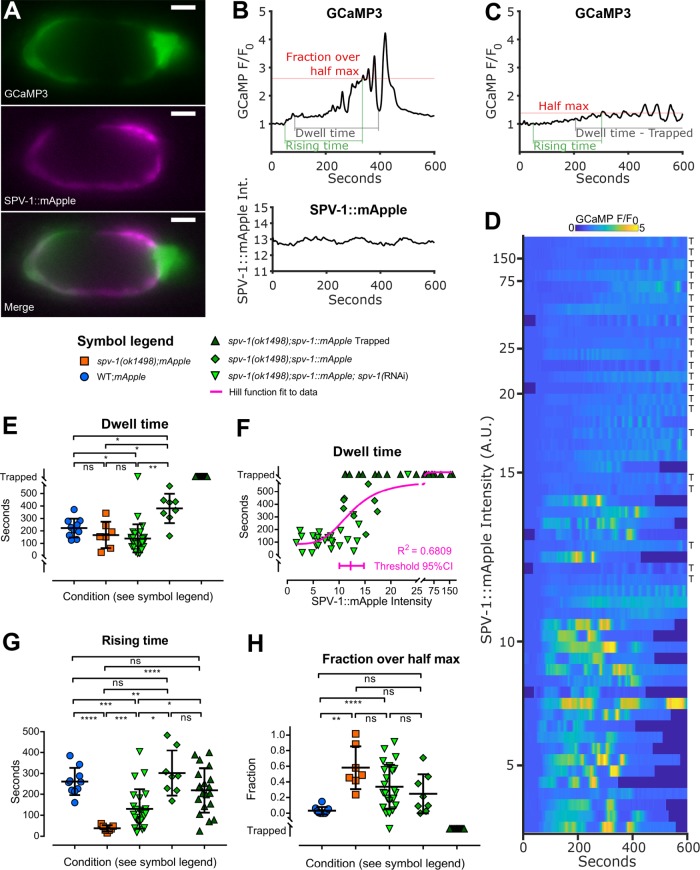
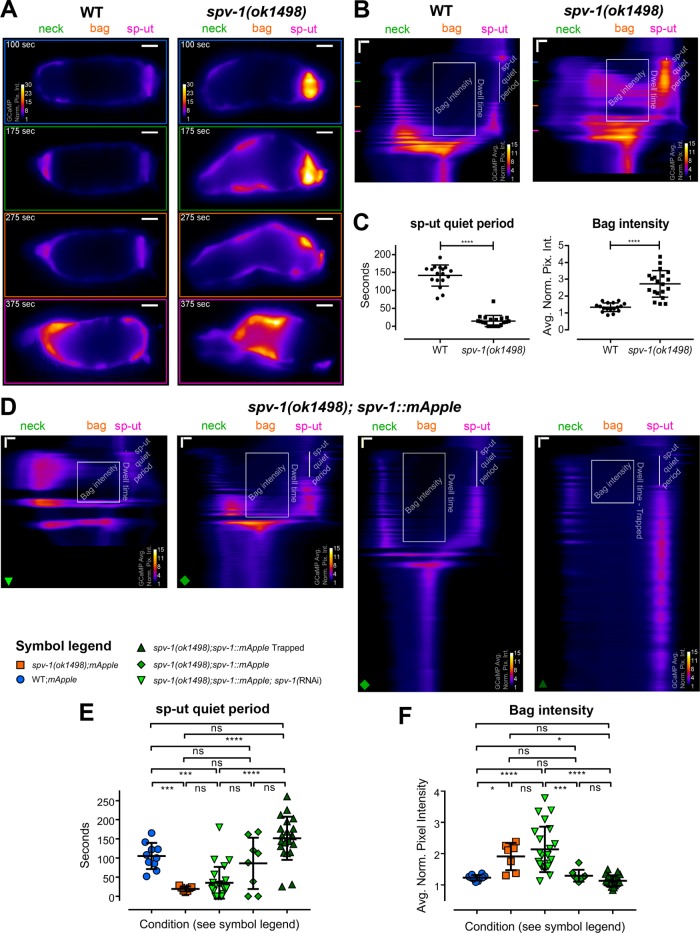
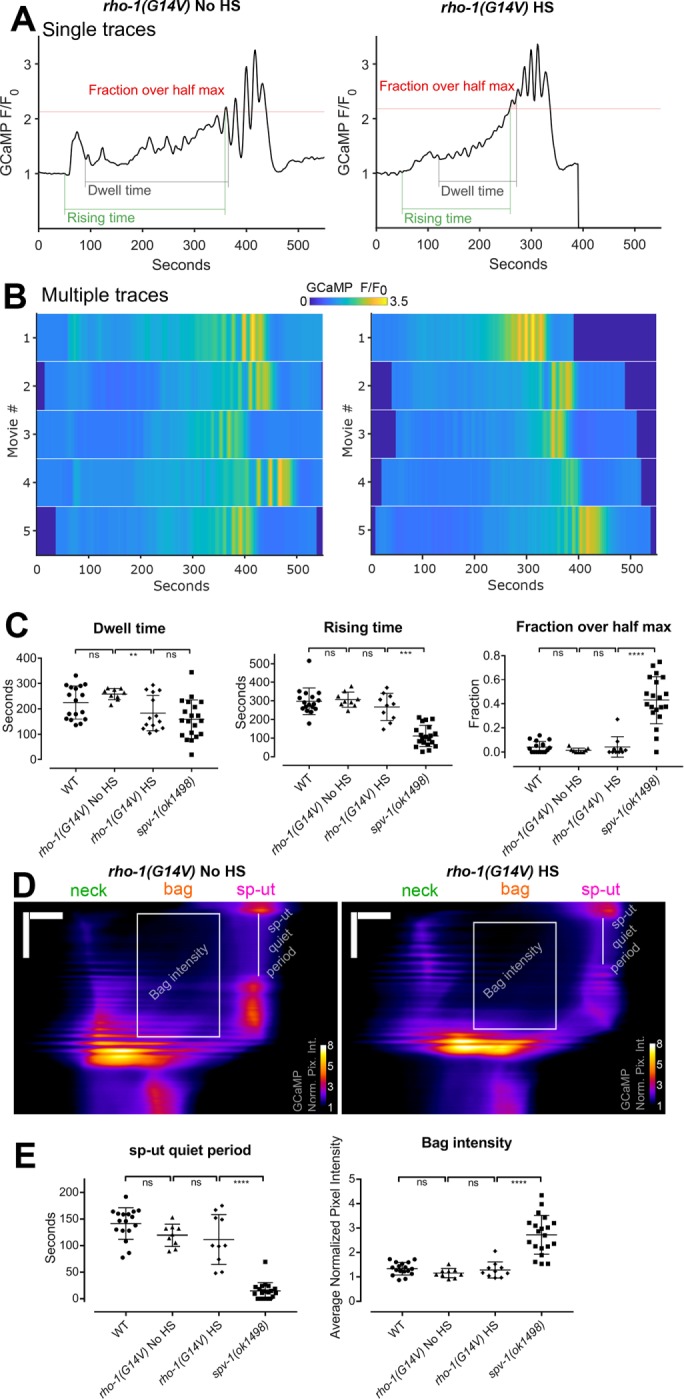
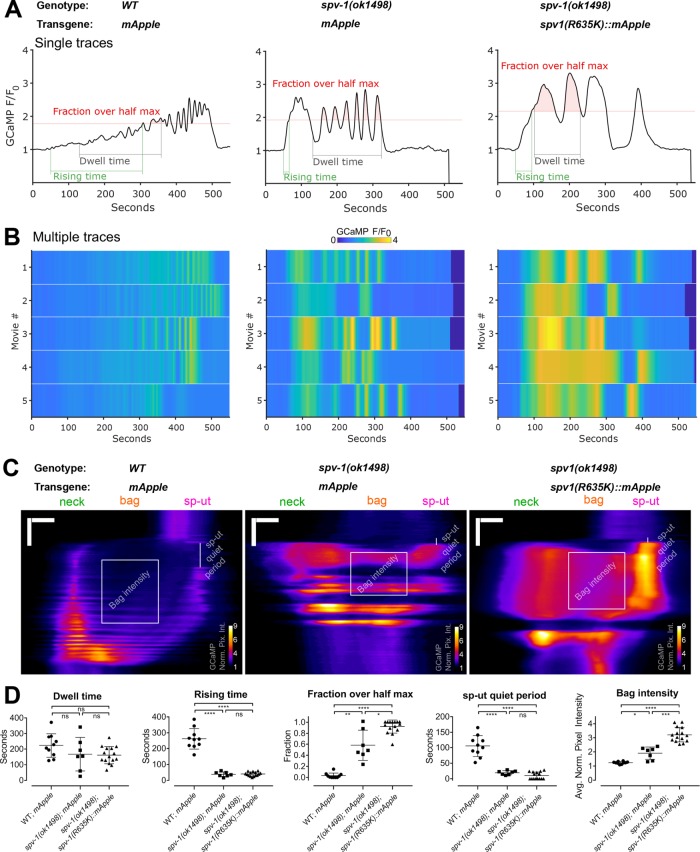
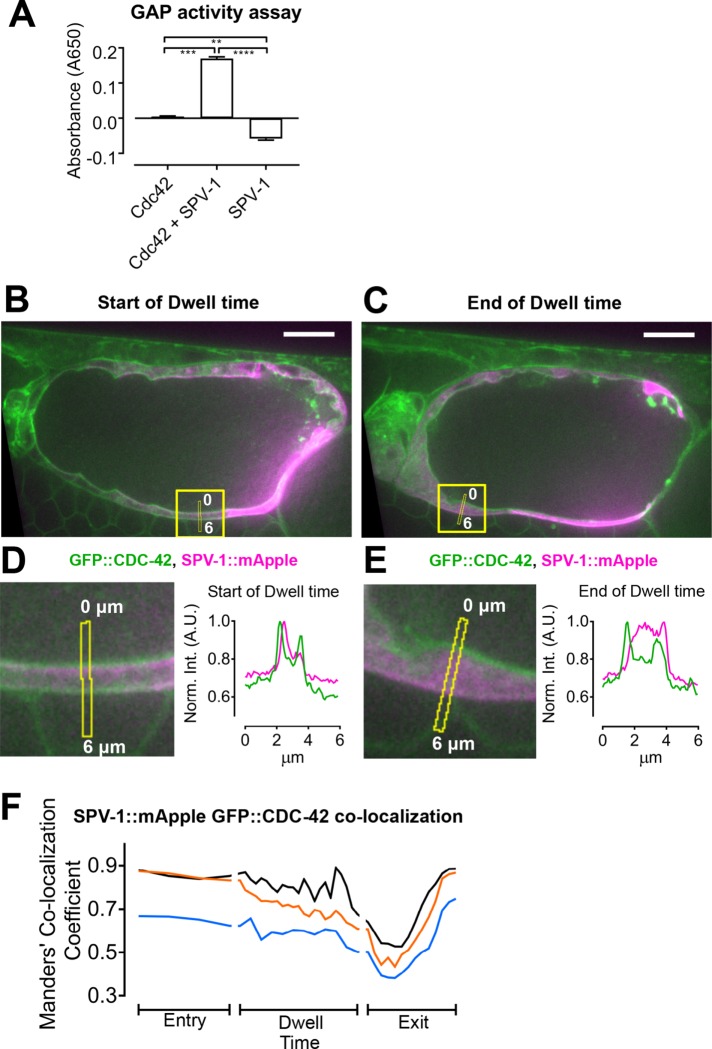
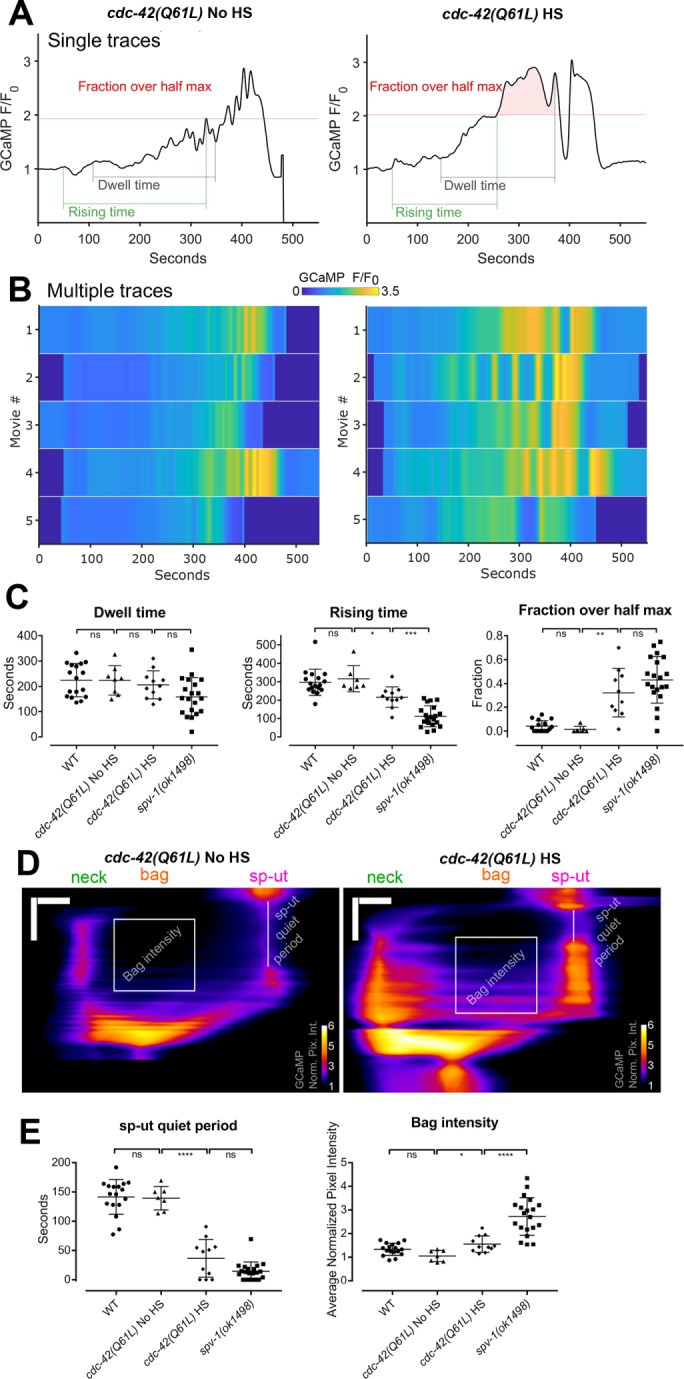
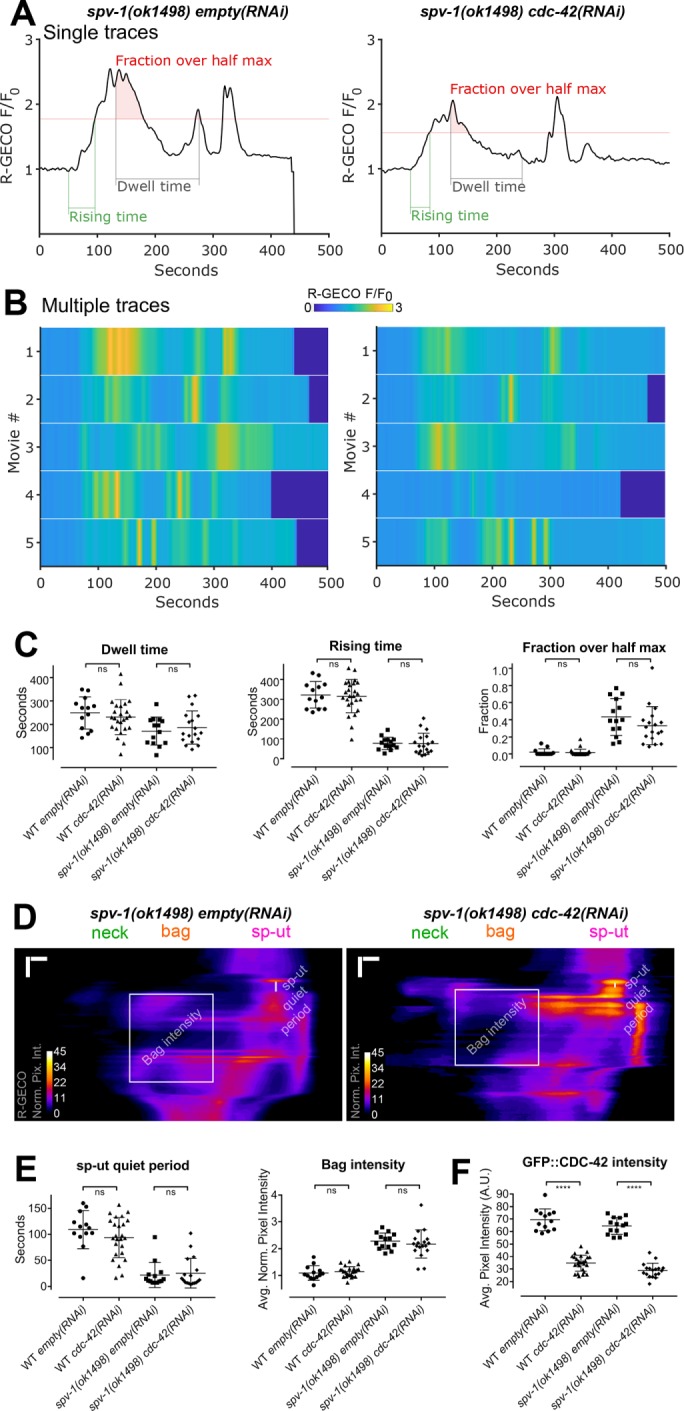
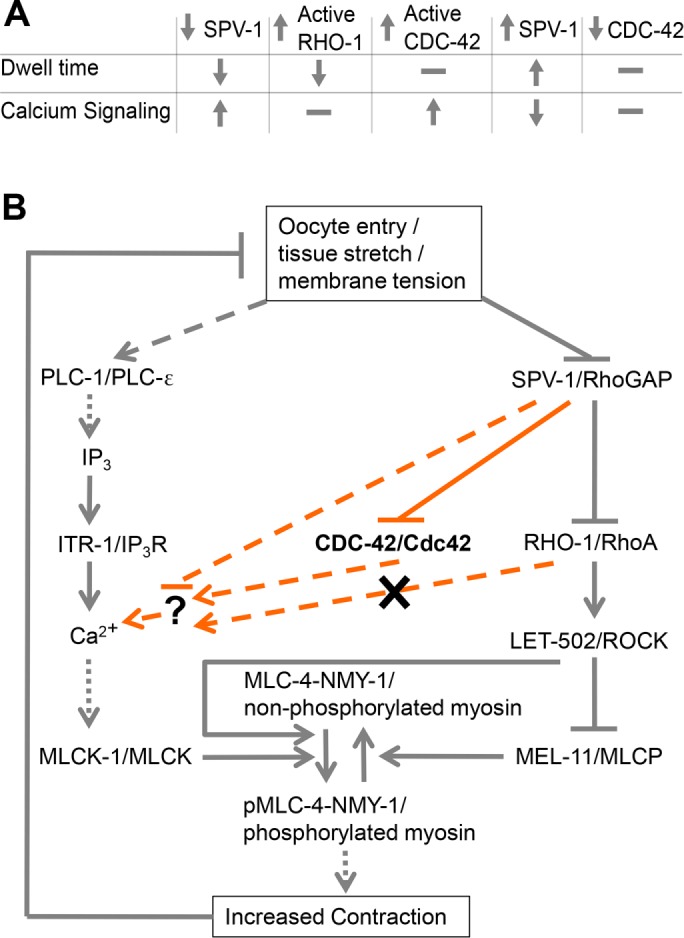
Contractility of the nonmuscle and smooth muscle cells that comprise biological tubing is regulated by the Rho-ROCK (Rho-associated protein kinase) and calcium signaling pathways. Although many molecular details about these signaling pathways are known, less is known about how they are coordinated spatiotemporally in biological tubes. The spermatheca of the Caenorhabditis elegans reproductive system enables study of the signaling pathways regulating actomyosin contractility in live adult animals. The RhoGAP (GTPase--activating protein toward Rho family small GTPases) SPV-1 was previously identified as a negative regulator of RHO-1/Rho and spermathecal contractility. Here, we uncover a role for SPV-1 as a key regulator of calcium signaling. spv-1 mutants expressing the calcium indicator GCaMP in the spermatheca exhibit premature calcium release, elevated calcium levels, and disrupted spatial regulation of calcium signaling during spermathecal contraction. Although RHO-1 is required for spermathecal contractility, RHO-1 does not play a significant role in regulating calcium. In contrast, activation of CDC-42 recapitulates many aspects of spv-1 mutant calcium signaling. Depletion of cdc-42 by RNA interference does not suppress the premature or elevated calcium signal seen in spv-1 mutants, suggesting other targets remain to be identified. Our results suggest that SPV-1 works through both the Rho-ROCK and calcium signaling pathways to coordinate cellular contractility.


Figures

FIGURE 1:
FIGURE 1:
Loss of SPV-1 alters calcium signaling in the spermatheca. (A) An adult nematode with labeled spermathecae, showing one with an embryo inside (left) and one without an embryo inside (right). Scale bars: 100 μm (large image); 10 μm (insets). (B) Tissue-level schematic cartoon of the spermatheca. The spermatheca consists of three distinct regions: the cells closest to the sheath form a neck, or distal valve, that constricts to enclose the newly entered embryo, the central cells form a bag that accommodates the embryo during fertilization and egg shell deposition, and the spermatheca and uterus are connected by the sp-ut valve. (C) Still frames from GCaMP movies of embryo transits in wild-type (WT) (top) and spv-1(ok1498) (bottom) animals. Movies were temporally aligned to the start of oocyte entry at 50 s. (D) GCaMP time series generated from GCaMP movies (Supplemental Movie 1), with metrics highlighted. Dwell time is a tissue function metric calculated as the time from the closing of the distal valve to the opening of the sp-ut valve; rising time is a calcium signaling metric measuring the time from the opening of the distal valve to the first time point where the time series reaches half its maximum; and fraction over half max is a calcium signaling metric measuring how much of the dwell time is spent over the half maximum. Bottom panels show heat maps of five time series for each condition. The top line of the heat map is the time series in the top panel. (E) Quantification of metrics from time series. Error bars display SD, and p values were calculated using Welch’s t test: **, p < 0.01; ****, p < 0.0001.
FIGURE 2:
FIGURE 2:
Spermathecal tissue function and calcium signaling exhibit a threshold response to SPV-1::mApple. (A) Still images from a dual-labeled spermatheca expressing GCaMP and SPV-1::mApple. Scale bars: 10 μm. Brightness is enhanced for presentation. (B) GCaMP time series of normalized average pixel intensity, F/F0 (top), and SPV1::mApple time series of raw average pixel intensity (bottom), from a single embryo transit movie over the same spatial frame and time. (C) A representative GCaMP time series from an SPV-1::mApple–expressing spermatheca containing a trapped embryo, corresponding to the top row of the heat map in D. (D) Heat map showing GCaMP time series from 53 embryo transit movies of varying SPV-1::mApple intensity, ranked with the highest SPV-1::mApple intensity at the top and decreasing with each row. Rows labeled with “T” indicate trapped embryo. (E) Dwell times plotted as a function of condition. (F) Dwell times plotted as a function of SPV-1::mApple intensity. The threshold value from the fitted Hill function is 12.2, with the 95% confidence interval from 10.1 to 14.8. (G) Rising times plotted as a function of condition. (H) Fractions over half max plotted as a function of condition. In E, G, and H, error bars display SD, and p values were calculated using Welch’s ANOVA with Games-Howell multiple comparison: ns, p ≥ 0.05; *, p < 0.05; **, p < 0.01; ***, p < 0.001; ****, p < 0.0001.
FIGURE 3:
FIGURE 3:
SPV-1 regulates spatiotemporal aspects of calcium signaling. (A) Individual frames from wild-type (left) and spv-1(ok1498) (right) embryo transit movies, the same movies as Figure 1C. All frames follow the color scale indicated in the top frame. Scale bars: 10 μm. (B) Kymograms of the movies in A, generated by averaging over the columns of each movie frame, display the variation in average calcium signaling from the distal valve on the left to the sp-ut valve on the right, with time progressing down (Supplemental Movie 2). Horizontal scale bars: 5 μm; vertical scale bars: 50 s. Colored lines on the left side of the kymograms correspond to the individual frames in A; annotations show the two spatiotemporal calcium signaling metrics used for analysis. The sp-ut quiet period measures the low calcium signaling of the sp-ut valve after oocyte entry, which is lost in spv-1 mutants. Bag intensity measures the average normalized fluorescence intensity of a 25-μm-wide region in the bag section of the spermatheca during the dwell time. (C) Quantification of metrics. Error bars display SD, p values were calculated with Welch’s t test: ****, p < 0.0001. (D) Kymograms from embryo transit movies with SPV-1::mApple intensities of 2.5, 12.6, 16.9, and 78.5, from left to right. Horizontal scale bars: 5 μm; vertical scale bars: 50 s. (E) sp-ut quiet periods plotted as a function of condition. (F) Bag intensities plotted as a function of condition. In E and F, error bars display SD, and p values were calculated using Welch’s ANOVA with Games-Howell multiple comparison: ns, p ≥ 0.05; *, p < 0.05; ***, p < 0.001; ****, p < 0.0001.
FIGURE 4:
FIGURE 4:
Increasing RHO-1 activity alters spermathecal contractility but does not recapitulate spv-1(ok1498) mutant calcium signaling. (A) Representative time series from embryo transits with metrics annotated. (B) Heat maps showing time series from multiple embryo transits. The time series in A corresponds to the first row of the heat map. (C) Quantification of time series metrics. (D) Representative kymograms with metrics annotated. Horizontal scale bars: 10 μm; vertical scale bars: 100 s. (E) Quantification of kymogram metrics. In C and E, error bars display SD, and p values were calculated using Welch’s ANOVA with Games-Howell multiple comparison: ns, p ≥ 0.05; **, p < 0.01; ***, p < 0.001; ****, p < 0.0001. WT and spv-1(ok1498) data are duplicated from Figures 1 and 3.
FIGURE 5:
FIGURE 5:
SPV-1 regulates calcium signaling through its GAP domain. (A) Representative time series from embryo transits with metrics annotated. (B) Heat maps showing time series from multiple embryo transits. Time series in A correspond to the first rows of the heat maps. (C) Representative kymograms with metrics annotated. Horizontal scale bars: 10 μm; vertical scale bars: 100 s. (D) Quantification of metrics. Error bars display SD, and p values were calculated using Welch’s ANOVA with Games-Howell multiple comparison: ns, p ≥ 0.05; *, p < 0.05; **, p < 0.01; ***, p < 0.001; ****, p < 0.0001. WT;mApple and spv-1(ok1498); mApple data are duplicated from Figures 2 and 3.
FIGURE 6:
FIGURE 6:
SPV-1 exhibits GAP activity toward Cdc42 and partially colocalizes with CDC-42 at spermathecal cell membranes. (A) In vitro assay measuring activity of the SPV-1 RhoGAP domain toward recombinant mammalian Cdc42. Error bars display SEM, and p values were calculated using Welch’s ANOVA with Games-Howell multiple comparison: **, p < 0.01; ***, p < 0.001; ****, p < 0.0001. (B, C) The first and last frames of the dwell time from a representative movie, with the quantified region, capturing the same cell, annotated. Scale bars: 10 μm. (D, E) Left, digitally zoomed view of the quantified region, with the line scans annotated; right, average fluorescence intensity along the line scans, with GFP::CDC-42 in green and SPV-1::mApple in magenta. (F) Time series of Manders’ colocalization coefficients for embryo transit movies from three different animals. Manders’ coefficient gives the fraction of SPV-1::mApple pixel intensity in pixels that are also positive for GFP::CDC-42. The black trace is from the same movie displayed in B–E.
FIGURE 7:
FIGURE 7:
Increasing CDC-42 activity alters spermathecal calcium signaling. (A) Graphs are representative time series from embryo transits with metrics annotated. HS indicates induction of expression by heat shock. (B) Heat maps showing time series from multiple embryo transits. Time series in A corresponds to the first row of the heat map. (C) Quantification of time series metrics. (D) Representative kymograms with metrics annotated. Horizontal scale bars: 10 μm; vertical scale bars: 100 s. (E) Quantification of kymogram metrics. In C and E, error bars display SD, and p values were calculated using Welch’s ANOVA with Games-Howell multiple comparison: ns, p ≥ 0.05; *, p < 0.05; **, p < 0.01; ***, p < 0.001; ****, p < 0.0001. WT and spv-1(ok1498) data are duplicated from Figures 1 and 3.
FIGURE 8:
FIGURE 8:
cdc-42(RNAi) does not alter calcium signaling. (A) Representative time series from embryo transits with metrics annotated. (B) Heat maps showing time series from multiple embryo transits. The time series in A corresponds to the first row of the heat map. (C) Quantification of time series metrics. (D) Representative kymograms with metrics annotated. Horizontal scale bars: 5 μm; vertical scale bars: 50 s. (E) Quantification of kymogram metrics. (F) Quantification of GFP::CDC-42 intensity. In C, E, and F, error bars display SD, and p values were calculated using Welch’s t test: ns, p ≥ 0.05; ****, p < 0.0001.
FIGURE 9:
FIGURE 9:
SPV-1 regulates spermathecal contractility via calcium and Rho-ROCK signaling. (A) Summary table of findings. SPV-1 regulates both the Rho-ROCK and calcium signaling pathways, which together are required for activation of myosin and tissue contractility. Increasing RHO-1 activity leads to faster transits (decreased dwell times) similar to decreased SPV-1, but does not alter calcium signaling. Increasing active CDC-42 does not alter dwell times but does alter calcium signaling similar to decreased SPV-1. Increasing SPV-1 increases dwell times, often resulting in transit failures and embryo trapping, and decreases calcium signaling activity and magnitude. Decreasing CDC-42 using RNAi does not alter dwell time or calcium signaling. (B) Proposed model of the network regulating actomyosin contractility in the spermatheca. Gray lines along the outside display previously known interactions. Orange lines display interactions investigated in this study. Solid lines indicate direct interactions, dotted lines indicate resultant interactions with known intermediates not shown, and dashed lines indicate unknown intermediates. SPV-1, CDC-42, and/or an unknown effector symbolized by the question mark could interact with any of the upstream members of the calcium signaling pathway; those arrows were omitted for clarity.

References

    1. Aceto D, Beers M, Kemphues KJ. (2006). Interaction of PAR-6 with CDC-42 is required for maintenance but not establishment of PAR asymmetry in C. elegans. Dev Biol , 386–397. - PMC - PubMed
    1. Amado-Azevedo J, Reinhard NR, van Bezu J, van Nieuw Amerongen GP, van Hinsbergh VWM, Hordijk PL. (2018). The minor histocompatibility antigen 1 (HMHA1)/ArhGAP45 is a RacGAP and a novel regulator of endothelial integrity. Vascul Pharmacol , 38–47. - PubMed
    1. Aresta S, de Tand-Heim M-F, Béranger F, de Gunzburg J. (2002). A novel Rho GTPase-activating-protein interacts with Gem, a member of the Ras superfamily of GTPases. Biochem J , 57–65. - PMC - PubMed
    1. Barry DM, Koo Y, Norden PR, Wylie LA, Xu K, Wichaidit C, Azizoglu DB, Zheng Y, Cobb MH, Davis GE, et al (2016). Rasip1-mediated Rho GTPase signaling regulates blood vessel tubulogenesis via non-muscle myosin II. Circ Res , 810–826. - PMC - PubMed
    1. Brozovich FV, Nicholson CJ, Degen CV, Gao YZ, Aggarwal M, Morgan KG. (2016). Mechanisms of vascular smooth muscle contraction and the basis for pharmacologic treatment of smooth muscle disorders. Pharmacol Rev Pharmacol Rev , 476–532. - PMC - PubMed

Publication types

MeSH terms

LinkOut - more resources