. 2019 Feb 6;14(2):e0211832.
doi: 10.1371/journal.pone.0211832. eCollection 2019.

Synchronization of pancreatic islets by periodic or non-periodic muscarinic agonist pulse trains

Affiliations

Synchronization of pancreatic islets by periodic or non-periodic muscarinic agonist pulse trains

Joel E Adablah et al. PLoS One. .

Abstract

Pulsatile insulin secretion into the portal vein from the many pancreatic islets of Langerhans is critical for efficient glucose homeostasis. The islets are themselves endogenous oscillators, but since they are not physically coupled it is not obvious how their oscillations are synchronized across the pancreas. It has been proposed that synchronization of islets is achieved through periodic activity of intrapancreatic ganglia, and indeed there are data supporting this proposal. Postganglionic nerves are cholinergic, and their product, acetylcholine, can influence islet β-cells through actions on M3 muscarinic receptors which are coupled to Gq type G-proteins. In addition, the neurons secrete several peptide hormones that act on β-cell receptors. The data supporting synchronization via intrapancreatic ganglia are, however, limited. In particular, it has not been shown that trains of muscarinic pulses are effective at synchronizing islets in vitro. Also, if as has been suggested, there is a ganglionic pacemaker driving islets to a preferred frequency, no neural circuitry for this pacemaker has been identified. In this study, both points are addressed using a microfluidic system that allows for the pulsed application of the muscarinic agonist carbachol. We find that murine islets are entrained and synchronized over a wide range of frequencies when the carbachol pulsing is periodic, adding support to the hypothesis that ganglia can synchronize islets in vivo. We also find that islet synchronization is very effective even if the carbachol pulses are applied at random times. This suggests that a neural pacemaker is not needed; all that is required is that islets receive occasional coordinated input from postganglionic neurons. The endogenous rhythmic activity of the islets then sets the frequency of the islet population rhythm, while the input from ganglia acts only to keep the islet oscillators in phase.


Conflict of interest statement

The authors have declared that no competing interests exist.

Figures
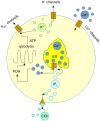
Fig 1
Fig 1. Diagram of the Integrated Oscillator Model (IOM).
PDH: pyruvate dehydrogenase, IP3: inositol-1,4,5-trisphosphate, ER: endoplasmic reticulum. A representative view of the modified IOM model in which a key point is that intracellular Ca2+ acts on metabolism through activation of PDH. In this modified version of the IOM, external CCh pulses generate intracellular pulses of IP3.
Fig 2
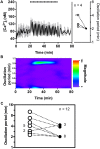
Fig 2. Effect of CCh pulses with rest time of R = 2 min on [Ca2+]i oscillations.
(A) The [Ca2+]i traces (gray lines) of four islets and their average (black line) are shown when CCh pulses with rest durations of R = 2 min were applied. The timing of the CCh pulses is shown by the “x” at the top of the figure. The inset shows all four islets had a natural oscillation period between 2 and 4 min (open circles) prior to CCh pulsing, which changed to 2 min upon pulsing (filled circles) indicating 1:1 entrainment. (B) The spectrogram of the average [Ca2+]i from the 4 islets in (A) is shown. As can be seen, while there was no major oscillation period prior to pulsing, a strong band appeared during the 38 min that CCh was applied showing synchronicity by the group at an oscillation period of 2 min. The band at the bottom of the spectrogram at the beginning of the pulsing is an artifact from the data analysis. See S6 and S7 Figs for results from the remaining R = 2 min groups. (C) The oscillation periods of all 12 islets tested are shown prior to (open circles), and during R = 2 min CCh pulsing (filled circles).
Fig 3
Fig 3. Effect of CCh pulses with rest time of R = 5 min on [Ca2+]i oscillations.
(A) The individual [Ca2+]i from all 4 islets are shown in gray and their average is shown in black. The timing of the CCh pulses is shown by the “x”. The inset shows the natural period of these 4 islets ranged from 3.4–6.8 min (open circle), but all converged to 5 min during pulsing (filled circle) indicating 1:1 entrainment. (B) The synchronized response of the group is evident by the emergence of a pronounced band at an oscillation period of 5 min during the 55 min time that CCh was applied. See S8 and S9 Figs for results from the remaining R = 5 min groups. (C) The oscillation periods of all 12 islets tested with the R = 5 min pulse profile before (open circles) and during CCh pulsing (filled circles) are summarized.
Fig 4
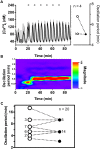
Fig 4. Effect of CCh pulses with rest time of R = 10 min on [Ca2+]i oscillations.
(A) In this example, all four islets had a natural period, as seen in the inset, between 5.1–6.8 min (open circles) which entrained to 5 min (1:2) during the pulsing period (filled circle). The number of islets with identical oscillation periods before or during pulsing is indicated adjacent to the relevant circle. (B) The synchronized response of the group is evident by the emergence of a pronounced band at 5 min during the CCh pulsing. After the final pulse, 5 min oscillations persisted until the end of the Ca2+ measurement. See S10–S13 Figs for results from the remaining R = 10 min groups. (C) A compilation of the oscillation periods of all 20 islets tested prior to (open circles) and during pulsing (filled circle) with R = 10 min is shown.
Fig 5
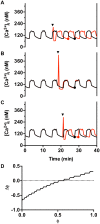
Fig 5. Phase responses of a model islet oscillator to a single pulse of IP3.
Unperturbed model islet oscillations are shown in black. The red trace shows the model islet perturbed with a single 10 sec IP3 pulse applied at 20 min. (A) When applied during a burst active phase the IP3 pulse terminates the burst and there is an advance in the timing of the next active pase. (B) When applied early in a silent phase there is little effect on the phase of the islet oscillator. (C) When applied late in a silent phase there is a delay in the next burst. (D) A phase response curve showing the effect of an IP3 pulse on the phase of the islet oscillator. Phase 0 is the beginning of a burst active phase, while phase 1 is the end of the subsequent silent phase. The abscissa shows the phase at which the stimulus was applied, while the ordinate shows the effect the perturbation has on the phase as determined by the difference in timing of the unperturbed nadir (black circle in panels above) and the perturbed nadir (red circle). A negative phase difference means a phase advance, while a positive difference means a phase delay.
Fig 6
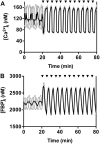
Fig 6. Model islets are synchronized by exposure to IP3 pulses with rest period R = 5 min.
The time courses of the three model islets are in gray, and the mean is in black. An IP3 pulse is applied at each arrow. (A) Ca2+ traces quickly synchronize when IP3 stimulation begins. (B) The glycolytic metabolite FBP also synchronizes.
Fig 7
Fig 7. Synchronization of islets and model islets by randomly-spaced CCh pulses.
A. The Ca2+ traces (gray lines) from a representative experiment with a set of 4 islets are overlaid with the average [Ca2+]i (black line). The timing of the CCh pulses are shown by an “x” above the figure. B. Although randomly spaced, the repeated CCh pulses produced a synchronized population as can be seen from the emergence of a coherent band in the spectrogram. Synchronization decreased shortly after the final pulse at 79 min. See S14 and S15 Figs for the remaining two groups of islets stimulated with randomly timed pulses of CCh. C. Four model islets (grey lines) are stimulated by an identical pattern of IP3 pulses “▼” as the experiment shown in A. The resulting average (black line) demonstrates a synchronized population for the entire pulsing duration.

References

    1. Inuwa IM, El Mardi AS. Correlation between volume fraction and volume-weighted mean volume, and between total number and total mass of islets in post-weaning and young Wistar rats. J Anat. Wiley/Blackwell (10.1111); 2005;206: 185–192. 10.1111/j.1469-7580.2005.00367.x - DOI - PMC - PubMed
    1. Ionescu-Tirgoviste C, Gagniuc PA, Gubceac E, Mardare L, Popescu I, Dima S, et al. A 3D map of the islet routes throughout the healthy human pancreas. Sci Rep. Nature Publishing Group; 2015;5: 14634 10.1038/srep14634 - DOI - PMC - PubMed
    1. Saltiel AR, Kahn CR. Insulin signalling and the regulation of glucose and lipid metabolism [Internet]. Nature. 2001. pp. 799–806. 10.1038/414799a - DOI - PubMed
    1. Ashcroft FM, Harrison DE, Ashcroft SJH. Glucose induces closure of single potassium channels in isolated rat pancreatic β-cells. Nature. Nature Publishing Group; 1984;312: 446–448. 10.1038/312446a0 - DOI - PubMed
    1. Gilon P, Ravier MA, Jonas J, Henquin JC. Control mechanisms of the oscillations of insulin secretion in vitro and in vivo. Diabetes. American Diabetes Association; 2002;51 Suppl 1: S144–51. 10.2337/diabetes.51.2007.S144 - DOI - PubMed

Publication types