. 2019 Feb 5;26(6):1544-1556.e8.
doi: 10.1016/j.celrep.2019.01.043.

A Genome-wide Haploid Genetic Screen Identifies Regulators of Glutathione Abundance and Ferroptosis Sensitivity

Affiliations

A Genome-wide Haploid Genetic Screen Identifies Regulators of Glutathione Abundance and Ferroptosis Sensitivity

Jennifer Yinuo Cao et al. Cell Rep. .

Abstract

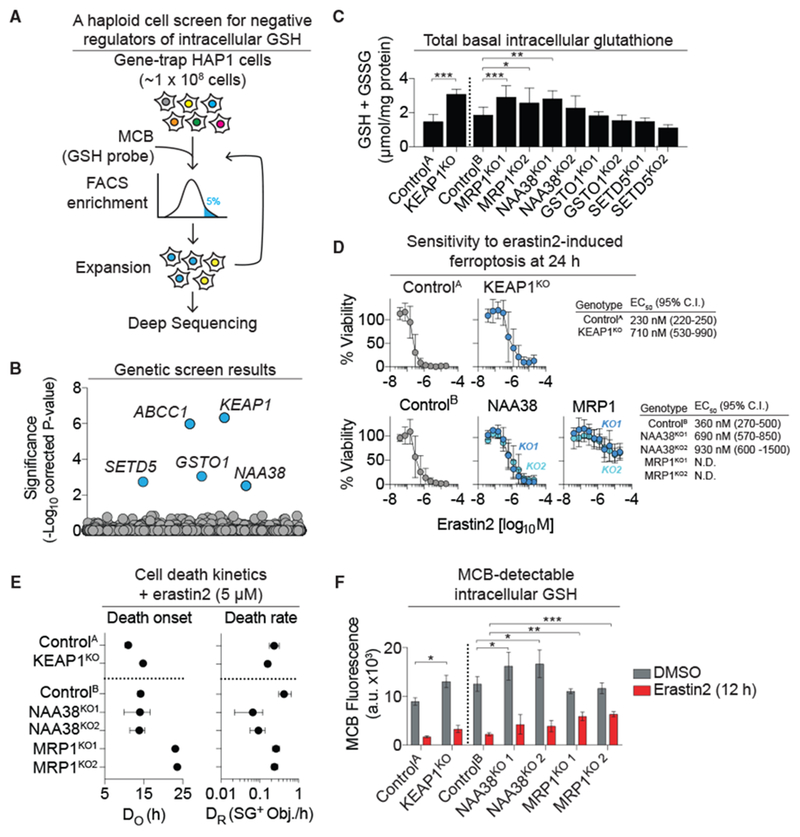
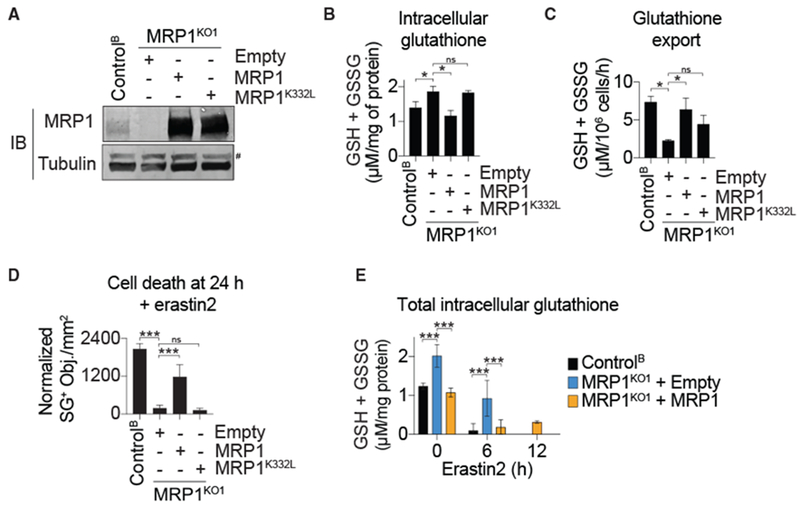
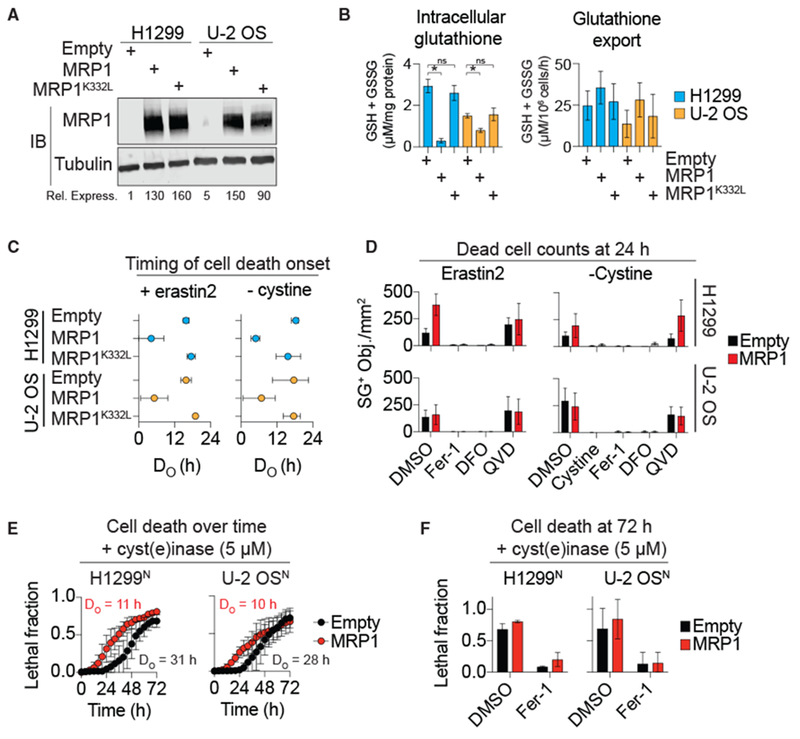
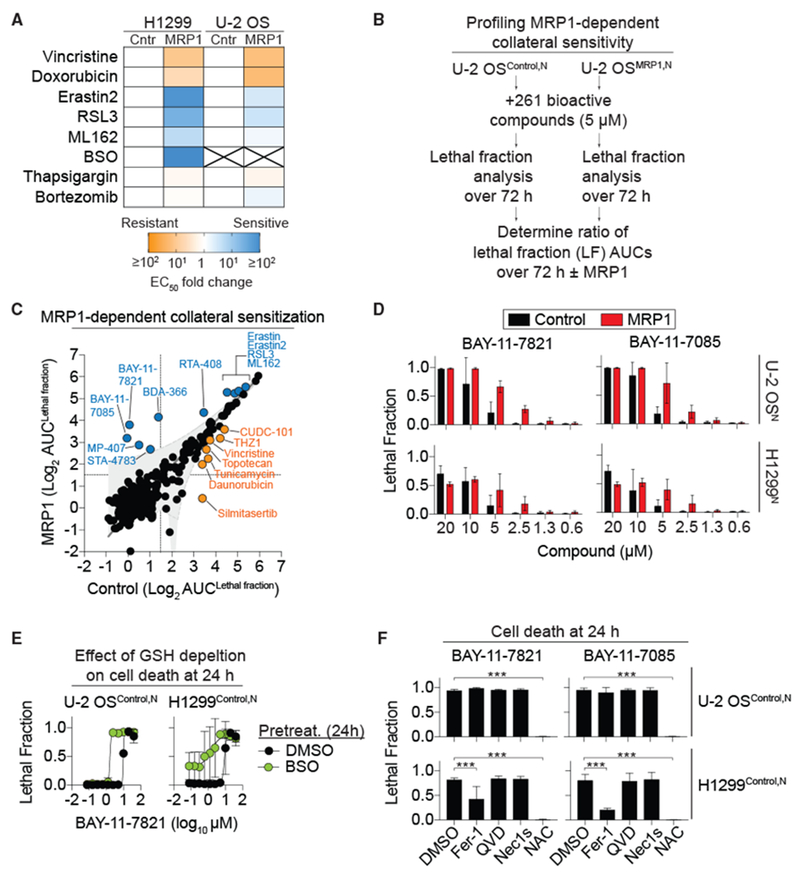
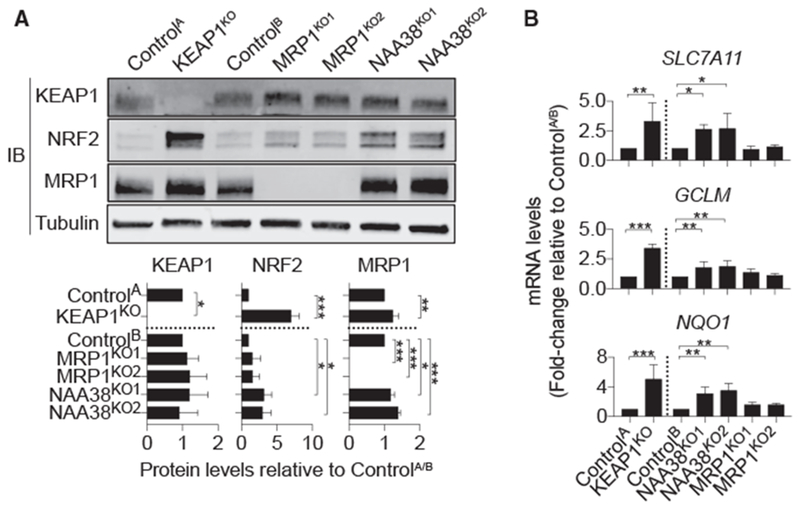
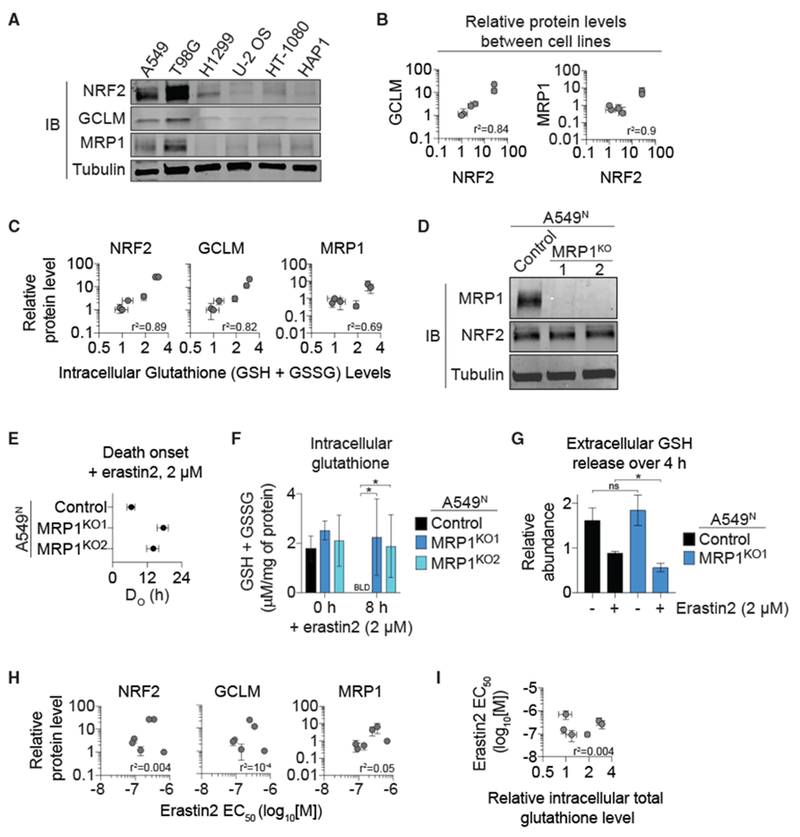
The tripeptide glutathione suppresses the iron-dependent, non-apoptotic cell death process of ferroptosis. How glutathione abundance is regulated in the cell and how this regulation alters ferroptosis sensitivity is poorly understood. Using genome-wide human haploid genetic screening technology coupled to fluorescence-activated cell sorting (FACS), we directly identify genes that regulate intracellular glutathione abundance and characterize their role in ferroptosis regulation. Disruption of the ATP binding cassette (ABC)-family transporter multidrug resistance protein 1 (MRP1) prevents glutathione efflux from the cell and strongly inhibits ferroptosis. High levels of MRP1 expression decrease sensitivity to certain pro-apoptotic chemotherapeutic drugs, while collaterally sensitizing to all tested pro-ferroptotic agents. By contrast, disruption of KEAP1 and NAA38, leading to the stabilization of the transcription factor NRF2, increases glutathione levels but only weakly protects from ferroptosis. This is due in part to concomitant NRF2-mediated upregulation of MRP1. These results pinpoint glutathione efflux as an unanticipated regulator of ferroptosis sensitivity.

Keywords: ROS; cancer; collateral sensitivity; ferroptosis; glutathione; iron; metabolite efflux; multidrug resistance; necrosis.


Figures

Figure 1.
Figure 1.. A Genetic Screen Identifies Negative Regulators of Intracellular GSH Abundance
(A) Overview of the human haploid cell genetic screen for negative regulators of intracellular reduced glutathione (GSH). MCB, monochlorobimane. (B) Gene-level enrichment summary plot for the screen in (A). (C) Total basal intracellular glutathione levels determined using Ellman’s reagent in unmodified (ControlA/B) and CRISPR-Cas9 gene-disrupted (KO) HAP1 cell lines. (D) Erastin2 potency determined using PrestoBlue. Cell viability is normalized to DMSO-treated controls (100%). N.D., not determinable. (E) Population cell death kinetics determined from the analysis of dead cell counts (SYTOX Green positive [SG+] objects) over time followed by curve fitting and parameter value extraction. DO, death onset; DR, maximal death rate. (F) MCB-detectable GSH levels ± erastin2 (5 μM) determined by flow cytometry. Data in (C)–(F) were from three independent experiments and represent means ± SDs (C and F) or means ± 95% confidence intervals (D and E). In (C) and (F), data were analyzed using one-way ANOVA, with *p < 0.05, **p < 0.01, and ***p < 0.001.
Figure 2.
Figure 2.. MRP1 Expression Regulates Basal Glutathione Levels and Ferroptosis Sensitivity
(A) MRP1 protein levels in HAP1 Control and MRP1KO cells stably complemented with wild-type MRP1, the glutathione-export defective MRP1K332L mutant, or empty vector control (Empty). #, non-specific band. (B) Total intracellular glutathione determined using Ellman’s reagent. (C) DPBS-stimulated glutathione export measured using Ellman’s reagent. (D) Dead cell (SG+) counts following erastin2 treatment (5 μM). (E) Intracellular glutathione over time following the addition of erastin2 (5 μM). Data in (B)–(E) represent means ± SDs from three independent experiments. Data were analyzed using one-way ANOVA, with *p < 0.05 and ***p < 0.001; ns, not significant.
Figure 3.
Figure 3.. MRP1 Overexpression Sensitizes to Ferroptosis
(A) MRP1 protein levels in H1299 or U-2 OS cells stably overexpressing empty vector control (Empty), wild-type MRP1, or MRP1 K332L. Rel. Express., quantification of the relative expression level of MRP1, normalized to tubulin. MRP1 levels in H1299 Empty cells set equal to 1. (B) Total intracellular glutathione and DPBS-stimulated glutathione export determined using Ellman’s reagent. Data were analyzed using a one-way ANOVA with *p < 0.05; ns, not significant. (C) The timing of population cell death onset (DO) determined by counting SYTOX Green+ dead cells over time followed by curve fitting and parameter value extraction. Data represent means ± 95% confidence intervals. (D) SYTOX Green+ dead cells with erastin2 (5 μM) or cystine-free medium ± ferrostatin-1 (Fer-1,2 μM), deferoxamine (DFO) (100 μM), Q-VD-OPh (QVD, 25 μM), or cystine (200 μM). (E) Population cell death (lethal fraction) over time determined using the STACK method. (F) Population cell death at 72 h determined using STACK. Fer-1 (2 μM). Data in (B) and (D)–(F) represent means ± SDs for three independent experiments.
Figure 4.
Figure 4.. MRP1 Expression Collaterally Sensitizes to Ferroptosis
(A) Summary of lethal compound EC50 fold changes for control (Cntr) and MRP1-overexpressing (MRP1) cells. X, EC50 values could not be computed. See also Table 1. (B) Outline of the collateral sensitivity profiling experiment in Control and MRP1-overexpressing cells in response to 261 bioactive compounds using STACK. (C) Results of the comparative analysis of cell death ± MRP1. Each dot represents a single compound. MRP1 overexpression had no effect (black), reduced sensitivity (yellow), or increased sensitivity (blue) to compound-induced cell death. (D) Cell death at 48 h in Control and MRP1-overexpressing cells determined using STACK. (E) BAY-11-7821-induced cell death determined using STACK ± buthionine sulfoximine (BSO) pretreatment (200 μM, 24 h). (F) Cell death determined using STACK. Conditions were: BAY-11-7821 or BAY-11-7085 (both 20 μM) ± Fer-1 (2 μM), Q-VD-OPh (25 μM), Nec-1 s (1 μM), or N-acetylcysteine (NAC, 1 mM). Data were analyzed by one-way ANOVA with ***p < 0.001. Data in (D)–(F) represent means ± SDs for three independent experiments.
Figure 5.
Figure 5.. Deletion of KEAP1 and NAA38 Stabilize NRF2 and Activate the NRF2 Pathway While Deletion of MRP1 Does Not
(A) Kelch-like ECH associated protein 1 (KEAP1), MRP1, and NRF2 protein levels in HAP1 Control and gene-disrupted cells. Quantification (mean intensity ± SD) is from three independent blots. (B) Relative expression of NRF2 target genes in control and gene-disrupted cell lines. Data are means ± SDs from three independent experiments. Data were analyzed using one-way ANOVA, with *p < 0.05 and ***p < 0.001; ns = not significant.
Figure 6.
Figure 6.. NRF2 and MRP1 Regulate Intracellular Glutathione Levels and Ferroptosis Sensitivity in Distinct Ways
(A) NRF2, GCLM, and MRP1 protein levels in six cancer cell lines of diverse tissue origin. (B) Pearson correlation of NRF2 protein levels to GCLM and MRP1 protein levels in the cell lines from (A). Protein expression was determined from three independent experiments and the levels of each protein normalized to those observed in HAP1 cells, which was set equal to 1. (C) Pearson correlation of NRF2, GCLM, and MRP1 protein expression to intracellular glutathione levels in these cell lines. (D) Immunoblotting of lysates from A549N Control and MRP1KO1/2 cells using antibodies against MRP1, NRF2, and α-tubulin. (E) The timing of population cell death onset (DO) determined in A549N Control and MRP1KO1/2 cells using STACK. (F) Intracellular glutathione levels determined using Ellman’s reagent. BLD, below the limit of detection. (G) Extracellular GSH release determined by stable isotope tracing and mass spectrometry. (H) Pearson correlation between NRF2, GCLM, or MRP1 protein levels and erastin2 potency in the six cell lines from (A). (I) Pearson correlation between erastin2 potency and intracellular glutathione levels in the six cell lines from (A). Data are means ± 95% confidence intervals (B, C, E, H, and I) or means ± SDs (F and G) from three independent experiments. Data in (F) and (G) were analyzed using one-way ANOVA, with *p < 0.05; ns, not significant.

References

    1. Aksnes H, Hole K, and Arnesen T (2015). Molecular, cellular, and physiological significance of N-terminal acetylation. Int. Rev. Cell Mol. Biol 316, 267–305. - PubMed
    1. Beadle GW, and Tatum EL (1941). Genetic Control of Biochemical Reactions in Neurospora. Proc. Natl. Acad. Sci. USA 27, 499–506. - PMC - PubMed
    1. Carette JE, Guimaraes CP, Wuethrich I, Blomen VA, Varadarajan M, Sun C, Bell G, Yuan B, Muellner MK, Nijman SM, et al. (2011a). Global gene disruption in human cells to assign genes to phenotypes by deep sequencing. Nat. Biotechnol 29, 542–546. - PMC - PubMed
    1. Carette JE, Raaben M, Wong AC, Herbert AS, Obernosterer G, Mulherkar N, Kuehne AI, Kranzusch PJ, Griffin AM, Ruthel G, et al. (2011b). Ebola virus entry requires the cholesterol transporter Niemann-Pick C1. Nature 477, 340–343. - PMC - PubMed
    1. Chang L-C, Chiang S-K, Chen S-E, Yu Y-L, Chou R-H, and Chang W-C (2018). Heme oxygenase-1 mediates BAY 11-7085 induced ferroptosis. Cancer Lett. 416, 124–137. - PubMed

Publication types

MeSH terms

Substances