. 2019;142(2):147-158.
doi: 10.1159/000497117. Epub 2019 Feb 6.

Low Sodium Diet Decreases Stone Formation in Genetic Hypercalciuric Stone-Forming Rats

Affiliations

Low Sodium Diet Decreases Stone Formation in Genetic Hypercalciuric Stone-Forming Rats

Nancy S Krieger et al. Nephron. 2019.

Abstract

Background: Urine (u) calcium (Ca) excretion is directly dependent on dietary sodium (Na) intake leading to the recommendation for Na restriction in hypercalciuric kidney stone formers. However, there is no direct evidence that limiting Na intake will reduce recurrent stone formation.

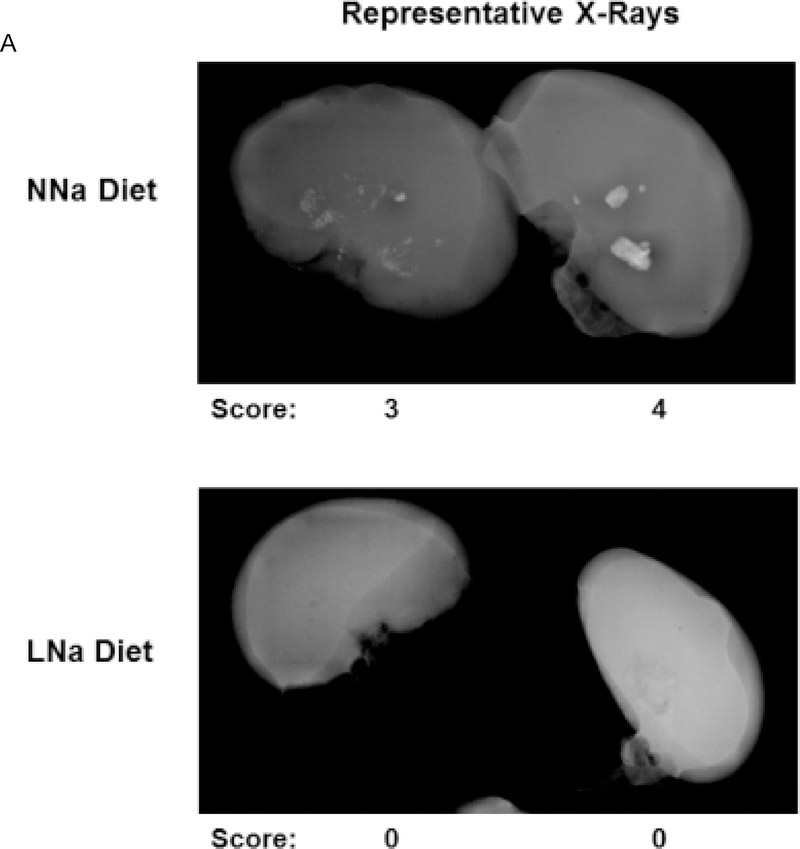
Materials and methods: We used genetic hypercalciuric stone-forming (GHS) rats, which universally form Ca phosphate (P) kidney stones, fed either a low Na (LNa, 0.05%) or normal Na (NNa, 0.4%) Na diet (D) for 18 weeks. Urine was collected at 6-week intervals. Radiographic analysis for stone formation and bone analyses were done at the conclusion of the study.

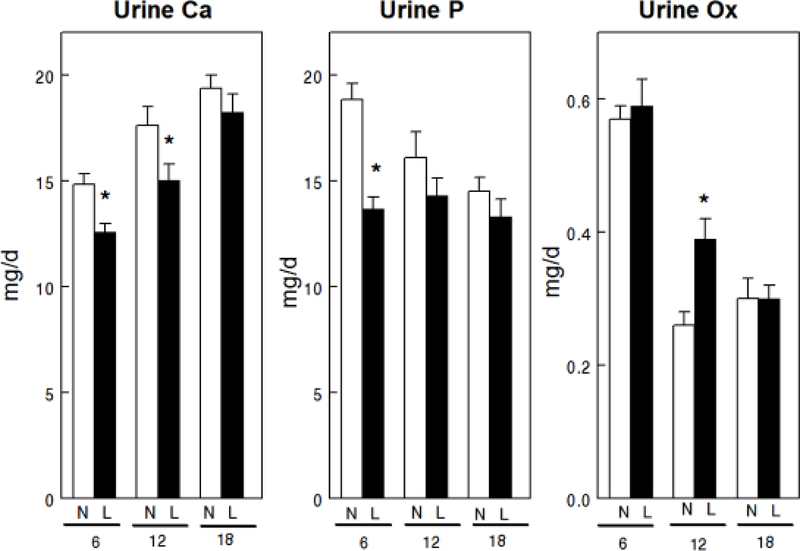
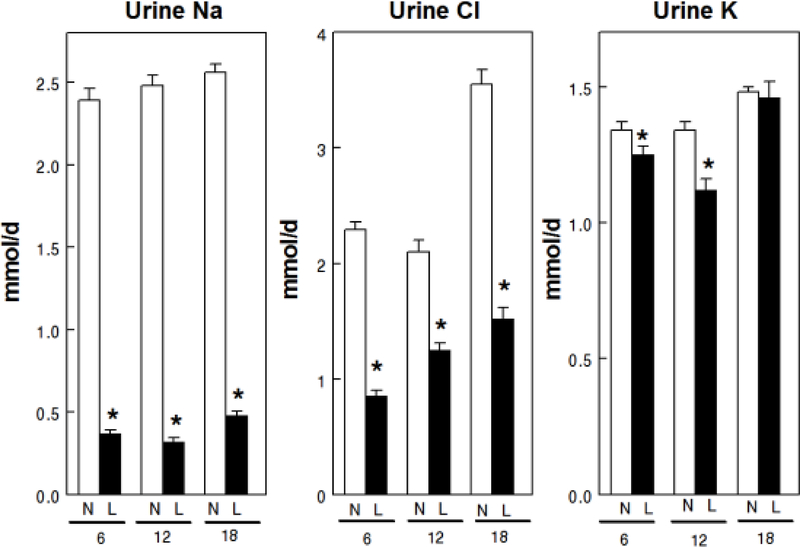
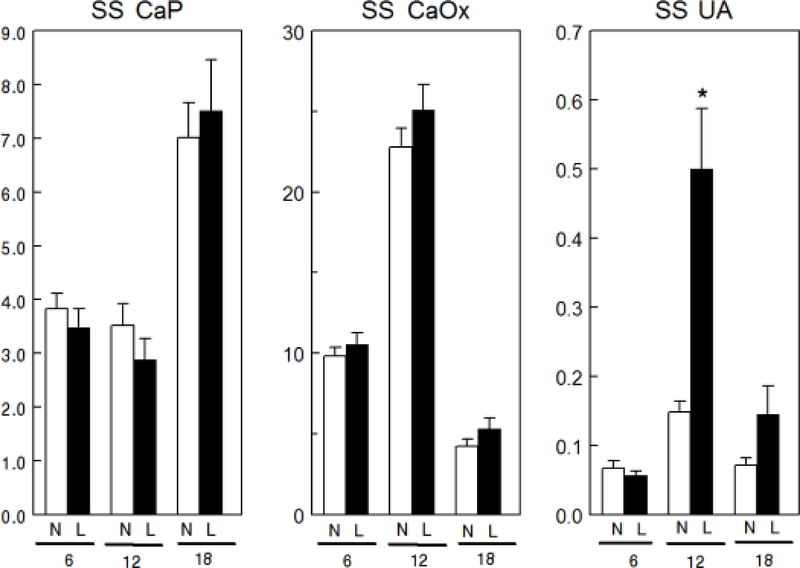
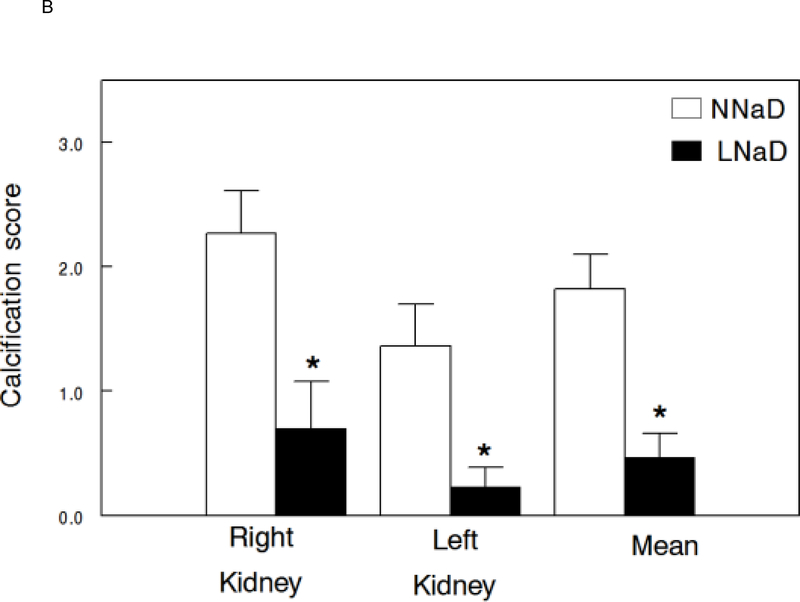
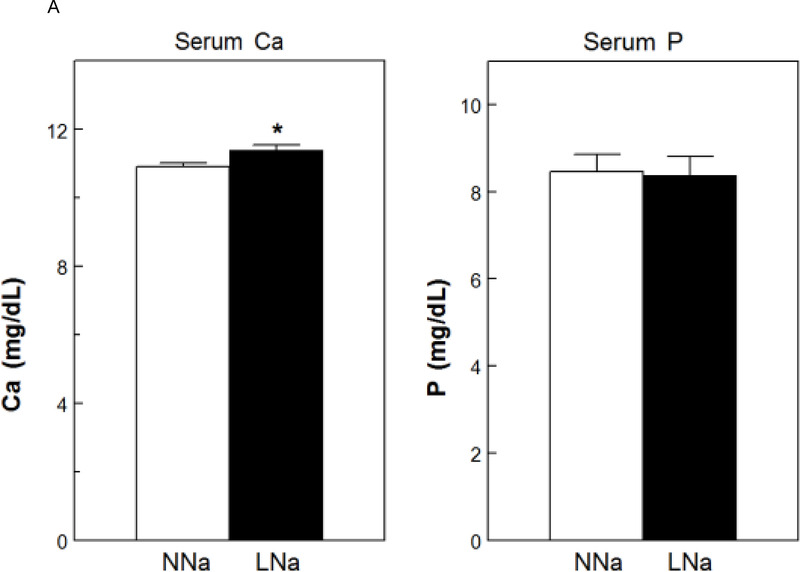
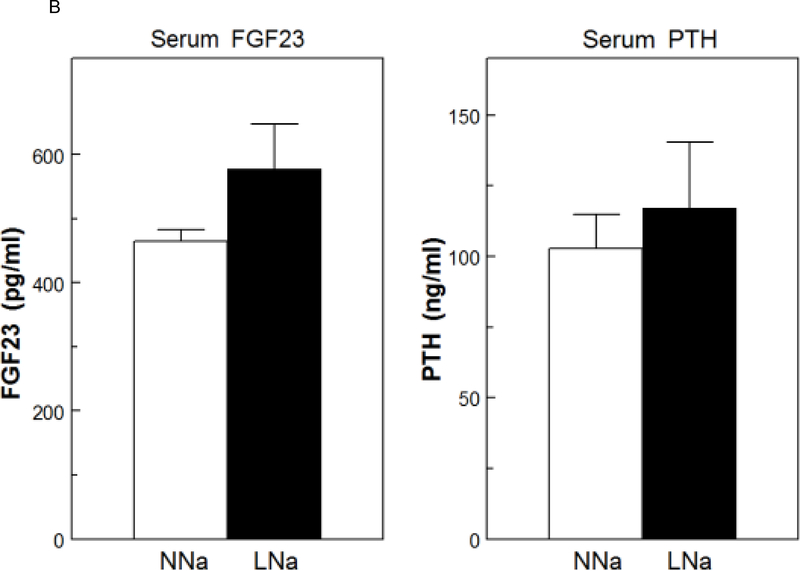
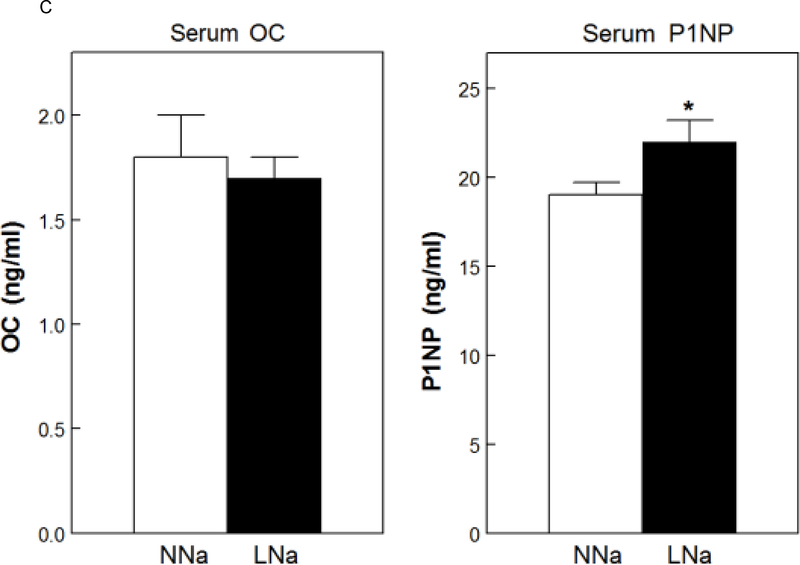
Results: Mean uCa was lower with LNaD than NNaD as was uP and LNaD decreased mean uNa and uChloride. There were no differences in urine supersaturation (SS) with respect to calcium phosphate (CaP) or Ca oxalate (CaOx). However, stone formation was markedly decreased with LNaD by radiographic analysis. The LNaD group had significantly lower femoral anterior-posterior diameter and volumetric bone mineral density (vBMD), but no change in vertebral trabecular vBMD. There were no differences in the bone formation rate or osteoclastic bone resorption between groups. The LNaD group had significantly lower femoral stiffness; however, the ultimate load and energy to fail was not different.

Conclusion: Thus, a low Na diet reduced uCa and stone formation in GHS rats, even though SS with respect to CaP and CaOx was unchanged and effects on bone were modest. These data, if confirmed in humans, support dietary Na restriction to prevent recurrent Ca nephrolithiasis.

Keywords: Mineral metabolism; Nephrolithiasis; Sodium.


Conflict of interest statement

DISCLOSURE STATEMENT

The authors have no competing financial interests and nothing to disclose.

Figures

Figure 1.
Figure 1.
Urine calcium (Ca), phosphorus (P) and oxalate (Ox) excretion for GHS rats fed a normal (N) or low (L) sodium (Na) diet. Urine was collected for four 24h periods at 6, 12 and 18 weeks from GHS rats to determine solute levels as described in the Concise Methods. Values are mean ± SE for 11 rats in each group. *p<0.05 for L compared to N at the same time period.
Figure 2.
Figure 2.
Urine sodium (Na), chloride (Cl) and potassium (K) excretion for GHS rats fed a normal (N) or low (L) sodium (Na) diet. Urine was collected for four 24h periods at 6, 12 and 18 weeks from GHS rats to determine solute levels as described in the Concise Methods. Values are mean ± SE for 11 rats in each group. *p<0.05 for L compared to N at the same time period.
Figure 3.
Figure 3.
Urine supersaturation (SS) for calcium phosphate (CaP), calcium oxalate (CaOx) and uric acid (UA) for GHS rats fed a normal (N) or low (L) sodium (Na) diet. Urine was collected for four 24h periods at 6, 12 and 18 weeks to determine solute levels that were used to calculate relative supersaturation as described in the Concise Methods. Values for relative supersaturation are mean ± SE (n=11) and are unitless. *p<0.05 for L compared to N at the same time period.
Figure 4.
Figure 4.
Kidney stone formation at the conclusion of the 18 week study. At the end of the 18 week study, the extent of kidney stone formation was determined by blinded three observers as described in the Concise Methods. A) Representative radiographs of kidneys on a normal Na diet (NNaD) or a low Na diet (LNaD). Calcification scores are provided as a reference. B) Quantitation of stone formation and calcification in all GHS rats fed a NNaD or a LNaD. Values are mean ± SEM (n=11). *p<0.05 for LNaD compared to NNaD.
Figure 4.
Figure 4.
Kidney stone formation at the conclusion of the 18 week study. At the end of the 18 week study, the extent of kidney stone formation was determined by blinded three observers as described in the Concise Methods. A) Representative radiographs of kidneys on a normal Na diet (NNaD) or a low Na diet (LNaD). Calcification scores are provided as a reference. B) Quantitation of stone formation and calcification in all GHS rats fed a NNaD or a LNaD. Values are mean ± SEM (n=11). *p<0.05 for LNaD compared to NNaD.
Figure 5.
Figure 5.
Serum calcium (Ca), phosphorus (P), fibroblast growth factor 23 (FGF23), parathyroid hormone (PTH), osteocalcin (OC) and amino terminal propeptide of type 1 collagen (P1NP) at the conclusion of the 18 week study. Serum levels were determined as described in the Concise Methods. A) Serum Ca and P on normal Na diet (NNaD) compared to low Na diet (LNaD); B) Serum FGF23 and PTH on NNaD compared to LNaD; C) Serum OC and P1NP on NNaD compared to LNaD. Values are mean ± SEM (n=11). *p<0.05 for LNaD compared to NNaD.
Figure 5.
Figure 5.
Serum calcium (Ca), phosphorus (P), fibroblast growth factor 23 (FGF23), parathyroid hormone (PTH), osteocalcin (OC) and amino terminal propeptide of type 1 collagen (P1NP) at the conclusion of the 18 week study. Serum levels were determined as described in the Concise Methods. A) Serum Ca and P on normal Na diet (NNaD) compared to low Na diet (LNaD); B) Serum FGF23 and PTH on NNaD compared to LNaD; C) Serum OC and P1NP on NNaD compared to LNaD. Values are mean ± SEM (n=11). *p<0.05 for LNaD compared to NNaD.

Comment in

References

    1. Bushinsky DA, Coe FL, Moe OW: Nephrolithiasis; in Brenner BM (ed): The Kidney. Philadelphia, W.B. Saunders, 2012, vol 2, pp 1455–1507.
    1. Bose A, Monk RD, Bushinsky DA: Kidney stones; in Melmed S, Polonsky KS, Larsen PR, Kronenberg HM (eds): Williams Textbook of Endocrinology. Philadelphia, Elsevier, 2016, pp 1365–1384.
    1. Stechman MJ, Loh NY, Thakker RV: Genetics of hypercalciuric nephrolithiasis: renal stone disease. Ann NY Acad Sci 2007;1116:461–484. - PubMed
    1. Moe OW, Bushinsky DA: Genetic Hypercalciuria: A Major Risk Factor in Kidney Stones; in Thakker RV, Whyte MP, Eisman JA, Igarashi T (eds): Genetics of Bone Biology and Skeletal Disease. London, UK, Elsevier, 2013, pp 585–604.
    1. Monico CG, Milliner DS: Genetic determinants of urolithiasis. Nat Rev Nephrol 2012;8:151–162. - PMC - PubMed

Publication types

Substances