. 2019 Feb 6;20(1):112.
doi: 10.1186/s12864-019-5427-5.

Genetic and transcriptomic dissection of the fiber length trait from a cotton (Gossypium hirsutum L.) MAGIC population

Affiliations

Genetic and transcriptomic dissection of the fiber length trait from a cotton (Gossypium hirsutum L.) MAGIC population

Marina Naoumkina et al. BMC Genomics. .

Abstract

Background: Improving cotton fiber length without reducing yield is one of the major goals of cotton breeding. However, genetic improvement of cotton fiber length by breeding has been a challenge due to the narrow genetic diversity of modern cotton cultivars and negative correlations between fiber quality and yield traits. A multi-parent advanced generation inter-cross (MAGIC) population developed through random mating provides an excellent genetic resource that allows quantitative trait loci (QTL) and causal genes to be identified.

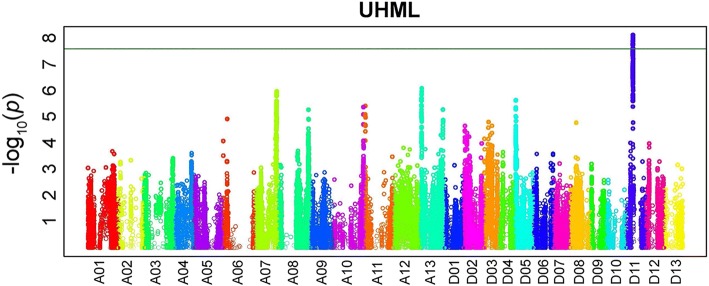
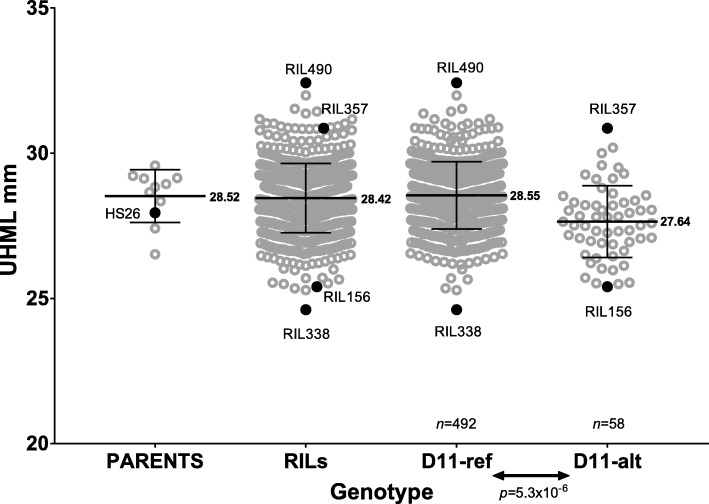
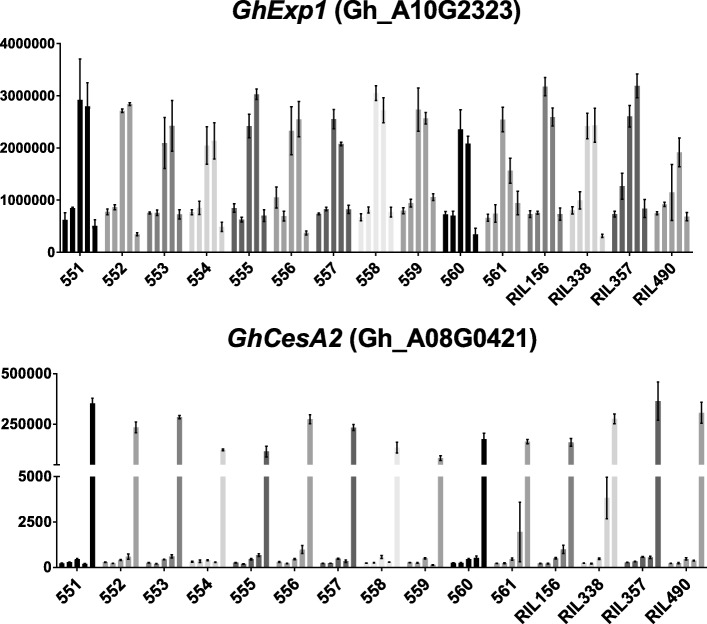
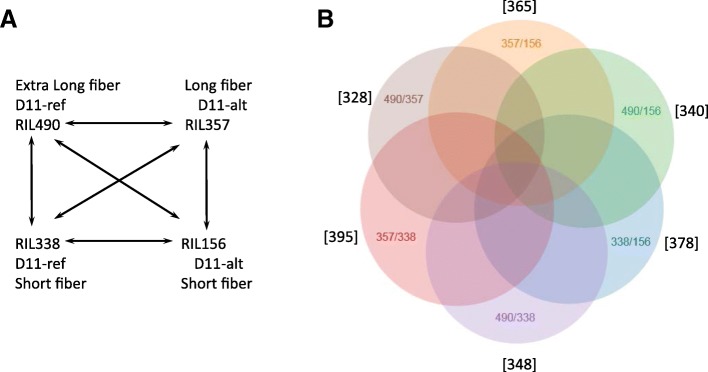
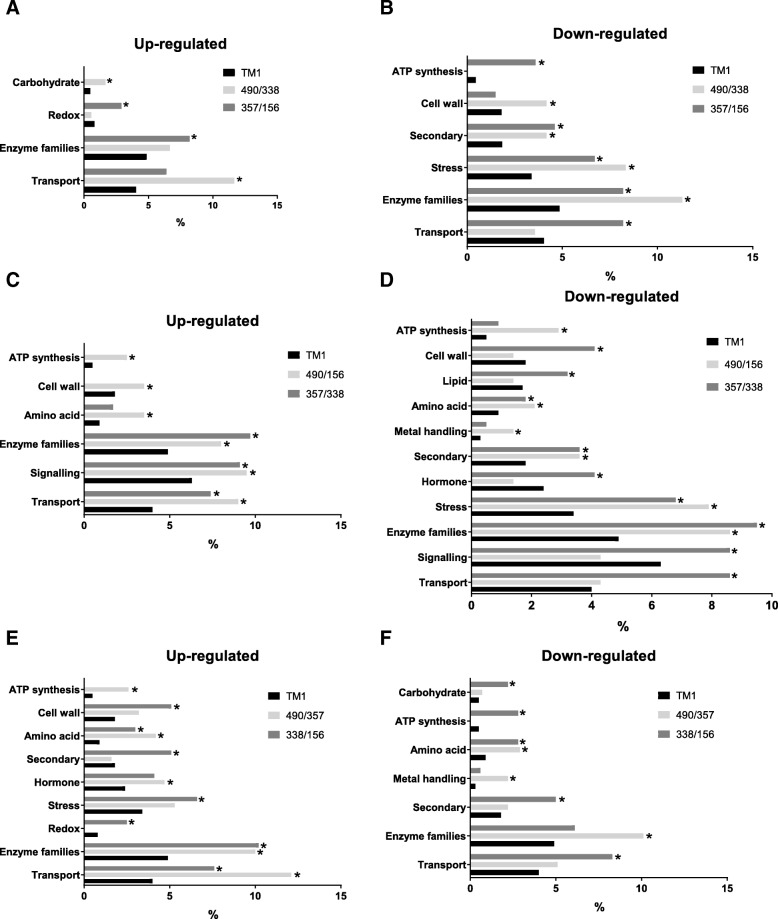
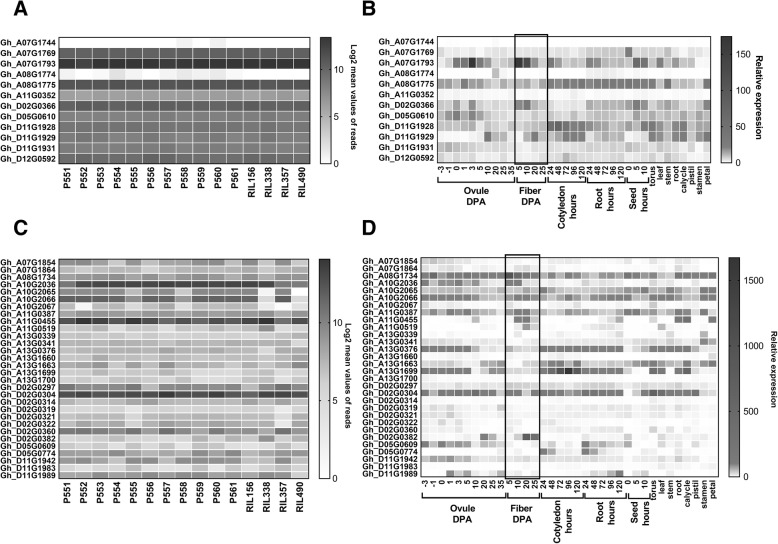
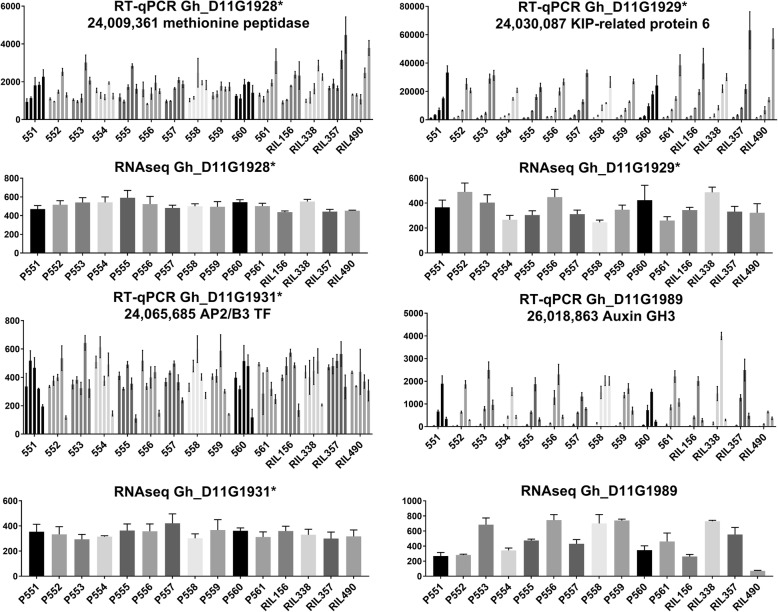
Results: An Upland cotton MAGIC population, consisting of 550 recombinant inbred lines (RILs) derived from eleven different cultivars, was used to identify fiber length QTLs and potential genes that contribute to longer fibers. A genome wide association study (GWAS) identified a cluster of single nucleotide polymorphisms (SNPs) on chromosome (Chr.) D11 that is significantly associated with fiber length. Further evaluation of the Chr. D11 genomic region among lines of the MAGIC population detected that 90% of RILs have a D11 haplotype similar to the reference TM-1 genome (D11-ref), whereas 10% of RILs inherited an alternative haplotype from one of the parents (D11-alt). The average length of fibers of D11-alt RILs was significantly shorter compared to D11-ref RILs, suggesting that alleles in the D11-alt haplotype contributed to the inferior fiber quality. RNAseq analysis of the longest and shortest fiber length RILs from D11-ref and D11-alt populations identified 949 significantly differentially expressed genes (DEGs). Gene set enrichment analysis revealed that different functional categories of genes were over-represented during fiber elongation between the four selected RILs. We found 12 genes possessing non-synonymous SNPs (nsSNPs) significantly associated with the fiber length, and three that were highly significant and were clustered at D11:24-Mb, including D11G1928, D11G1929 and D11G1931.

Conclusion: The results of this study provide insights into molecular aspects of genetic variation in fiber length and suggests candidate genes for genetic manipulation for cotton improvement.

Keywords: Cotton; Fiber length; Genome-wide association study; Multi-parent advanced generation inter cross; Quantitative trait loci; RNAseq; Single nucleotide polymorphism.


Conflict of interest statement

Ethics approval and consent to participate

Not applicable.

Consent for publication

Not applicable.

Competing interests

The authors declare that they have no competing interests.

Publisher’s Note

Springer Nature remains neutral with regard to jurisdictional claims in published maps and institutional affiliations.

Figures

Fig. 1
Fig. 1
Manhattan plot for fiber length QTLs. UHML is Upper Half Mean Length. The negative log10 transformed p values were plotted against the marker positions of the physical map of each of the 26 chromosomes of G. hirsutum TM1. The significant threshold (−log10(p) > 7.6) is indicated by a green line
Fig. 2
Fig. 2
Phenotypic differences in fiber length between MAGIC subpopulations of RILs possessing D11-ref and D11-alt haplotypes. UHML is Upper Half Mean Length. Black lines indicate mean values of fiber length with numerical value at right. Error bars are standard deviation within tested populations. Significant difference in fiber length between D11-ref and D11-alt MAGIC populations was detected by a parametric (two-tailed) t-test. Grey circles represent normalized fiber length for each individual RIL measured at twelve different environments [–26]; black dots represent the parent (HS26) that contributed the D11-alt haplotype and the longest and shortest RILs from both populations which were selected for RNAseq analysis
Fig. 3
Fig. 3
Preliminary RT-qPCR analysis of developing fibers of selected RILs and parents. Vertical axis represents relative gene expression normalized by 18S rRNA. Different shade bars represent fiber developmental time points in increasing order of 3, 5, 8, 12 and 16 DPA. Parental lines are listed in increasing number 551 to 561, their names are provided in Table 1. NBI G. hirsutum TM-1 genome gene numbers are shown in parentheses for each gene. Error bars indicate the standard deviation from three biological replicates
Fig. 4
Fig. 4
Differential gene expression analysis. a Design of comparisons between selected RILs. b Venn diagram of significantly regulated genes between RILs
Fig. 5
Fig. 5
Gene set enrichment analysis of DEGs in longest and shortest fiber RILs carrying different D11 haplotypes. MapMan ontology was used for functional characterization of DEGs; only significantly (p < 0.05; asterisks) over-represented categories are shown. Up-regulated (a, c, e) and down-regulated (b, d, f) gene families in comparisons between RILs 490/338, 357/156, 490/156, 357/338, 338/156 and 490/357. Relative gene frequencies in functional categories are presented in percent from amount of up-regulated or down-regulated genes; background represents the NBI G. hirsutum TM-1 reference genome
Fig. 6
Fig. 6
Heat maps of gene expression. Expression patterns of genes carrying non-synonymous SNPs associated with fiber length in MAGIC parents and four RILs at the 8 DPA fiber development stage (a) and in different cotton tissues (b). Expression patterns of DEGs near fiber length QTLs length in MAGIC parents and four RILs at 8 DPA (c) and in different cotton tissues (d). Expression data for different cotton tissues were obtained from ccNET database (http://structuralbiology.cau.edu.cn/gossypium/). Fiber developmental tissues were marked with a rectangle
Fig. 7
Fig. 7
RNA expression analysis of genes associated with the D11 fiber length QTL. Vertical axis represents relative gene expression normalized by 18S rRNA for RT-qPCR analysis and number of reads detected by RNAseq. Different shade bars represent fiber developmental time points in increasing order 3, 5, 8, 12 and 16 DPA; only 8 DPA was used for RNAseq. Numbers next to the gene name indicates position on chromosome. Asterisks indicate nsSNP between RILs in the gene

References

    1. Basra AS, Malik C. Development of the cotton fiber. Int Rev Cytol. 1984;89:65–113. doi: 10.1016/S0074-7696(08)61300-5. - DOI
    1. Kim HJ, Triplett BA. Cotton fiber growth in planta and in vitro. Models for plant cell elongation and cell wall biogenesis. Plant Physiol. 2001;127(4):1361–1366. doi: 10.1104/pp.010724. - DOI - PMC - PubMed
    1. Applequist WL, Cronn R, Wendel JF. Comparative development of fiber in wild and cultivated cotton. Evol Dev. 2001;3(1):3–17. doi: 10.1046/j.1525-142x.2001.00079.x. - DOI - PubMed
    1. Benedict CR, Kohel RJ, Lewis HL. Cotton fiber quality. In: Smith CW, Cothren JT, editors. Cotton: origin, history, technology, and production. New York: John Wiley & Sons; 1999;4:269–88.
    1. Zeng L, Meredith WR. Associations among lint yield, yield components, and fiber properties in an introgressed population of cotton. Crop Sci. 2009;49(5):1647–1654. doi: 10.2135/cropsci2008.09.0547. - DOI

LinkOut - more resources