. 2019 Feb 6;20(1):27.
doi: 10.1186/s12931-019-0992-3.

Ethyl pyruvate reduces organic dust-induced airway inflammation by targeting HMGB1-RAGE signaling

Affiliations

Ethyl pyruvate reduces organic dust-induced airway inflammation by targeting HMGB1-RAGE signaling

Sanjana Mahadev Bhat et al. Respir Res. .

Abstract

Background: Animal production workers are persistently exposed to organic dust and can suffer from a variety of respiratory disease symptoms and annual decline in lung function. The role of high mobility group box-1 (HMGB1) in inflammatory airway diseases is emerging. Hence, we tested a hypothesis that organic dust exposure of airway epithelial cells induces nucleocytoplasmic translocation of HMGB1 and blocking this translocation dampens organic dust-induced lung inflammation.

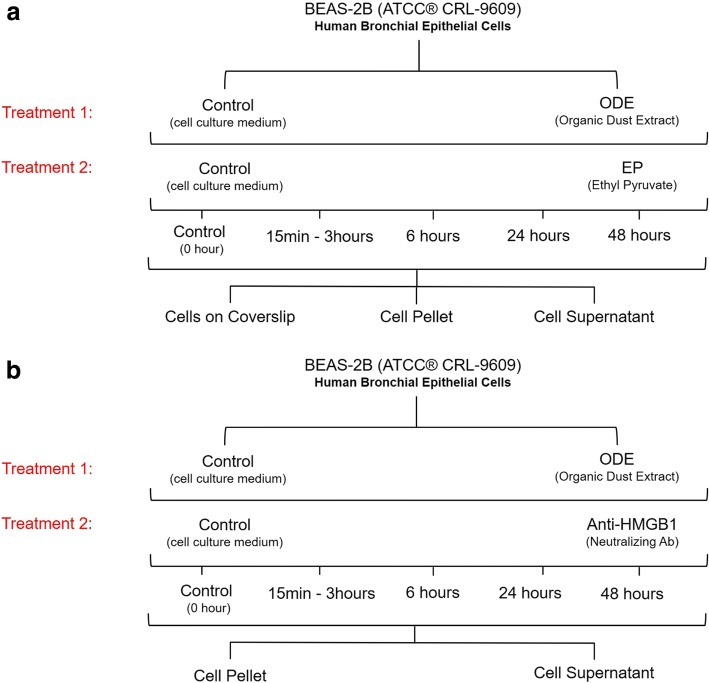
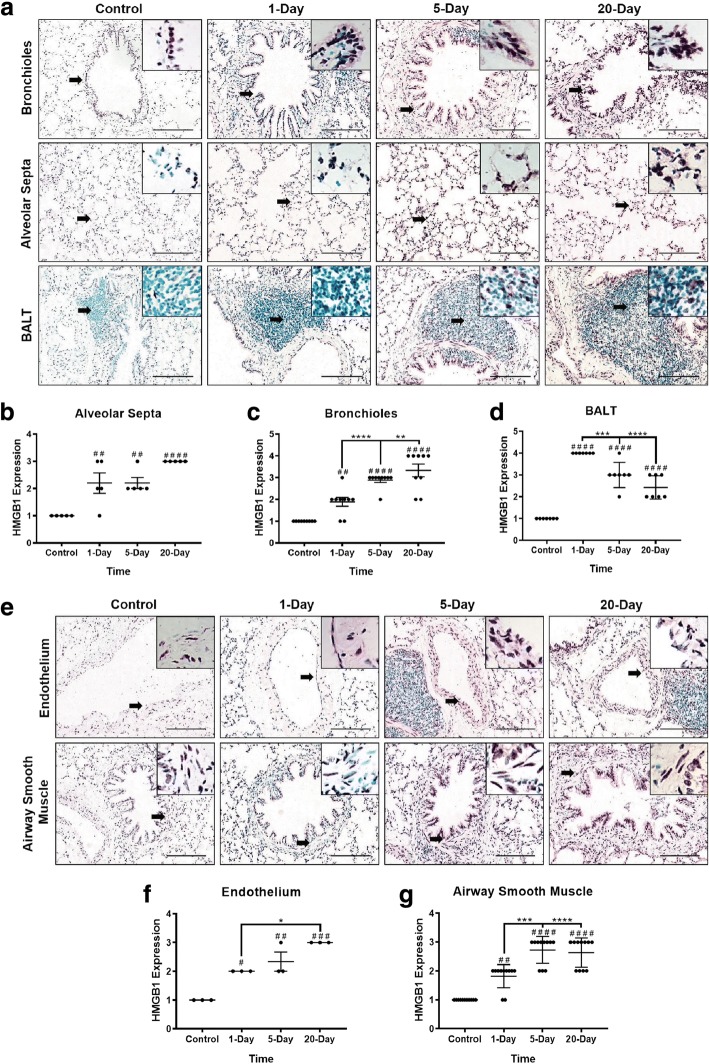
Methods: Rats were exposed to either ambient air or swine barn (8 h/day for either 1, 5, or 20 days) and lung tissues were processed for immunohistochemistry. Swine barn dust was collected and organic dust extract (ODE) was prepared and sterilized. Human airway epithelial cell line (BEAS-2B) was exposed to either media or organic dust extract followed by treatment with media or ethyl pyruvate (EP) or anti-HMGB1 antibody. Immunoblotting, ELISA and other assays were performed at 0 (control), 6, 24 and 48 h. Data (as mean ± SEM) was analyzed using one or two-way ANOVA followed by Bonferroni's post hoc comparison test. A p value of less than 0.05 was considered significant.

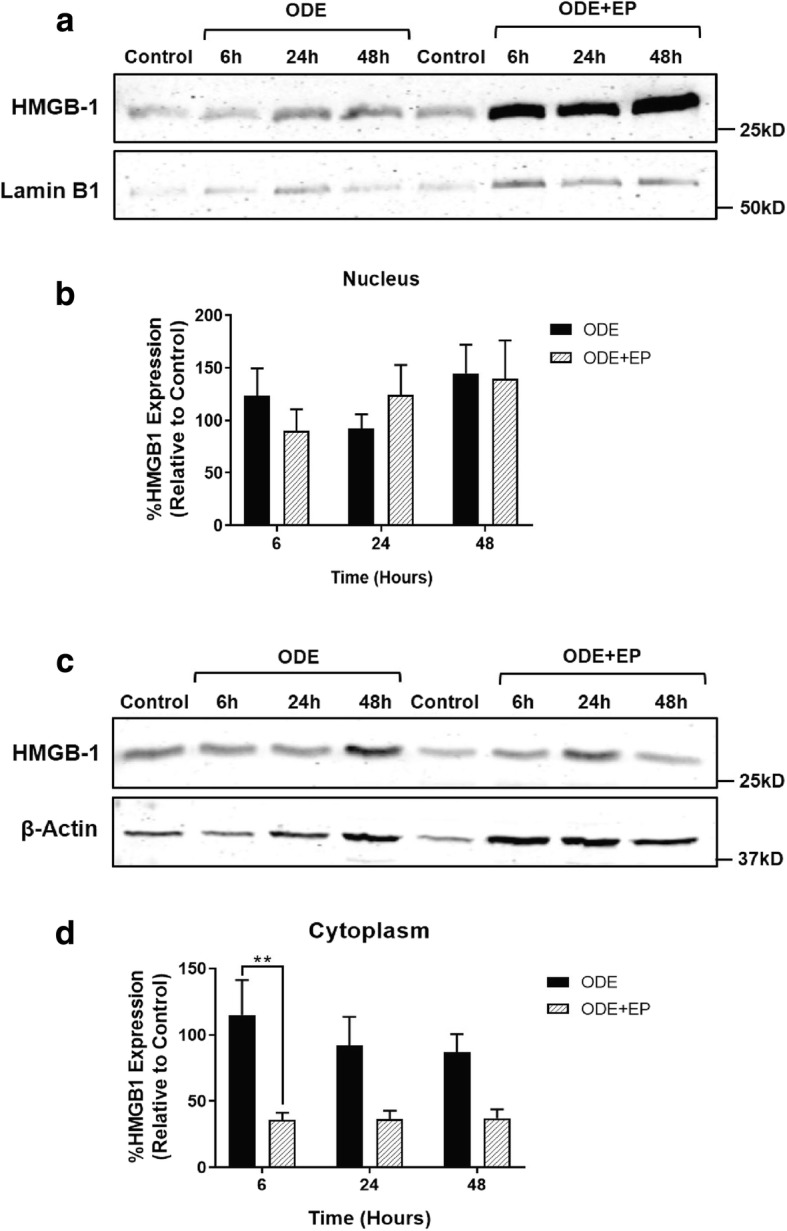
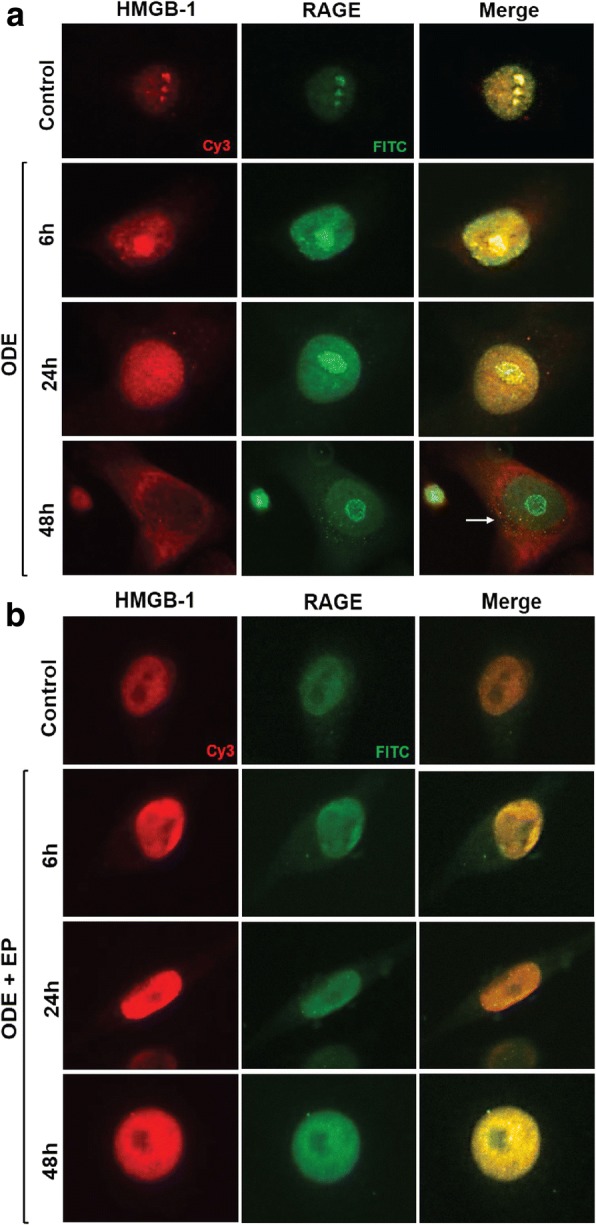
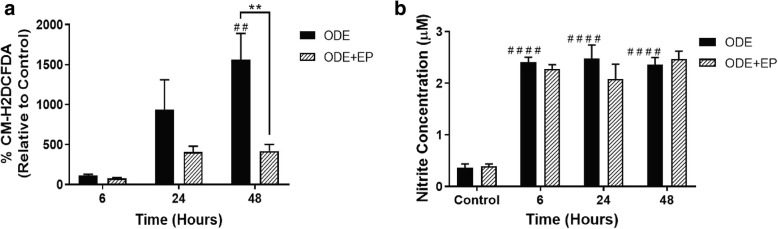
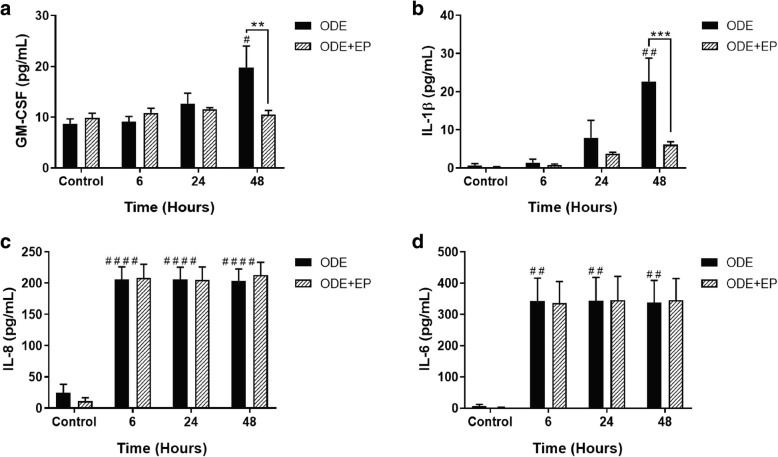
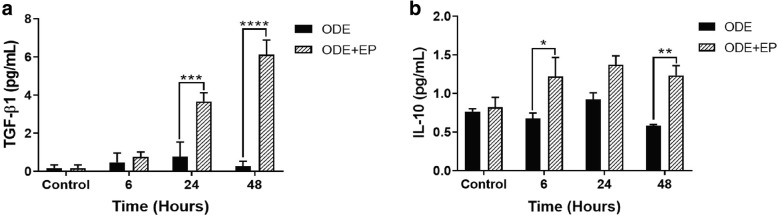
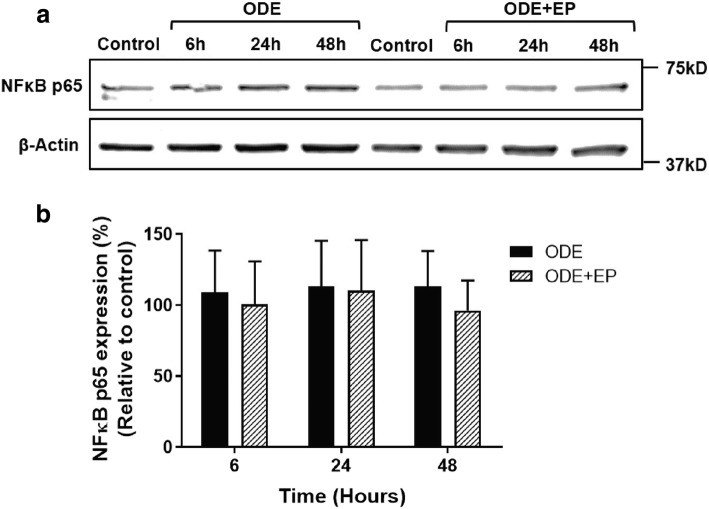
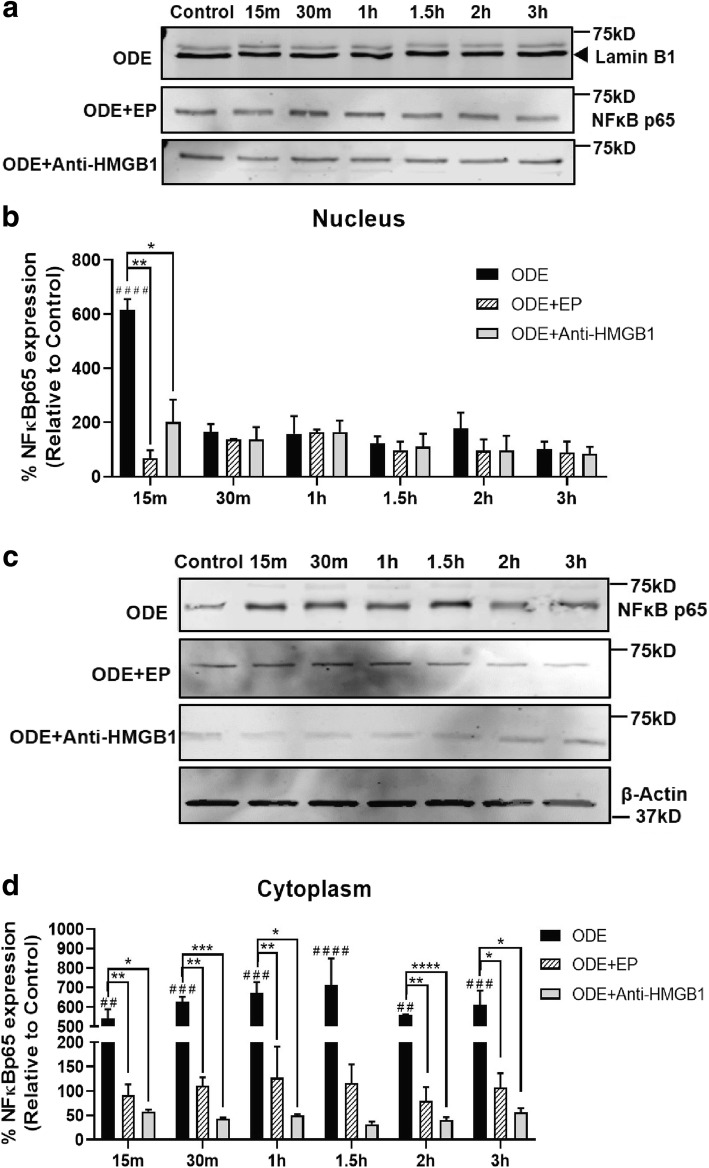
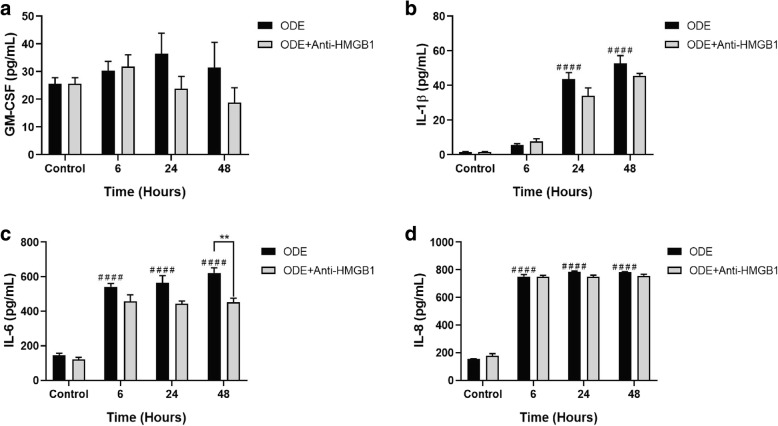
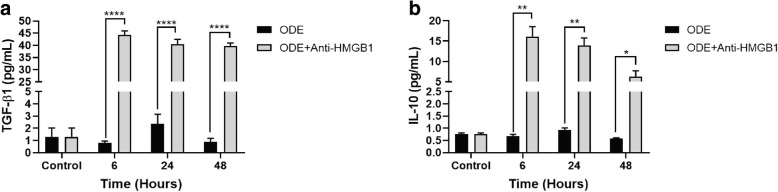
Results: Compared to controls, barn exposed rats showed an increase in the expression of HMGB1 in the lungs. Compared to controls, ODE exposed BEAS-2B cells showed nucleocytoplasmic translocation of HMGB1, co-localization of HMGB1 and RAGE, reactive species and pro-inflammatory cytokine production. EP treatment reduced the ODE induced nucleocytoplasmic translocation of HMGB1, HMGB1 expression in the cytoplasmic fraction, GM-CSF and IL-1β production and augmented the production of TGF-β1 and IL-10. Anti-HMGB1 treatment reduced ODE-induced NF-κB p65 expression, IL-6, ROS and RNS but augmented TGF-β1 and IL-10 levels.

Conclusions: HMGB1-RAGE signaling is an attractive target to abrogate OD-induced lung inflammation.

Keywords: Ethyl pyruvate; HMGB1; Lung inflammation; Organic dust; RAGE.


Conflict of interest statement

Competing interests

The authors declare that they have no competing interests.

Publisher’s Note

Springer Nature remains neutral with regard to jurisdictional claims in published maps and institutional affiliations.

Figures

Fig. 1
Fig. 1
ODE exposure of BEAS-2B cells and EP or anti-HMGB1 neutralizing antibody treatment. BEAS-2B cells were treated with either media (control) or ODE (treatment 1) followed by either media, EP (a, treatment-2) or neutralizing HMGB1 antibody (b, treatment 2). Cells were processed for various assays at 0 (control), 6, 24 and 48 h by collecting cells on coverslips or cell pellet or cell supernatant
Fig. 2
Fig. 2
OD exposure of rats in the swine barn work environment and HMGB1 expression. Immunohistochemical staining for HMGB1 expression was performed on rat lung tissues. Compared to controls, one, five and 20-day barn (organic dust) exposure of rats induced an increase in the expression of HMGB1 in the bronchioles, alveolar septa and BALT (a) and endothelium of the blood vessels and ASM (arrows and inset, bar = 100 μm, e), respectively. One-way ANOVA performed on immunohistochemical scores for HMGB1 expression in bronchioles (9 fields/animal), alveolar septa (5 fields/animal) and BALT (7 fields/animal) (b-d) and endothelium of blood vessels (3 fields/animal) and ASM (11 fields/animal) is presented (f and g). *p < 0.05, **p < 0.005, ***p < 0.0005, ****p < 0.0001
Fig. 3
Fig. 3
EP reduces ODE-exposure induced nucleocytoplasmic translocation of HMGB1. Medium (control, 0 h) or ODE (6, 24 and 48 h post) treated cells were stained with polyclonal anti-HMGB1 antibody and DAPI stain delineated the nuclei. Compared to controls, ODE treated cells showed nucleocytoplasmic translocation of HMGB1 (arrows and inset, bar = 200 μm, a). Compared to vehicle (medium), co-treatment with EP (2.5 μM) showed a marked decrease in ODE-induced nucleocytoplasmic translocation of HMGB-1 (arrows and inset, micrometer = 200 μm, b)
Fig. 4
Fig. 4
EP reduces ODE-exposure induced nucleocytoplasmic translocation of HMGB1. Medium (control, 0 h) or ODE (6, 24 and 48 h post) treated cells were processed for separation of nuclear and cytoplasmic fractions and western blotting to detect HMGB1 protein. Compared to controls, ODE treated cells showed a temporal increase in HMGB1 expression (25 kD) in the (a) nuclear fraction at 6 and 48 h. Compared to vehicle (Ringer’s solution), co-treatment with EP (2.5 μM) resulted in significantly decreased levels of HMGB1 in the cytoplasm at 6 h post-treatment indicating reduction in ODE-induced nucleocytoplasmic translocation of HMGB1 (d). HMGB1 (25kD) bands were normalized over either Lamin B1 (50kD, cytoplasmic fraction, a) or β-actin (37kD, nuclear fraction, b) and percentage intensity (n = 5/group) of treatment groups relative to control were analyzed using two-way ANOVA (c and d). **p < 0.01 (* indicates difference within the OD/barn exposure groups)
Fig. 5
Fig. 5
EP reduces ODE-exposure induced augmentation of RAGE expression and HMGB1-RAGE co-localization in the cytoplasm. Medium (control, 0 h) or ODE treated (6, 24 and 48 h post) treated cells were stained with polyclonal anti-HMGB1 or anti-RAGE antibodies. Compared to controls, ODE treated cells showed increased expression and nucleocytoplasmic translocation of HMGB1 (arrowhead, 48 h, a), increased expression of RAGE (48 h, a) and co-localization of HMGB1 and RAGE (white arrows, 48 h, a). Compared to vehicle (Ringer’s solution), co-treatment with EP (2.5 μM) resulted in a marked decrease in ODE-induced nucleocytoplasmic translocation of HMGB-1 and co-localization of HMGB1 and expression of RAGE (arrows and inset, bar = 200 μm, b)
Fig. 6
Fig. 6
ODE exposure induces ROS and nitrite (secreted RNS) production and EP treatment reduces ODE-induced ROS production. Media alone (control, 0 h) or ODE (6, 24, and 48 h) treated cells were subjected to CM-H2DCFDA and Griess’ assay to quantify intracellular ROS production (a) and secreted nitrite concentration (b) respectively (n = 6). ODE exposure of cells resulted in significant increase in intracellular ROS and nitrite secretion (secreted RNS) into the media as early as 6 h post-treatment. Compared to vehicle treatment, cells co-treated with EP (2.5 μM) showed a significant reduction in ODE-induced ROS production at 48 h. Data analyzed with two-way ANOVA is represented (a and b). ## or **p < 0.01 and **** or #### p < 0.0001. # indicates significantly different from control whereas * indicates significant difference within the OD/barn exposure groups
Fig. 7
Fig. 7
EP treatment reduces ODE exposure induced secretion of GM-CSF and IL-1β but not IL-8 and IL-6 levels. Compared to medium (controls, 0 h), ODE treated BEAS-2B cells secreted increased levels of GM-CSF, IL-1β, IL-8 and IL-6 (a-d) respectively. Compared to vehicle (Ringer’s solution), co-treatment with EP (2.5 μM) significantly reduced ODE-induced GM-CSF and IL-1β levels (a and b). Data (n = 6) analyzed using two-way ANOVA is represented. * or # p < 0.05, ** or ## p < 0.01, *** or ### p < 0.001, **** or #### p < 0.0001. # indicates different from control whereas * indicates difference within the OD/barn exposure groups
Fig. 8
Fig. 8
EP-treatment augments ODE-induced production of TGF-β1 and IL-10 levels in BEAS-2B cells. Compared to medium (control, 0 h), co-treatment of ODE exposed BEAS-2B cells with EP (2.5 μM) significantly increased the production of TGF-β1 (24 and 48 h) and IL-10 (6, 24 and 48 h).d Data (n = 6) analyzed with two-way ANOVA is represented. * or #p < 0.05, ** or ##p < 0.01, *** or ### p < 0.001, **** or #### p < 0.0001. # indicates different from control whereas * indicates difference within the OD/barn exposure groups
Fig. 9
Fig. 9
ODE exposure with or without EP-treatment does not alter - NF-κB p65 levels. Medium or ODE treated (with or without co-treatment with EP) whole cell fractions were processed for western blot analysis of NF-κB p65 and β-actin proteins (a). Normalized intensity values (as percentage relative to controls) were compared (b). There was no difference between any of the treatment groups. Data (n = 5) analyzed with one-way ANOVA is represented
Fig. 10
Fig. 10
Treatment with EP or anti-HMGB1 neutralizing antibody decreases NF-kB p65 nuclear translocation Cells were processed for separation of nuclear and cytoplasmic fractions and western blotting to detect NF-κBp65 protein. Compared to controls, ODE treated cells showed a temporal increase in NF-κB p65 expression (68 kDa) in the (a) nuclear fraction at 15 min. Compared to vehicle (medium), co-treatment with EP and anti-HMGB1 antibody (10 μM) resulted in significant decrease in the levels of NF-κB p65 in the cytoplasm at 15 min post-treatment indicating reduction in ODE-induced NFκB p65 activation (b and d). NF-κB p65 (68 kD) bands were normalized over either Lamin B1 (50 kD, nuclear fraction, a) or β-actin (37 kD, cytoplasmic fraction, b) and percentage intensity (n = 5/group) values of treatment groups relative to control were analyzed using two-way ANOVA (c and d). * or # p < 0.05, ** or ## p < 0.01, *** or ### p < 0.001, **** or #### p < 0.0001. # indicates different from control whereas * indicates difference within the OD/barn exposure groups
Fig. 11
Fig. 11
Neutralizing anti-HMGB1 antibody treatment reduces ODE exposure induced secretion of IL-6 but not IL-8 levels. Compared to controls, ODE treatment increased the production of GM-CSF (a, 24 and 48 h), IL-1β, IL-6 and IL-8. When ODE exposed cells were treated with anti-HMGB1 antibody (10 μM), significantly reduced ODE-induced increase in IL-6 levels only (c). and did not change GM-CSF (a), IL-1β (b) and IL-8 (d) levels. Data (n = 6) analyzed using two-way ANOVA is represented. ** or ## p < 0.01 and **** or #### p < 0.0001. # indicates different from control whereas * indicates difference within the OD/barn exposure groups
Fig. 12
Fig. 12
Neutralizing antibody treatment augments ODE-induced production of TGF-β1 and IL-10 levels in BEAS-2B cells. Compared to medium (control, 0 h), co-treatment of ODE exposed BEAS-2B cells with Anti-HMGB1 antibody (10 μM) significantly increased the production of TGF-β1 (a, 6, 24 and 48 h) and IL-10 (b, 6, 24 and 48 h). Data (n = 6) analyzed with two-way ANOVA is represented. * or # p < 0.05, ** or ## p < 0.01, *** or ### p < 0.001, **** or #### p < 0.0001. # indicates different from control whereas * indicates difference within the OD/barn exposure groups
Fig. 13
Fig. 13
Antibody neutralization treatment reduces ODE-induced ROS and nitrite production. Cells or supernatants were subjected to CM-H2DCFDA and Griess’ assay to quantify intracellular ROS production (a) and secreted nitrite concentration (b) respectively (n = 6). Compared to ODE exposure alone, ODE exposed cells co-treated with Anti-HMGB1 antibody (10 μM) showed a significant reduction in ODE-induced ROS production (48 h) and secreted nitrite (6 and 48 h). Data analyzed with two-way ANOVA is represented (a and b). * or # p < 0.05, ** or ## p < 0.01, *** or ### p < 0.001, **** or #### p < 0.0001. # indicates different from control whereas * indicates difference within the OD/barn exposure groups
Fig. 14
Fig. 14
ODE exposure modulates NF-κB subunit gene expression with time. qRT-PCR analysis on NF-κB sub unit genes was performed on control and ODE exposed cells at 6, 24 and 48 h (a-3). Compared controls, ODE-exposure induced a significant increase in nfkbp65 (a), nfkbp52 (b) and crel (d) at 6, 24 and 48 h (#, p < 0.05 and ###, p < 0.001 with respect to controls) and did not change nfkbp50 (c) and relb (e). Data analyzed with one-way ANOVA is represented as fold change of mRNA expression shown relative to untreated control cells
Fig. 15
Fig. 15
ODE exposure increases tlr2 and tlr4 gene expression with time. qRT-PCR analysis on tlr2 (a) and tlr4 (b) genes was performed on control and ODE exposed cells at 6, 24 and 48 h. Compared to controls, ODE exposure resulted in a significant increase in fold in the expression of both tlr2 and tlr4 (###, p < 0.001 and ####, p < 0.0001, a and b respectively). Data analyzed with one-way ANOVA is represented as fold change of mRNA expression shown relative to untreated control cells

References

    1. Agriculture: a hazardous work (online) [http://www.ilo.org/safework/areasofwork/hazardous-work/WCMS_110188/lang%...]. Accessed 10 Jul 2018.
    1. Sethi RS, Schneberger D, Charavaryamath C, Singh B. Pulmonary innate inflammatory responses to agricultural occupational contaminants. Cell Tissue Res. 2017:1–16. - PubMed
    1. American Thoracic Society Respiratory health hazards in agriculture. Am J Respir Crit Care Med. 1998;158:S1–S76. - PubMed
    1. Wunschel J, Poole JA. Occupational agriculture organic dust exposure and its relationship to asthma and airway inflammation in adults. J Asthma. 2016;53:471–477. - PMC - PubMed
    1. Davidson ME, Schaeffer J, Clark ML, Magzamen S, Brooks EJ, Keefe TJ, Bradford M, Roman-Muniz N, Mehaffy J, Dooley G, et al. Personal exposure of dairy workers to dust, endotoxin, muramic acid, ergosterol and ammonia on large-scale dairies in the high plains western United States. J Occup Environ Hyg. 2017;15:182–193. - PMC - PubMed

MeSH terms