

Cross-country comparisons of trends in adolescent psychosomatic symptoms - a Rasch analysis of HBSC data from four Nordic countries
- PMID: 30728023
- PMCID: PMC6366074
- DOI: 10.1186/s12955-019-1097-x
Cross-country comparisons of trends in adolescent psychosomatic symptoms - a Rasch analysis of HBSC data from four Nordic countries
Abstract
Background: To analyse the psychometric properties of the HBSC Symptom Checklist (HBSC-SCL) on psychosomatic symptoms with a focus on the operating characteristics of the items, and on the impacts of measurement distortions on the comparisons of person measures across time and between countries.
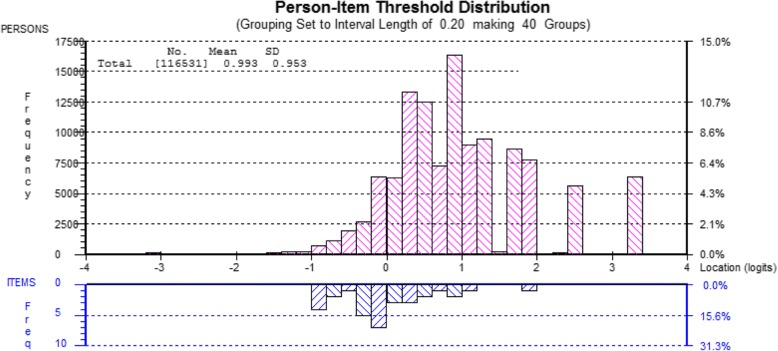
Methods: Data were collected in 1993/94, 1997/98, 2001/02, 2005/06, 2008/09, 2013/14 in Denmark, Finland, Norway and Sweden as part of the Health Behaviour in School-aged Children (HBSC) study. Data comprised 116,531 students 11, 13 and 15 years old. Rasch analysis was conducted of the HBSC-SCL consisting of eight items with a focus on Differential Item Functioning (DIF) and item threshold ordering. The impacts of DIF and threshold disordering on trend analyses were analysed in a subsample consisting of 15 years old students.
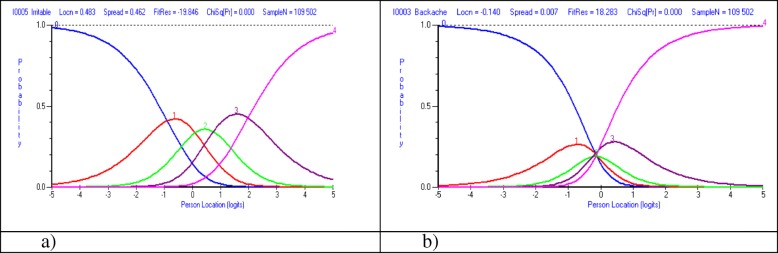
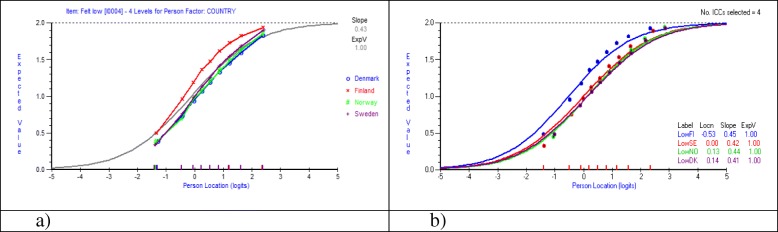
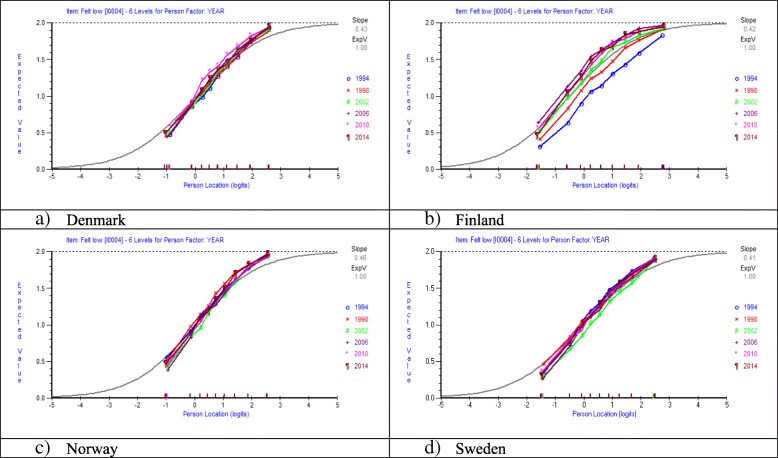
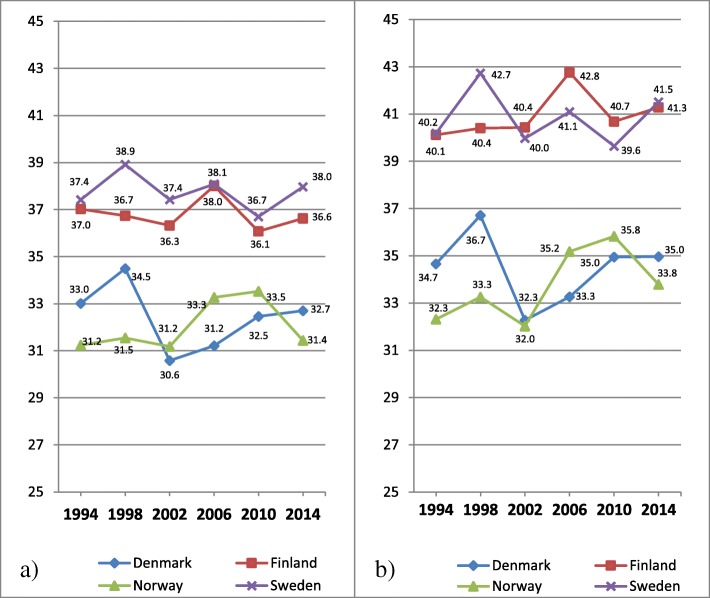
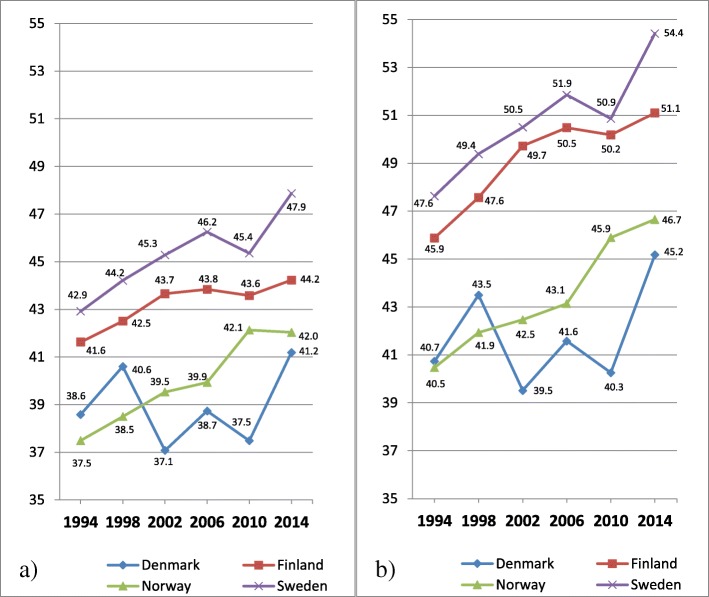
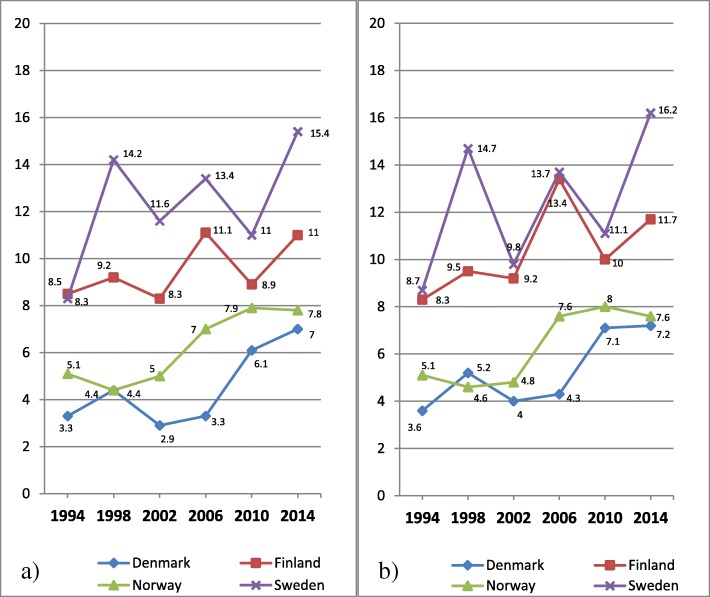
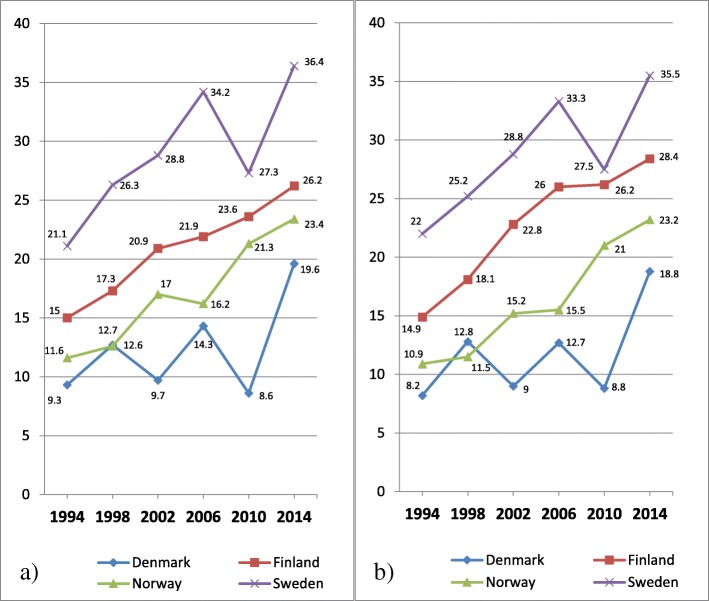
Results: One item shows evidence of severe DIF and the categorisation of some items does not seem to work as intended. Analyses of changes based on proportions of psychosomatic symptoms show that bad item functioning affects some comparisons between countries across time: A four percentage point difference between 15 years old girls in Finland and Sweden concerning the rate of increase of psychosomatic symptoms from 1994 to 2014 disappears when the problems with DIF and disordered item thresholds are taken into account. Although the proportions of students with psychosomatic symptoms are clearly higher 2014 than 1994 in all four countries the shape of most trends is nonlinear.
Conclusions: Some of the cross-country comparisons were distorted because of DIF and problems related to disordering of the item thresholds. The comparisons among girls between Finland and Sweden were affected by the problems pertaining to the original measure of psychosomatic symptoms, while the trend patterns among boys were not much affected. In addition to confirming increasing rates of adolescent mental health problems in the Nordic countries, the substantive analyses in the current study show that Finland is joining Sweden in having the sharpest increase among older adolescents, in particular among girls. To improve the functioning of the scale the DIF item could be removed or replaced and response categories collapsed in post hoc analyses.
Keywords: Adolescents; Differential item functioning; HBSC; Psychosomatic symptoms; Rasch measurement theory; Trend analyses.
Conflict of interest statement
Ethics approval and consent to participate
All procedures performed in studies involving human participants were in accordance with the ethical standards of the institutional and/or national research committee and with the 1964 Helsinki declaration and its later amendments or comparable ethical standards. For this type of study no formal approval from an ethical review board was required. Informed consent was obtained from all individual participants included in the HBSC study.
Consent for publication
Not applicable.
Competing interests
The authors declare that they have no competing interests.
Publisher’s Note
Springer Nature remains neutral with regard to jurisdictional claims in published maps and institutional affiliations.
Figures
References
-
- Rutter M, Smith DJ. Psychosocial disorders in young people: time trends and their causes. Chichester: Wiley for Academia Europaea; 1995.
-
- Currie C, Zanotti C, Morgan A, Currie D, de Looze M, Roberts C, et al., editors. Social determinants of health and well-being among young people. Health behaviour in school-aged children (HBSC) study: international report from the 2009/2010 survey. Copenhagen: WHO Regional Office for Europe; 2012.
-
- Inchley J, Currie D, Young T, Samdal O, Torsheim T, Augustson L, et al., editors. Growing up unequal: gender and socioeconomic differences in young people’s health and well-being. Health behaviour in school-aged children (HBSC) study: international report from the 2013/2014 survey. Copenhagen: WHO Regional Office for Europe; 2016.
Publication types
MeSH terms
Grants and funding
LinkOut - more resources
Full Text Sources
Medical
Research Materials
Miscellaneous
