. 2019 Feb 6;38(1):58.
doi: 10.1186/s13046-019-1056-8.

Focal adhesion kinase (FAK) activation by estrogens involves GPER in triple-negative breast cancer cells

Affiliations

Focal adhesion kinase (FAK) activation by estrogens involves GPER in triple-negative breast cancer cells

Damiano Cosimo Rigiracciolo et al. J Exp Clin Cancer Res. .

Abstract

Background: Focal adhesion kinase (FAK) is a cytoplasmatic protein tyrosine kinase that associates with both integrins and growth factor receptors toward the adhesion, migration and invasion of cancer cells. The G-protein coupled estrogen receptor (GPER) has been involved in the stimulatory action of estrogens in breast tumor. In this study, we have investigated the engagement of FAK by GPER signaling in triple negative breast cancer (TNBC) cells.

Methods: Publicly available large-scale database and patient data sets derived from "The Cancer Genome Atlas" (TCGA; www.cbioportal.org ) were used to assess FAK expression in TNBC, non-TNBC tumors and normal breast tissues. MDA-MB 231 and SUM159 TNBC cells were used as model system. The levels of phosphorylated FAK, other transduction mediators and target genes were detected by western blotting analysis. Focal adhesion assay was carried out in order to determine the focal adhesion points and the formation of focal adhesions (FAs). Luciferase assays were performed to evaluate the promoters activity of c-FOS, EGR1 and CTGF upon GPER activation. The mRNA expression of the aforementioned genes was measured by real time-PCR. Boyden chamber and wound healing assays were used in order to evaluate cell migration. The statistical analysis was performed by ANOVA.

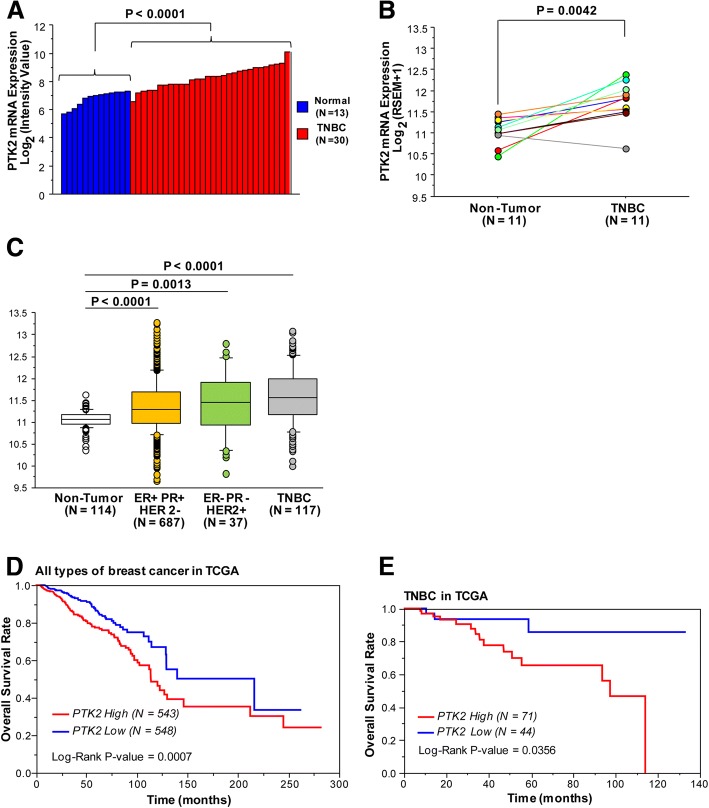
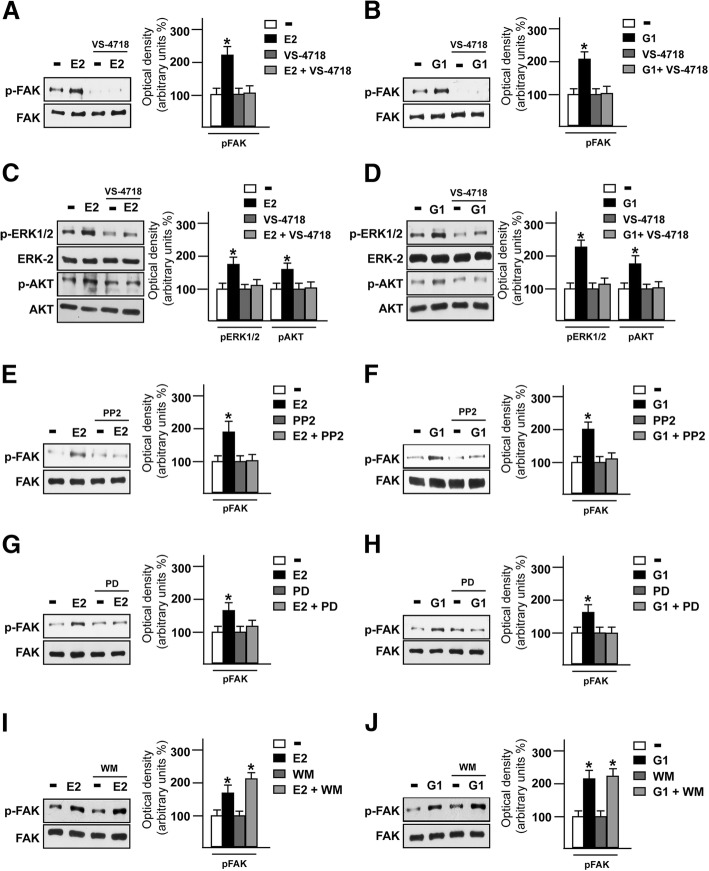
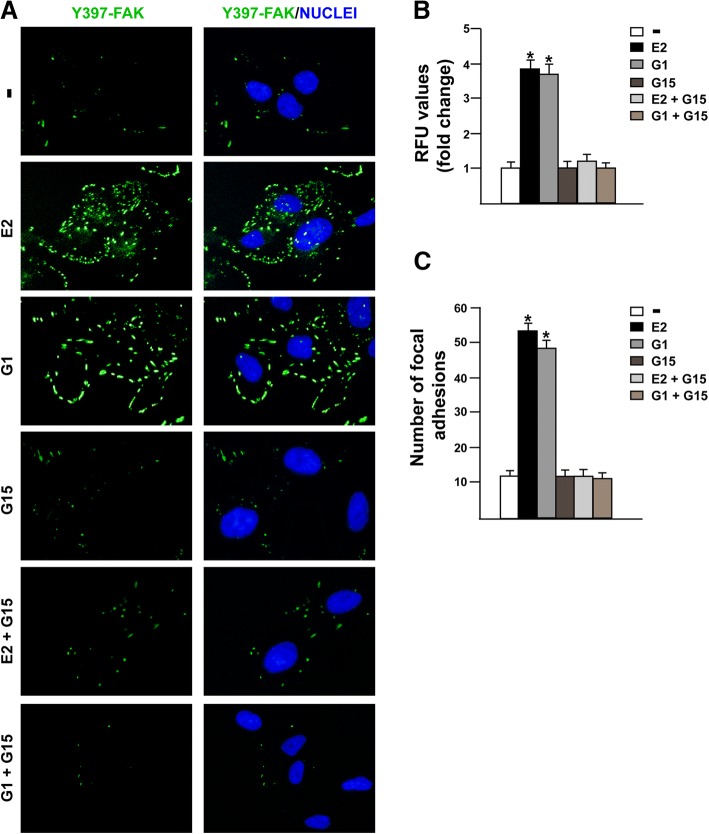
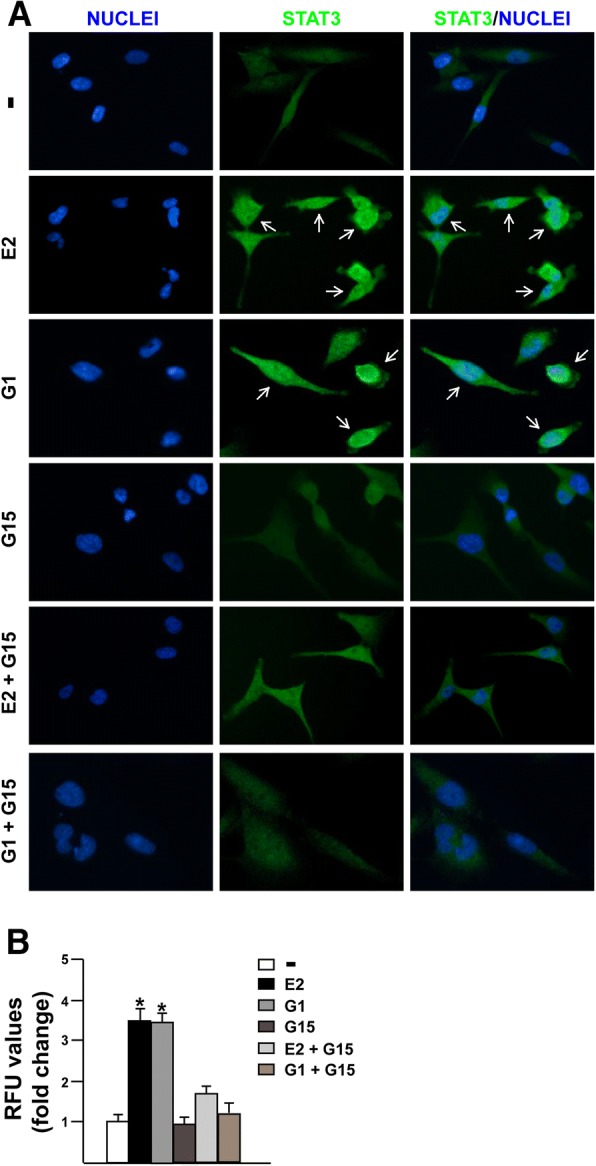
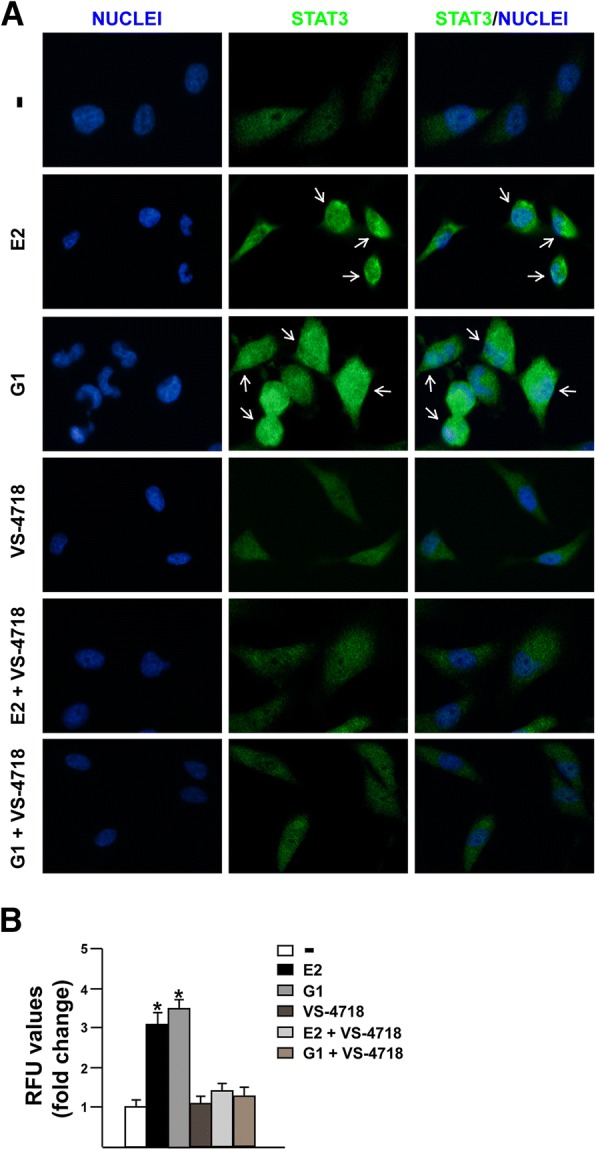
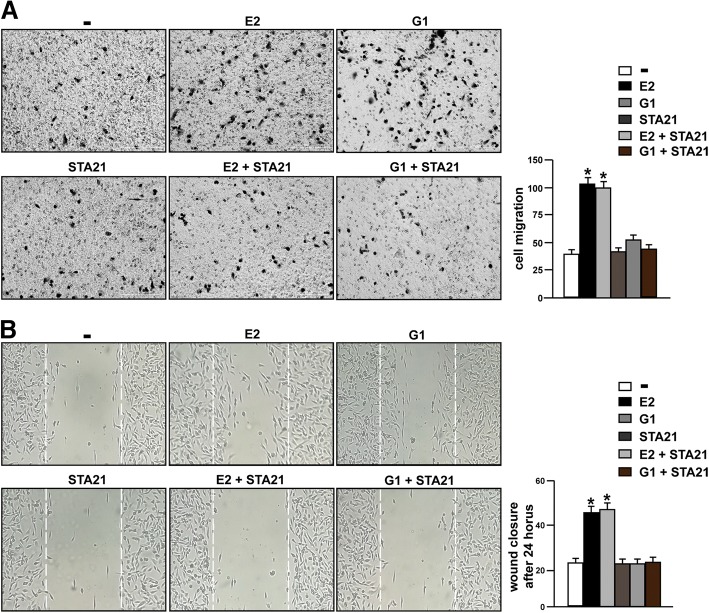
Results: We first determined by bioinformatic analysis that the mRNA expression levels of the gene encoding FAK, namely PTK2, is higher in TNBC respect to non-TNBC and normal breast tissues. Next, we found that estrogenic GPER signaling triggers Y397 FAK phosphorylation as well as the increase of focal adhesion points (FAs) in TNBC cells. Besides, we ascertained that GPER and FAK activation are involved in the STAT3 nuclear accumulation and gene expression changes. As biological counterpart, we show that FAK inhibition prevents the migration of TNBC cells upon GPER activation.

Conclusions: The present data provide novel insights regarding the action of FAK in TNBC. Moreover, on the basis of our findings estrogenic GPER signaling may be considered among the transduction mechanisms engaging FAK toward breast cancer progression.

Keywords: FAK; G-15; GPER; MDA-MB 231; STAT3, STA21; SUM159; TNBC; VS-4718.


Conflict of interest statement

Ethics approval and consent to participate

Not applicable.

Consent for publication

Not applicable.

Competing interests

The Authors declare that they have no conflict of interest. N.N. is an employee of MSD K.K., a subsidiary of Merck & Co., Inc. and reports personal fees from MSD K. K outside this study.

Publisher’s Note

Springer Nature remains neutral with regard to jurisdictional claims in published maps and institutional affiliations.

Figures

Fig. 1
Fig. 1
The PTK2 gene encoding FAK is over-expressed in TNBC. a Comparison of PTK2 mRNA expression between laser-microbeam microdissected TNBC and normal breast cells. b Comparison of PTK2 mRNA expression between matched TNBC and non-tumor breast tissues. c Comparison of PTK2 mRNA expression among non-tumor breast tissues, ER+/PR+/HER2-, ER-/PR-/HER2+ and TNBC as reported in TCGA. d Clinical outcome in all types of breast cancer with high PTK2 (mRNA Z-score > 1) or low PTK2 (mRNA Z-score ≤ 1) displayed by Kaplan-Meier plots with log-rank tests. e Clinical outcome in TNBC patients with high PTK2 (mRNA Z-score > 1) or low PTK2 (mRNA Z-score ≤ 1) displayed by Kaplan-Meier plots with log-rank tests
Fig. 2
Fig. 2
E2 and G1 trigger FAK Y397 activation in TNBC cells. Immunoblots showing FAK, ERK1/2 and AKT phosphorylation upon exposure with 100 nM E2 (a) or 100 nM G1 (b) in MDA-MB 231 cells, as indicated. Side panels show densitometric analysis of the immunoblots normalized to the loading control. Immunoblots showing FAK phosphorylation in MDA-MB 231 cells treated for 30 min with 100 nM E2 (c) or 100 nM G1 (d) alone and in combination with 100 nM GPER antagonist G15. Side panels show densitometric analysis of the immunoblots normalized to the loading control. e Immunoblots showing ERK1/2 and AKT phosphorylation in MDA-MB 231 cells treated for 30 min with 100 nM E2 or 100 nM G1 alone and in combination with 100 nM GPER antagonist G15. Side panels show densitometric analysis of the immunoblots normalized to the loading control. FAK, ERK-2 and AKT expression levels were used as loading controls for pFAK, pERK1/2 and pAKT, respectively. Results shown are representative of at least three independent experiments. (*) indicates p < 0.05
Fig. 3
Fig. 3
Transduction signaling mediating FAK Y397 phosphorylation. Immunoblots showing FAK phosphorylation in MDA-MB 231 cells treated for 30 min with 100 nM E2 (a) and 100 nM G1 (b) alone or in combination with 1 μM FAK kinase inhibitor VS-4718. Side panels show densitometric analysis of the immunoblots normalized to the loading control. Immunoblots showing ERK1/2 and AKT phosphorylation in MDA-MB 231 cells treated for 30 min with 100 nM E2 (c) and 100 nM G1 (d) alone or in combination with 1 μM FAK kinase inhibitor VS-4718. Side panels show densitometric analysis of the immunoblots normalized to the loading control. Immunoblots showing FAK phosphorylation in MDA-MB 231 cells treated for 30 min with 100 nM E2 (e) and 100 nM G1 (f) alone or in combination with 1 μM c-Src inhibitor PP2. Side panels show densitometric analysis of the immunoblots normalized to the loading control. Immunoblots showing FAK phosphorylation in MDA-MB 231 cells treated for 30 min with 100 nM E2 (g) and 100 nM G1 (h) alone or in combination with 10 μM MEK inhibitor PD98059 (PD). Side panels show densitometric analysis of the immunoblots normalized to the loading control. Immunoblots showing FAK phosphorylation in MDA-MB 231 cells treated for 30 min with 100 nM E2 (i) and 100 nM G1 (j) alone or in combination with 10 μM PI3K inhibitor Wortmannin. Side panels show densitometric analysis of the immunoblots normalized to the loading control. FAK, ERK-2 and AKT expression were used as loading controls for pFAK, pERK and pAKT, respectively. Results shown are representative of at least three independent experiments. (*) indicates p < 0.05
Fig. 4
Fig. 4
GPER mediates focal adhesions (FAs) in TNBC. a Immuofluorescence staining of Focal Adhesions (FAs) in MDA-MB 231 cells treated for 30 min with 100 nM E2 and 100 nM G1 alone or in combination with 100 nM GPER antagonist G15. Cells were probed with anti-phosphotyrosine primary antibody and FITC-conjugated secondary antibody in order to visualize FAs displayed by the green signal, whereas the blue signal indicates the nuclei counterstained with DAPI. Images shown are representative of 10 random fields from three independent experiments. b Fluorescence intensities of the green signal were quantified in at least 10 random fields in each condition and results are expressed as fold changes of relative fluorescence units (RFU) upon treatments respect to vehicle-treated cells. c FAs number was quantified in at least 10 random fields in each condition and results are expressed as mean focal adhesions ± SD from three independent experiments upon treatments respect to vehicle-treated cells. (*) indicates p < 0.05
Fig. 5
Fig. 5
The GPER antagonist G-15 reduces STAT3 nuclear accumulation triggered by estrogens. a Immunofluorescence staining of STAT3 in MDA-MB 231 cells treated for 1 h with 100 nM E2 and 100 nM G1 alone or in combination with 100 nM GPER antagonist G-15. Cells were probed with rabbit anti-STAT3 primary antibody followed by FITC-conjugated secondary antibody in order to detect STAT3 displayed by the green signal, whereas the blue signal indicates the nuclei counterstained with DAPI. Images shown are representative of 10 random fields. b Fluorescence intensities of the green signal were quantified in at least 10 random fields in each condition from three independent experiments and data are expressed as fold changes of relative fluorescence units (RFU) upon treatments respect to vehicle-treated cells. Arrows indicate STAT3 nuclear accumulation. (*) indicates p < 0.05
Fig. 6
Fig. 6
The FAK inhibitor VS-4718 prevents STAT3 nuclear accumulation triggered by estrogens. a Immunofluorescence staining of STAT3 in MDA-MB 231 cells treated for 1 h with 100 nM E2 and 100 nM G1 alone or in combination with 1 μM FAK kinase inhibitor VS-4718. Cells were probed with rabbit anti-STAT3 primary antibody followed by FITC-conjugated secondary antibody in order to detect STAT3 displayed by the green signal, whereas the blue signal indicates the nuclei counterstained with DAPI. Images shown are representative of 10 random fields. b Fluorescence intensities of the green signal were quantified in at least 10 random fields in each condition from three independent experiments and data are expressed as fold changes of relative fluorescence units (RFU) upon treatments respect to vehicle-treated cells. Arrows indicate STAT3 nuclear accumulation. (*) indicates p < 0.05
Fig. 7
Fig. 7
c-FOS, EGR1 and CTGF regulation by FAK and STAT3. c-FOS (a), EGR1 (b) and CTGF (c) luciferase promoter activity in MDA-MB 231 cells treated for 18 h with 100 nM E2 and 100 nM G1 alone or in combination with 100 nM GPER antagonist G15 or 20 μM STAT3 inhibitor STA21. The luciferase activities were normalized to the internal transfection control and values of cells receiving vehicle were set as 1-fold induction upon which the activities induced by treatments were calculated. Each data point represents the mean ± SD of three independent experiments performed in triplicate. d c-FOS, EGR1 and CTGF mRNA expression measured by real time-PCR in MDA-MB 231 cells treated for 4 h with 100 nM E2 and 100 nM G1 alone or in combination with 100 nM GPER antagonist G15 or 20 μM STAT3 inhibitor STA21. Values normalized to the 18 s expression are shown as fold changes of the mRNA expression induced by treatments compared to cells treated with vehicle (−). e-f Immunoblots showing c-FOS, EGR1 and CTGF protein expression in MDA-MB 231 cells treated for 4 h with 100 nM E2 (e) and 100 nM G1 (f) alone or in combination with 20 μM STAT3 inhibitor STA21. Side panels show densitometric analysis of the immunoblots normalized to β-actin. g c-FOS, EGR1 and CTGF mRNA expression measured by real time-PCR in MDA-MB 231 cells treated for 4 h with 100 nM E2 and 100 nM G1 alone or in combination with 1 μM FAK kinase inhibitor VS-4718. Values normalized to the 18 s expression are shown as fold changes of the mRNA expression induced by treatments compared to cells treated with vehicle (−). Immunoblots showing c-FOS, EGR1 and CTGF protein expression in MDA-MB 231 cells treated for 4 h with 100 nM E2 (h) and 100 nM G1 (i) alone or in combination with 1 μM FAK kinase inhibitor VS-4718. Side panels show densitometric analysis of the immunoblots normalized to β-actin. Results shown are representative of three independent experiments. (*) indicates p < 0.05
Fig. 8
Fig. 8
The FAK inhibitor VS-4718 inhibits the migration of TNBC cells induced by E2 and G1. a Boyden Chamber assays showing the migration of MDA-MB 231 cells treated for 4 h with 100 nM E2 and 100 nM G1 alone or in combination with 1 μM FAK kinase inhibitor VS-4718. The results are shown as cells migrating through the membrane at the bottom of the well upon treatments respect to vehicle (−). Results shown are representative of three independent experiments. b Cell migration was evaluated by wound-healing assay in MDA-MB 231 cells treated for 24 h with 100 nM E2 and 100 nM G1 alone or in combination with 1 μM FAK kinase inhibitor VS-4718. White dotted lines indicate the wound borders at the beginning of the assay and recorded 24 h post- scratching. Results shown are representative of three independent experiments. (*) indicates p < 0.05
Fig. 9
Fig. 9
The STAT3 inhibitor STA21 suppresses the migration of TNBC cells induced by E2 and G1. a Boyden Chamber assays showing the migration of MDA-MB 231 cells treated for 4 h with 100 nM E2 and 100 nM G1 alone or in combination with 20 μM STAT3 inhibitor STA21. The results are shown as cells migrating through the membrane at the bottom of the well upon treatments respect to vehicle (−). Results shown are representative of three independent experiments. b Cell migration was evaluated by wound-healing assay in MDA-MB 231 cells treated for 24 h with 100 nM E2 and 100 nM G1 alone or in combination with 20 μM STAT3 inhibitor STA21. White dotted lines indicate the wound borders at the beginning of the assay and recorded 24 h post- scratching. Results shown are representative of three independent experiments. (*) indicates p < 0.05

Similar articles

Cited by

References

    1. Siegel RL, Miller KD, Jemal A. Cancer statistics. CA Cancer J Clin. 2018;68:7–30. doi: 10.3322/caac.21442. - DOI - PubMed
    1. Polyak K. Heterogeneity in breast cancer. J Clin Invest. 2011;121:3786–3788. doi: 10.1172/JCI60534. - DOI - PMC - PubMed
    1. Tong CWS, Wu M, Cho WCS, KKW T. Recent Advances in the Treatment of Breast Cancer. Front Oncol. 2018;8:227. doi: 10.3389/fonc.2018.00227. - DOI - PMC - PubMed
    1. He Y, Jiang Z, Chen C, Wang X. Classification of triple-negative breast cancers based on Immunogenomic profiling. J Exp Clin Cancer Res. 2018;37:327. doi: 10.1186/s13046-018-1002-1. - DOI - PMC - PubMed
    1. Weigelt B, Peterse JL, Van’t veer LJ. Breast cancer metastasis: markers and models. Nat Rev Cancer. 2005;5:591–602. doi: 10.1038/nrc1670. - DOI - PubMed

MeSH terms