. 2019 Feb 6;12(1):14.
doi: 10.1186/s13048-019-0489-1.

Aberrant DNA methylation suppresses expression of estrogen receptor 1 (ESR1) in ovarian endometrioma

Affiliations

Aberrant DNA methylation suppresses expression of estrogen receptor 1 (ESR1) in ovarian endometrioma

Ryo Maekawa et al. J Ovarian Res. .

Abstract

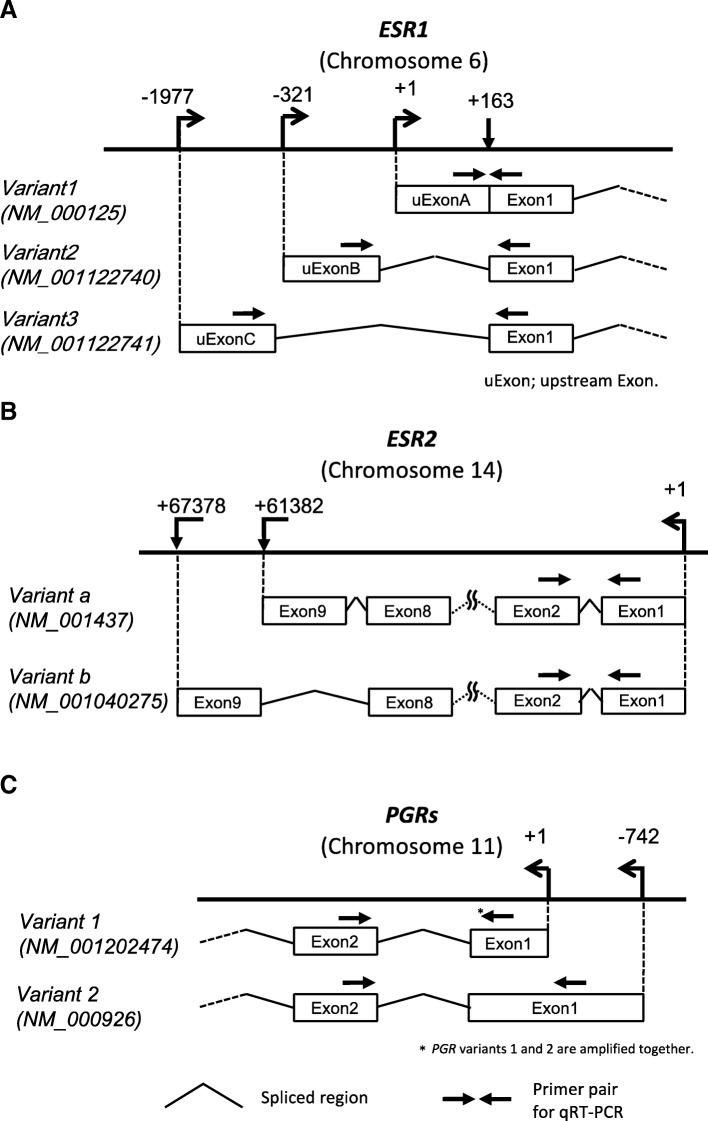
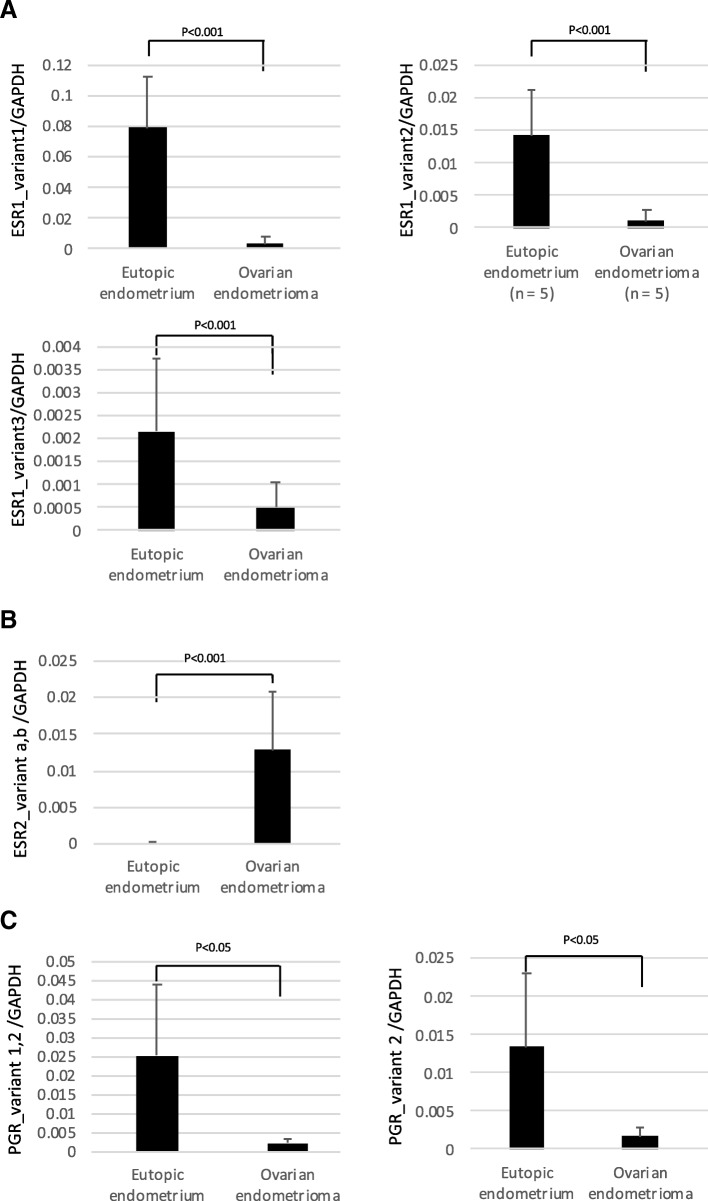
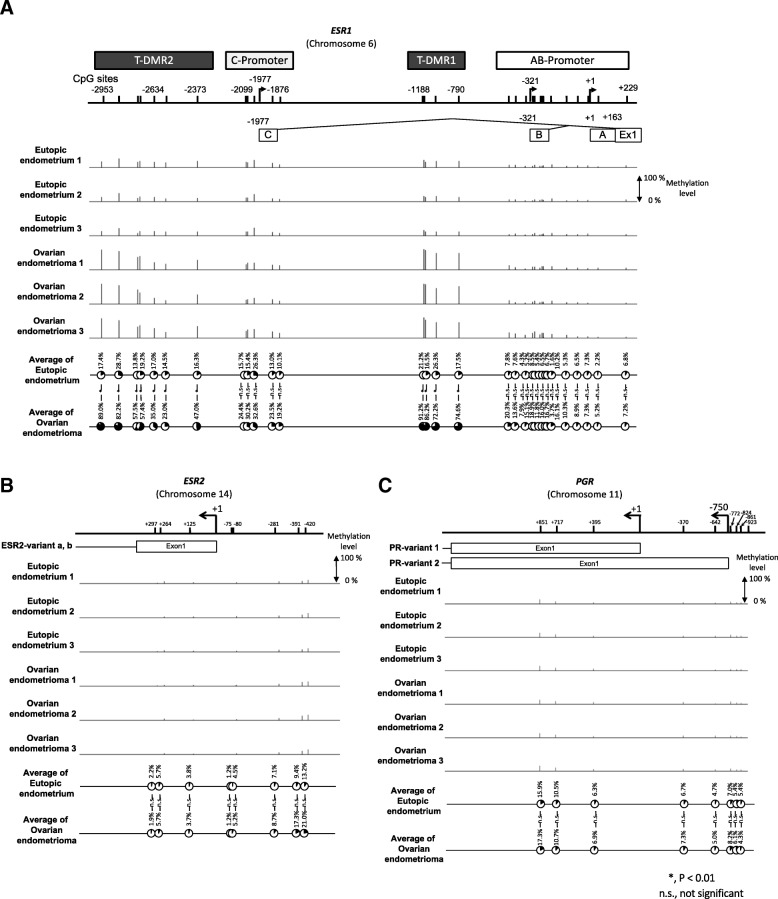
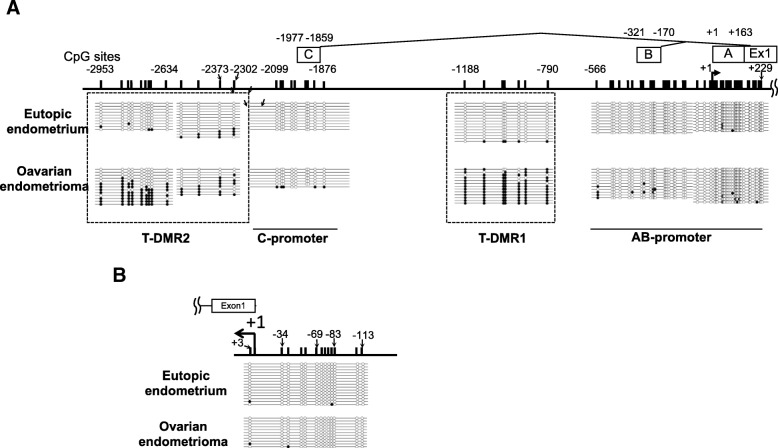
Background: In ovarian endometriomas (OE), the expression statuses of various steroid hormone receptors are altered compared with their expression statuses in eutopic endometrium (EE). For example, in OE, the expressions of estrogen receptor 1 (ESR1), which encodes ERα, and progesterone receptor (PGR) are downregulated, while the expression of ESR2, which encodes ERβ, is upregulated. The causes of these changes are unclear. DNA methylation of a specific region of a gene can result in tissue-specific gene expression. Such regions are called tissue-dependent and differentially methylated regions (T-DMRs). We previously reported that the tissue-specific expression of ESR1 is regulated by DNA methylation of a T-DMR in normal tissues. In the present study, we examined whether aberrant DNA methylation of the T-DMR is associated with the altered expressions of ESR1, ESR2 and PGR in OE.

Results: Gene expression levels of ESR1, ESR2 and PGR were measured by quantitative RT-PCR. The expression levels of ESR1 and PGR were significantly lower and the expression level of ESR2 was significantly higher in OE than in EE. DNA methylation statuses were examined with an Infinium HumanMethylation450K BeadChip and sodium bisulfite sequencing. DNA methylation at the T-DMRs of ESR1 were significantly higher in OE than in EE, but no significant differences were observed in the DNA methylation statuses of ESR2 and PGR.

Conclusions: Aberrant DNA methylation of the T-DMR was associated with the impaired expression of ESR1, but not the altered expressions of ESR2 and PGR, in OE.

Keywords: DNA methylation; Endometriosis; Estrogen receptor 1; Estrogen receptor 2; Eutopic endometrium; Ovarian endometrioma; Progesterone receptor; Steroid receptor.


Conflict of interest statement

Ethics approval and consent to participate

This study was reviewed and approved by the Institutional Review Board of Yamaguchi University Graduate School of Medicine. Written informed consent was obtained from the participants before the collection of any samples, and the specimens were irreversibly de-identified. All experiments involving the handling of human tissues were performed in accordance with Tenets of the Declaration of Helsinki.

Consent for publication

Written informed consent for publication was obtained from the participants before the collection of any samples.

Competing interests

The authors declare that they have no competing interests.

Publisher’s Note

Springer Nature remains neutral with regard to jurisdictional claims in published maps and institutional affiliations.

Figures

Fig. 1
Fig. 1
Genomic organization of ESR1, ESR2 and PGR. a Upstream exons and corresponding transcription start sites (TSSs) of ESR1. The upstream exons are shown by boxes and the corresponding TSSs are indicated by arrows. The numbers show the positions of the 5′ start sites of the upstream exons with respect to the start site of upstream Exon A. The different start sites correspond to the mature ESR1 mRNAs, called variant 1, 2 and 3. All 5′ upstream exons are spliced at the common acceptor splice site (+ 163 bp). b Exons, transcription start sites and transcription end sites of ESR2-variant a and b. The numbers of Exon 9 indicate the distances from the transcription start sites of each variant. c Exons, transcription start sites of PGR-variant 1 and 2. The numbers associated with Exon 1 of variants 1 and 2 indicate the 5′ start sites with respect to the distance from the start site of variant 1 (+ 1). The locations of the primer pairs used in qRT-PCR are indicated by the arrows
Fig. 2
Fig. 2
mRNA expression statuses of ESR1, ESR2 and PGR variants in EE and OE. ESR1 (variant 1, 2, and 3) (a) ESR2 (variant a and b) (b) and PGR (variant 1 and 2) (c) were analyzed by qRT-PCR. GAPDH was used as an internal control. The amount of mRNA of each variant was normalized to that of the internal control (GADPH). Data were expressed as a ratio of mRNA of each variant to GADPH. Each bar represents the mean +/− SEM.* p < 0.05
Fig. 3
Fig. 3
DNA methylation statuses of ESR1, ESR2 and PGR in EE and OE samples by BeadChip. Samples from 3 subjects are shown for each sample type. a DNA methylation statuses of AB-promoter, T-DMR1, C-promoter, and T-DMR2. The locations of each upstream Exon and CpG site are shown with the distance from the TSS of upstream Exon A. A, B and C are upstream Exon A, B and C, respectively. b and c DNA methylation statuses of the region of the transcription start site of ESR2 (b) and PGR (c). Bars indicate methylation levels from 0 to 100%. Pie charts show the average DNA methylation statuses (percentage) of EE and OE at each CpG site. The DNA methylation statuses of each CpG site were compared by unpaired t-test. p < 0.05
Fig. 4
Fig. 4
DNA methylation statuses of ESR1 and ESR2 in EE and OE by sodium bisulfite sequencing. One sample was analyzed for each sample type. For each region, 7 to 15 clones were sequenced. The methylation status of each CpG site in each clone is shown as unmethylated (open circles) or methylated (closed circles). a The numbers associated with uExons and CpG sites indicate the distance from transcription start site (TSS) of uExon A. A, B, and C indicate uExons A, B, and C, respectively. b The numbers associated with CpG sites indicate the distance from TSS of Exon 1

Similar articles

Cited by

References

    1. Rogers PA, D'Hooghe TM, Fazleabas A, Gargett CE, Giudice LC, Montgomery GW, et al. Priorities for endometriosis research: recommendations from an international consensus workshop. Reprod Sci. 2009;16(4):335–346. doi: 10.1177/1933719108330568. - DOI - PMC - PubMed
    1. Nakamura M, Yamashita Y, Hayashi A, Saito N, Yu M, Hayashi M, et al. Analyzing the risk factors for a diminished oocyte retrieval rate under controlled ovarian stimulation. Reprod Med Biol. 2017;16(1):40–44. doi: 10.1002/rmb2.12004. - DOI - PMC - PubMed
    1. Jia M, Dahlman-Wright K, Gustafsson JA. Estrogen receptor alpha and beta in health and disease. Best Pract Res Clin Endocrinol Metab. 2015;29(4):557–568. doi: 10.1016/j.beem.2015.04.008. - DOI - PubMed
    1. Paterni I, Granchi C, Katzenellenbogen JA, Minutolo F. Estrogen receptors alpha (ERalpha) and beta (ERbeta): subtype-selective ligands and clinical potential. Steroids. 2014;90:13–29. doi: 10.1016/j.steroids.2014.06.012. - DOI - PMC - PubMed
    1. Hewitt SC, Harrell JC, Korach KS. Lessons in estrogen biology from knockout and transgenic animals. Annu Rev Physiol. 2005;67:285–308. doi: 10.1146/annurev.physiol.67.040403.115914. - DOI - PubMed

MeSH terms