. 2019 Feb 6;21(1):49.
doi: 10.1186/s13075-019-1816-z.

Microbiome dysbiosis is associated with disease duration and increased inflammatory gene expression in systemic sclerosis skin

Affiliations

Microbiome dysbiosis is associated with disease duration and increased inflammatory gene expression in systemic sclerosis skin

Michael E Johnson et al. Arthritis Res Ther. .

Abstract

Background: Infectious agents have long been postulated to be disease triggers for systemic sclerosis (SSc), but a definitive link has not been found. Metagenomic analyses of high-throughput data allows for the unbiased identification of potential microbiome pathogens in skin biopsies of SSc patients and allows insight into the relationship with host gene expression.

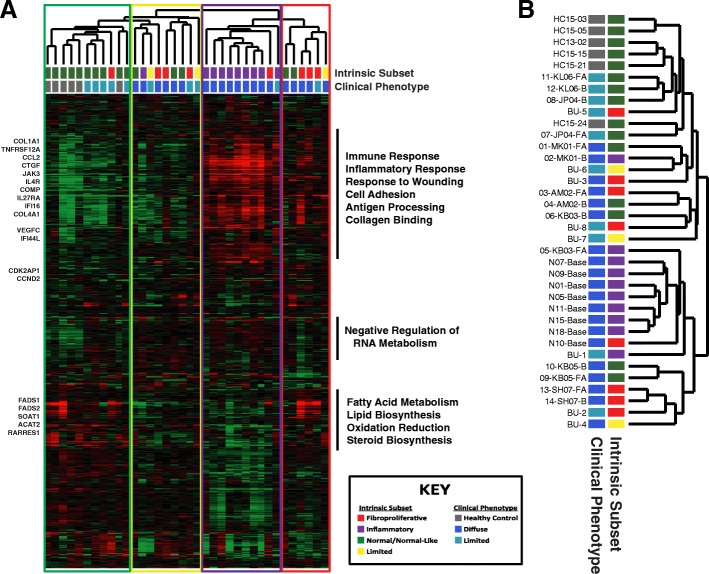
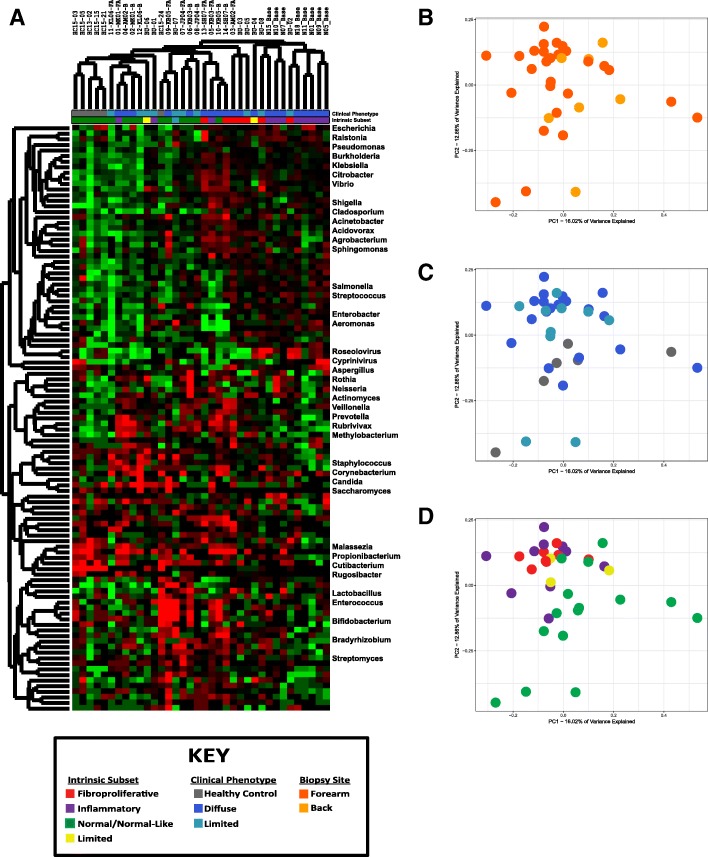
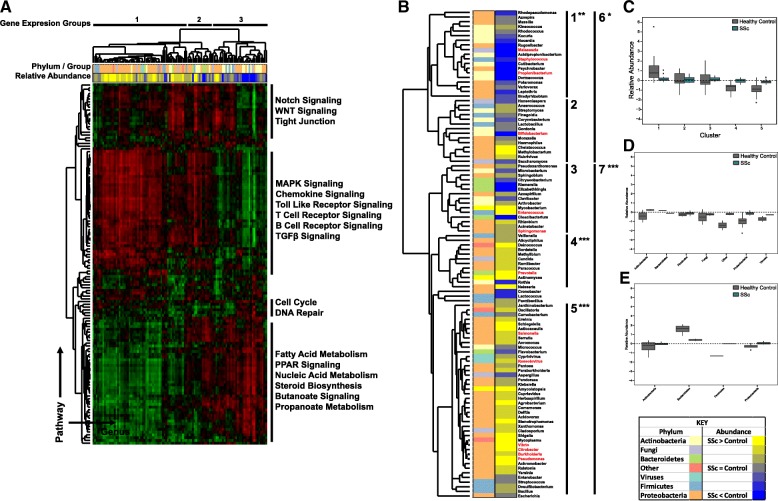
Methods: We examined skin biopsies from a diverse cohort of 23 SSc patients (including lesional forearm and non-lesional back samples) by RNA-seq. Metagenomic filtering and annotation was performed using the Integrated Metagenomic Sequencing Analysis (IMSA). Associations between microbiome composition and gene expression were analyzed using single-sample gene set enrichment analysis (ssGSEA).

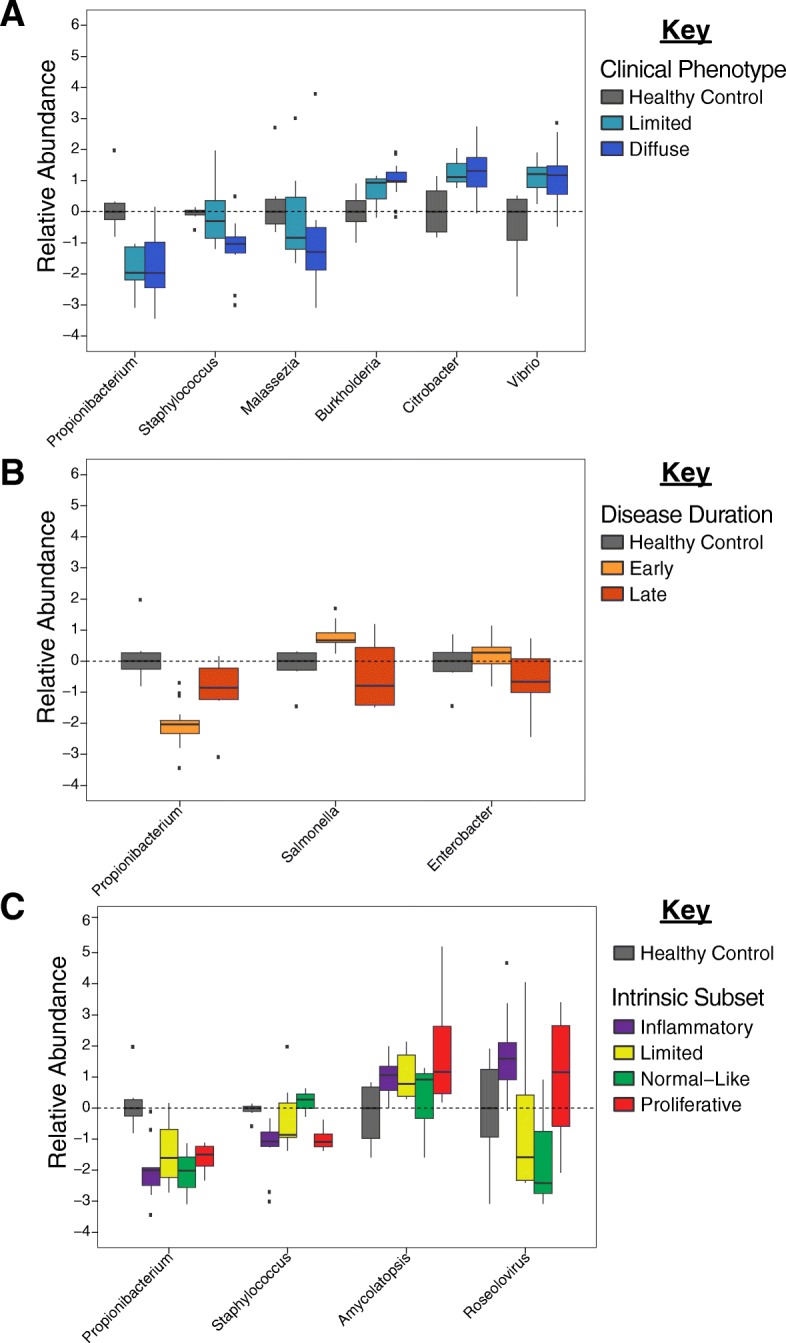
Results: We find the skin of SSc patients exhibits substantial changes in microbial composition relative to controls, characterized by sharp decreases in lipophilic taxa, such as Propionibacterium, combined with increases in a wide range of gram-negative taxa, including Burkholderia, Citrobacter, and Vibrio.

Conclusions: Microbiome dysbiosis is associated with disease duration and increased inflammatory gene expression. These data provide a comprehensive portrait of the SSc skin microbiome and its association with local gene expression, which mirrors the molecular changes in lesional skin.

Keywords: Metagenomics; Microbiome; RNA-sequencing; Scleroderma; Systemic sclerosis.


Conflict of interest statement

Ethics approval and consent to participate

Study participants provided written, informed consent prior to sample collection in accordance with the Declaration of Helsinki Protocol and the Institutional Review Boards of Boston University Medical Center, Boston, MA, Dartmouth-Hitchcock Medical Center, Lebanon, NH, and the Hospital for Special Surgery, New York, NY.

Consent for publication

N/A

Competing interests

The authors declare that they have no competing interests.

Publisher’s Note

Springer Nature remains neutral with regard to jurisdictional claims in published maps and institutional affiliations.

Figures

Fig. 1
Fig. 1
Intrinsic subset analysis of RNA-seq reads from SSc skin. a Assignment of intrinsic molecular subsets for SSc patients was performed using a support vector machine (SVM) developed for the purpose (Franks et al. In Press). Displayed are the 1010 genes from Johnson et al. [4] collapsed on gene ID and extracted from the normalized FPKM values for all 36 RNA-seq samples. Hierarchical clustering revealed distinct molecular subsets of disease, consistent with previous publications [–3]. The sample dendrogram is colored to indicate intrinsic subset designations: normal-like (green), limited (yellow), inflammatory (purple), proliferative (red). b Hash marks indicate SSc clinical diagnosis associated with each sample. Black bars indicate genes that clustered together hierarchically; the most significantly overrepresented GO terms are listed
Fig. 2
Fig. 2
Differential abundance of major skin taxa. SSc lesional skin exhibits significant changes in microbiome composition, relative to controls. Differential abundance of select genera, relative to controls, based on a clinical subtype, b disease duration (early, < 5 years; late, > 5 years), and c intrinsic molecular subset [1]
Fig. 3
Fig. 3
Distribution of the SSc skin core microbiome. The distribution and relative abundance of the SSc skin core microbiome was calculated by rarefaction to the depth of the lowest sample, and filtering to retain the fewest taxa necessary to account for 90% of all reads, resulting in a total of 103 unique genera. Data were then log2-transformed and median centered by library preparation. a Hierarchical clustering of the core microbiome. Hash marks below the dendrogram indicate intrinsic subset designations and SSc clinical diagnosis for each sample. Principal component analysis of the core microbiome was performed to identify associations between microbiome composition and b biopsy location, c clinical diagnosis, and d intrinsic subset
Fig. 4
Fig. 4
Microbiome composition is associated with pathway activation in SSc skin. Single-sample gene set enrichment analysis (ssGSEA) was run against normalized FPKM values for all 36 patient samples, using curated KEGG pathways as the probe gene sets. A correlation matrix was then generated by calculating Pearson’s correlations for all combinations of ssGSEA values and genus-level abundance across all patients. a Hierarchical clustering of the correlation matrix revealed strong associations between SSc-associated gene expression pathways and microbial composition. b Taxonomic clustering based on gene expression. Hash marks indicate phylum/group associated with each sample. Relative abundance indicates the degree to which each genus is differentially present in SSc patients, relative to controls with yellow indicating abundance is higher in SSc, while blue indicates abundance is higher in controls. Black bars indicate KEGG pathways that clustered together hierarchically, with representative pathways listed alongside each cluster (*p < 0.05; ** p < 0.01; *** p < 0.001 by paired t-test). Clinically relevant genera are highlighted in red. c Relative abundance of all genera by taxonomic cluster. d, e Distribution of taxa is shown for cluster 5 (d) and cluster 3 (e)

Comment in

References

    1. Milano A, Pendergrass SA, Sargent JL, George LK, McCalmont TH, Connolly MK, Whitfield ML. Molecular subsets in the gene expression signatures of scleroderma skin. PLoS One. 2008;3(7):e2696. doi: 10.1371/journal.pone.0002696. - DOI - PMC - PubMed
    1. Pendergrass SA, Lemaire R, Francis IP, Mahoney JM, Lafyatis R, Whitfield ML. Intrinsic gene expression subsets of diffuse cutaneous systemic sclerosis are stable in serial skin biopsies. J Invest Dermatol. 2012;132(5):1363–1373. doi: 10.1038/jid.2011.472. - DOI - PMC - PubMed
    1. Hinchcliff M, Huang C-C, Wood TA, Mahoney JM, Martyanov V, Bhattacharyya S, Tamaki Z, Lee J, Carns M, Podlusky S. Molecular signatures in skin associated with clinical improvement during mycophenolate treatment in systemic sclerosis. J Invest Dermatol. 2013;133(8):1979–89. - PMC - PubMed
    1. Johnson M, Mahoney J, Taroni J, Sargent J, Marmarelis E, Wu M, Varga J, Hinchcliff M, Whitfield M. Experimentally-derived fibroblast gene signatures identify molecular pathways associated with distinct subsets of systemic sclerosis patients in three independent cohorts. PLoS One. 2015;10(1):e0114017. doi: 10.1371/journal.pone.0114017. - DOI - PMC - PubMed
    1. Mahoney JM, Taroni J, Martyanov V, Wood TA, Greene CS, Pioli PA, Hinchcliff ME, Whitfield ML. Systems level analysis of systemic sclerosis shows a network of immune and profibrotic pathways connected with genetic polymorphisms. PLoS Comput Biol. 2015;11(1):e1004005. doi: 10.1371/journal.pcbi.1004005. - DOI - PMC - PubMed

Publication types

MeSH terms