. 2019 Feb 6;7(1):33.
doi: 10.1186/s40425-019-0517-0.

HDAC6 selective inhibition of melanoma patient T-cells augments anti-tumor characteristics

Affiliations

HDAC6 selective inhibition of melanoma patient T-cells augments anti-tumor characteristics

Andressa S Laino et al. J Immunother Cancer. .

Abstract

Background: Therapies targeting anti-tumor T-cell responses have proven successful in the treatment of a variety of malignancies. However, as most patients still fail to respond, approaches to augment immunotherapeutic efficacy are needed. Here, we investigated the ability of histone deacetylase 6 (HDAC6)-selective inhibitors to decrease immunosuppression and enhance immune function of melanoma patient T-cells in ex vivo cultures.

Methods: T-cells were harvested from peripheral blood or tumor biopsies of metastatic melanoma patients and cultured in the presence of pan-, class-specific or class-selective histone deacetylase (HDAC) inhibitors. Changes in cytokine production were evaluated by Luminex and intracellular flow cytometry staining. Expression of surface markers, transcription factors, protein phosphorylation, and cell viability were assessed by flow cytometry. Changes in chromatin structure were determined by ATAC-seq.

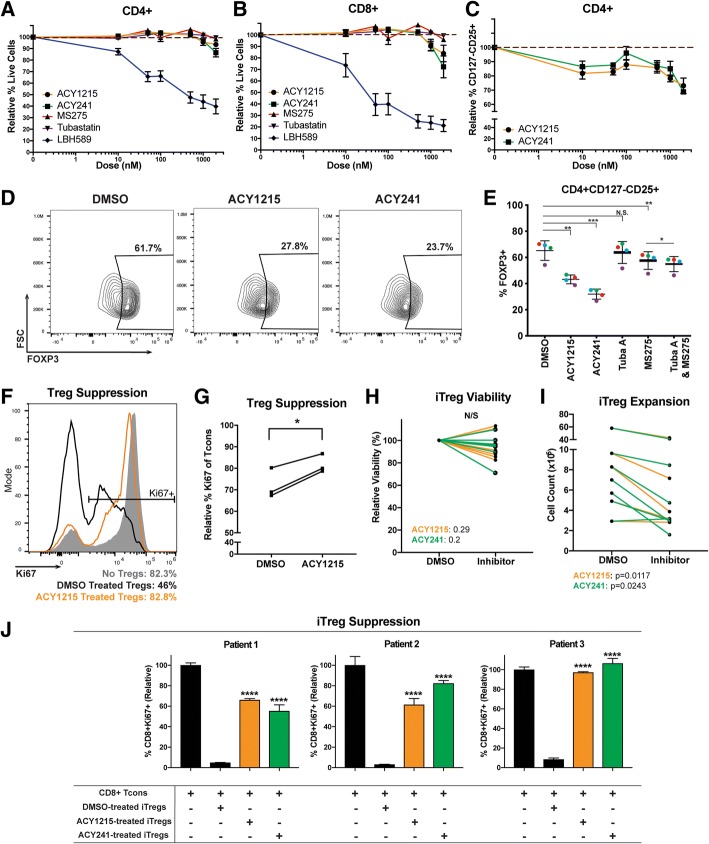
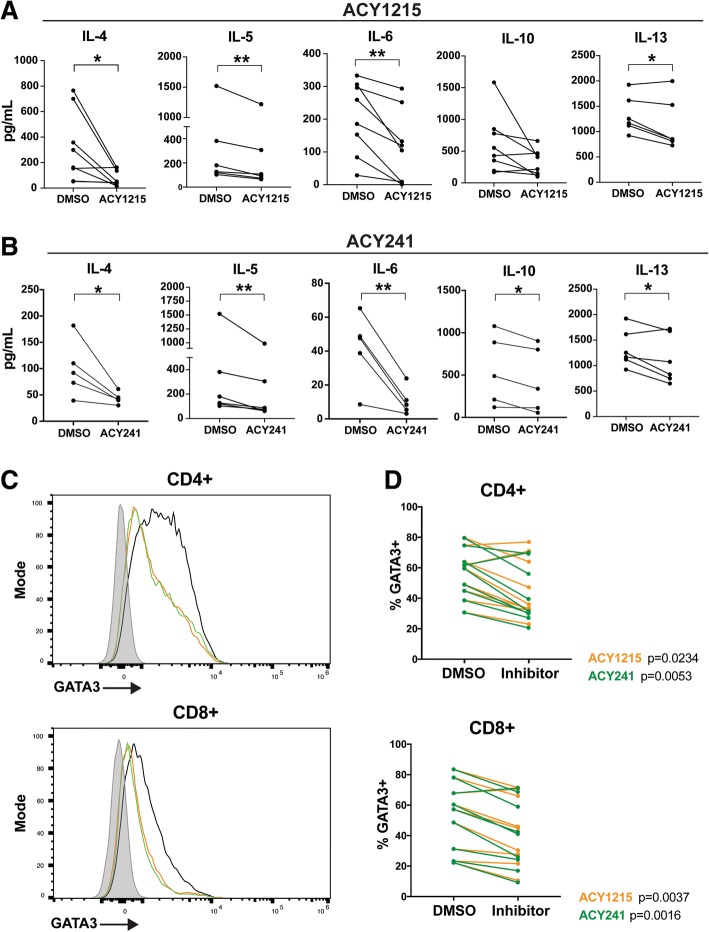
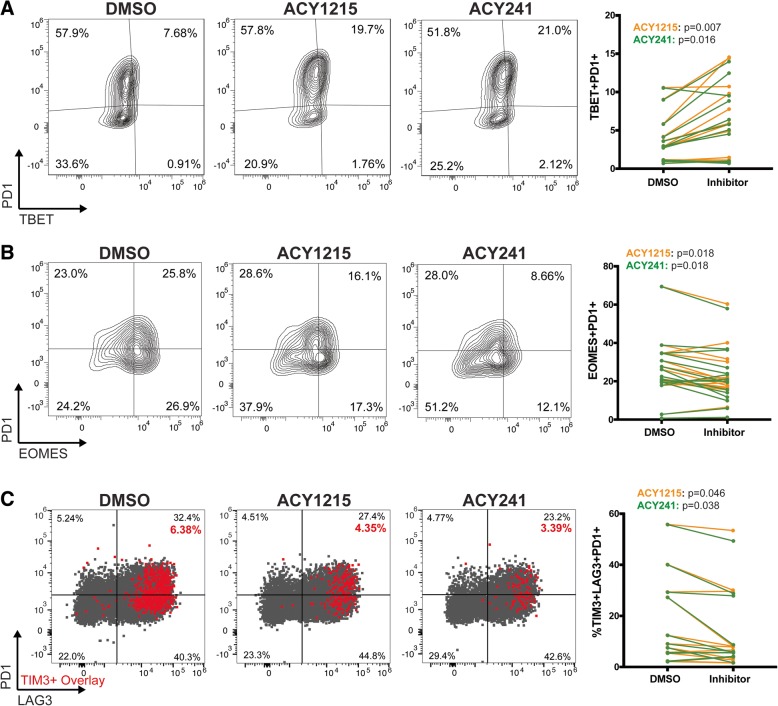
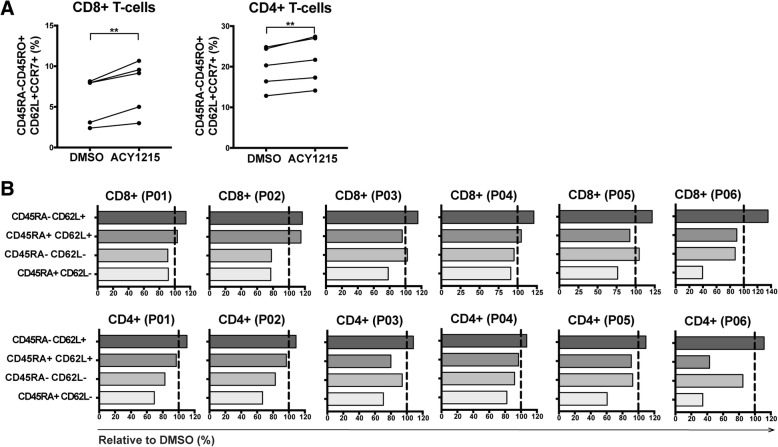
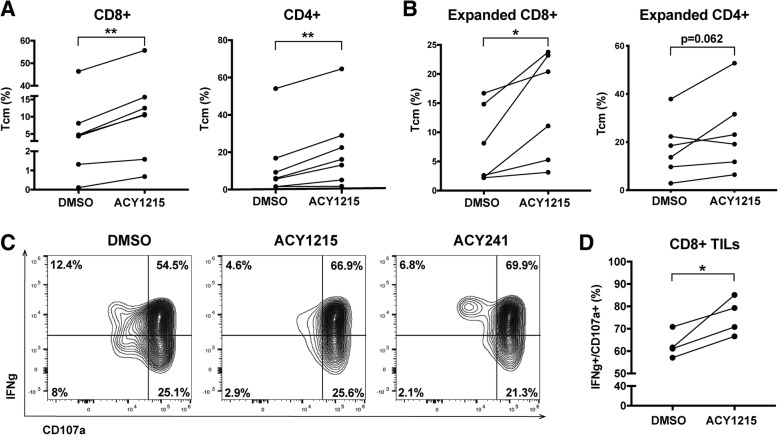
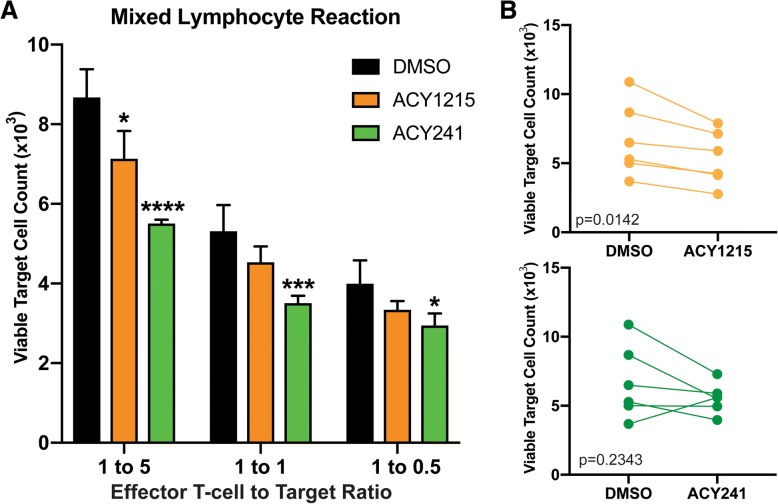
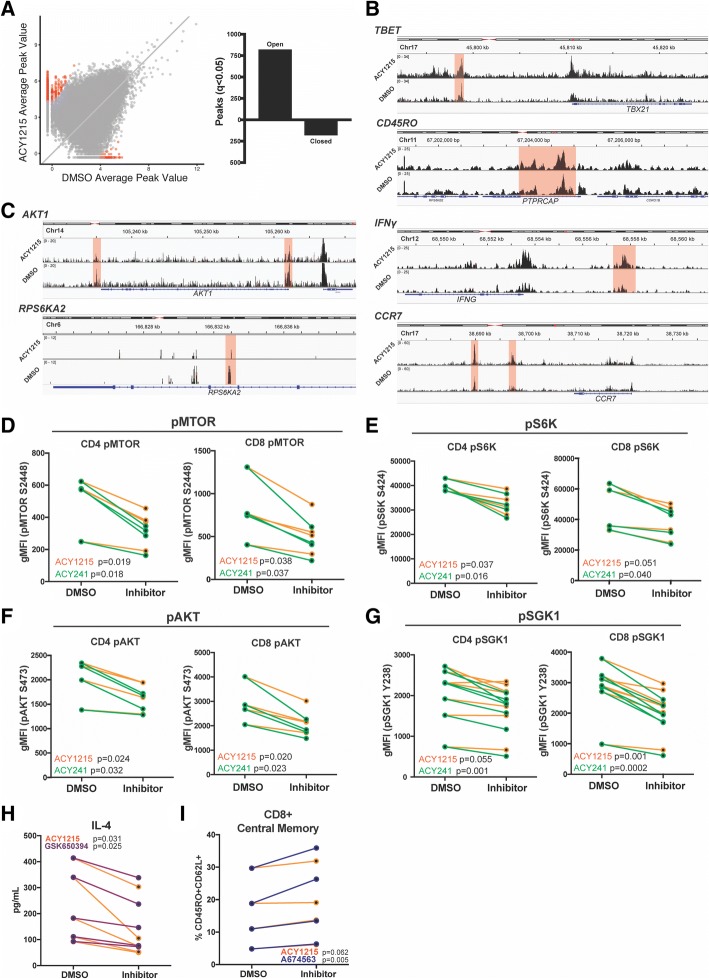
Results: T-cell viability was impaired with low doses of pan-HDAC inhibitors but not with specific or selective HDAC inhibitors. The HDAC6-selective inhibitors ACY-1215 (ricolinostat) and ACY-241 (citarinostat) decreased Th2 cytokine production (i.e. IL-4, IL-5, IL-6, IL-10 and IL-13). Expansion of peripheral blood T-cells from melanoma patients in the presence of these inhibitors resulted in downregulation of the Th2 transcription factor GATA3, upregulation of the Th1 transcription factor T-BET, accumulation of central memory phenotype T-cells (CD45RA-CD45RO + CD62L + CCR7+), reduced exhaustion-associated phenotypes (i.e. TIM3 + LAG3 + PD1+ and EOMES+PD1+), and enhanced killing in mixed lymphocyte reactions. The frequency, FOXP3 expression, and suppressive function of T regulatory cells (Tregs) were decreased after exposure to ACY-1215 or ACY-241. Higher frequencies of T-cells expressing CD107a + IFNγ+ and central memory markers were observed in melanoma tumor-infiltrating lymphocytes (TIL), which persisted after drug removal and further expansion. After ACY-1215 treatment, increased chromatin accessibility was observed in regions associated with T-cell effector function and memory phenotypes, while condensed chromatin was found in regions encoding the mTOR downstream molecules AKT, SGK1 and S6K. Decreased phosphorylation of these proteins was observed in ACY-1215 and ACY-241-treated T-cells. AKT- and SGK1-specific inhibition recapitulated the increase in central memory frequency and decrease in IL-4 production, respectively, similar to the observed effects of HDAC6-selective inhibition.

Conclusions: HDAC6-selective inhibitors augmented melanoma patient T-cell immune properties, providing a rationale for translational investigation assessing their potential clinical efficacy.

Keywords: ACY-1215; ACY-241; Central memory; Exhaustion; HDAC inhibitor; HDAC6; Melanoma; Regulatory T-cell; T-cells.


Conflict of interest statement

Ethics approval and consent to participate

All protocols were approved by the Institutional Review Board at H. Lee Moffitt Cancer Center (IRB 106509, 107,273; Tampa, FL), and cells were obtained under a Materials Transfer Agreement. Samples were coded with an anonymized 5-digit number and their identity was unknown to those performing the experiments.

Consent for publication

Not applicable.

Competing interests

Andressa S. Laino: Received one-year of grant funding from Acetylon Pharmaceuticals, in 2016.

Brian C. Betts: The author declares no potential conflicts of interest.

Anandharaman Veerapathran: The author declares no potential conflicts of interest.

Igor Dolgalev: The author declares no potential conflicts of interest.

Amod Sarnaik: Paid consultant for Iovance Biotherapeutics Inc. and B4CC Inc., and has received research funding support from Provectus, Iovance and Genentech.

Steven N. Quayle: Former employee and stockholder of Acetylon Pharmaceuticals.

Simon S. Jones: Former employee and stockholder of Acetylon Pharmaceuticals.

Jeffrey S. Weber: Has stock or other ownership in Altor BioScience, Celldex, Biond and CytomX Therapeutics. Has honoraria in Bristol-Myers Squibb, Merck, Genentech, AbbVie, AstraZeneca, Daiichi Sankyo, GlaxoSmithKline, Eisai, Altor BioScience, Amgen, Roche, Ichor Medical Systems, Celldex, CytomX Therapeutics, Nektar, Novartis, Array, WindMIL, Takeda and Sellas. Has consulting or advisory role in Celldex, Ichor Medical Systems, Pieris Pharmaceuticals, Altor BioScience, Bristol-Myers Squibb, Merck, Genentech, Roche, Amgen, AstraZeneca, GlaxoSmithKline, Daiichi Sankyo, AbbVie, Eisai, CytomX Therapeutics, Nektar, Novartis, Array, WindMIL, Takeda and Sellas. Received research funding (to the Institution) from Bristol-Myers Squibb, Merck, GlaxoSmithKline, Genentech, Astellas Pharma, Incyte, Roche and Novartis. Received one-year of grant funding from Acetylon Pharmaceuticals. Received travel, accommodations, expenses from Bristol-Myers Squibb, GlaxoSmithKline, Daiichi Sankyo, Roche, Celldex, Amgen, Merck, AstraZeneca, Genentech, Novartis, Incyte, WindMIL and Takeda.

David M. Woods: Received research funding from Mirati Therapeutics, in 2016 and 2017. Has stock in Bristol-Myers Squibb, Merck, GlaxoSmithKline, Seattle Genetics, Mirati Therapeutics, Iovance Biotherapeutics, Cue Biopharma, Fate Therapeutics, Atra Biotherapeutics, and Fortress Biotech.

Publisher’s Note

Springer Nature remains neutral with regard to jurisdictional claims in published maps and institutional affiliations.

Figures

Fig. 1
Fig. 1
ACY-1215 and ACY-241 reduce Treg percentages and suppressive function. (a) CD4+ and (b) CD8+ melanoma patient T-cells were cultured for 72 h with 100IU/mL IL-2, plus ACY-1215 (circles), ACY-241 (squares), MS275 (triangles), Tubastatin A (inverted triangles), LBH589 (diamonds), or DMSO. Viability was assessed by DAPI. Representative experiment assessing three samples is shown; six patients were assessed over two experiments. (c) CD4 + CD127loCD25+ viability was assessed in T-cells cultured with 100IU/mL IL-2 for 72 h, plus ACY-1215 (circles) or ACY-241 (squares). Representative experiment assessing three patient samples is shown; eight patients were assessed over three experiments. (a-c) Y-axis displays the mean viability (±SEM) relative to DMSO; X-axis indicates inhibitor doses. (d) FOXP3 expression was assessed in CD4 + CD127loCD25+ Tregs by flow cytometry for ACY-1215 or ACY-241 treatments (500nM). Representative contour plots for one sample are shown; four patients were assessed. (e) FOXP3 expression was evaluated in additional four samples over two experiments, each denoted by a color, treated with the indicated nhibitors. (f) DMSO (black histogram) or ACY-1215 500nM (orange histogram) pre-treated nTregs from one patient were co-cultured with autologous CD8+ Tcons (1:5 Treg:CD8+). Ki67 expression in CD8+ T-cells was assessed after five days. Control (only CD8+, no nTregs) is shown in grey. (g) nTreg suppression was assessed in three samples in an independent experiment, using CD4+ Tcons. The percentage of Ki67 expressing CD4 + FOXP3- Tcon cells is shown. (h-i) CD4+ naïve-derived iTregs from seven patient samples were expanded and treated with DMSO or 500nM ACY-1215 over four experiments. (h) Relative viability and (i) cell counts were assessed by Trypan Blue seven days after culture. (j) iTregs from three patients were expanded and treated with DMSO or 500nM ACY-1215 over three experiments. Autologous CD8+ T-cells were co-cultured with iTregs, activated for 48-72h, and assessed for Ki67 expression. Proliferation percentages relative to control (Tcons only) are shown. *p < 0.05, **p < 0.01, ***p < 0.001, ****p < 0.0001
Fig. 2
Fig. 2
ACY-1215 and ACY-241 decrease Th2 cytokine production by T-cells. T-cells isolated from melanoma patient PBMC samples were treated with DMSO, (a) ACY-1215 500nM, or (b) ACY-241500nM, and activated for 72 h. Supernatant cytokines were assessed by Luminex. At least five patient samples were evaluated across three experiments for each cytokine and HDACi treatment assessed. Each paired line represents an individual patient sample. *p < 0.05, **p < 0.01. (c) GATA3 expression was assessed by flow cytometry in T-cells treated with DMSO, ACY-1215 500nM, or ACY-241500nM, and activated for 72 h. Representative histograms for CD4+ and CD8+ T-cells are shown for DMSO (black), ACY-1215 (orange), ACY-241 (green) and fluorescence minus one (FMO) control (grey). (d) CD4+ and CD8+ T-cells expressing GATA3 in DMSO control and paired inhibitor-treated samples are graphed. (c-d) Results shown are from nine patients evaluated across three experiments
Fig. 3
Fig. 3
T-cells cultured with ACY-1215 or ACY-241 have reduced exhaustion associated phenotypes. T-cells from melanoma patient PBMCs were expanded with the indicated inhibitor (500nM), activated for 24 h, and evaluated by flow cytometry. Representative contour plots and paired analyses of percentages of CD8+ T-cells expressing (a) PD1 and TBET from twelve samples, (b) PD1 and EOMES from fifteen samples and (c) CD8+ T-cells expressing PD1, TIM3 and LAG3 from eleven samples are shown. Representative dot plots of PD1 vs LAG3 expression with TIM3+ cells overlaid in red are shown along with paired analyses (ACY-1215: orange lines, ACY-241 green lines). (a-c) Results shown are from over eleven patient samples assessed in three to five experiments. Each paired line represents an individual patient sample
Fig. 4
Fig. 4
ACY-1215 increases the percentage of central memory T-cells. T-cells isolated from melanoma patient PBMC samples were expanded with DMSO or ACY-1215 500nM. (a) Paired analysis of CD45RA-CD45RO + CD62L + CCR7+ percentages after DMSO versus ACY-1215 treatment of five patient samples assessed. (b) CD8+ and CD4+ T-cells from six patients (P01–06) were assessed by flow cytometry for relative changes in the subsets: CD45RA-CD62L+ (central memory, Tcm), CD45RA + CD62L+ (Tnaïve), CD45RA-CD62L- (effector memory, Tem) and CD45RA + CD62L- (effector, Teff). Changes were calculated relative to DMSO, illustrated by the vertical black lines. (a-b) Samples were evaluated across three independent experiments. **p < 0.01
Fig. 5
Fig. 5
ACY-1215 and ACY-214 alter TIL phenotype. TILs harvested from resected melanoma tumors were expanded with 500nM ACY-1215 or DMSO. (a) CD8+ and CD4+ T-cells central memory percentages were assessed in six patient samples across four experiments based on CD45RO + CD62L+, CD45RA-CD62L+, CD45RA-CCR7+ or CD45RO + CD45RA-CD62L+ gating strategies. (b) After expansion, TILs were washed, activated and evaluated for the percent of CD45RO + CD62L+ or CD45RA-CD62L+ subsets. Data are from six patient samples assessed across four experiments. (c) TILs expanded with 500nM ACY-1215, 500nM ACY-241 or DMSO were stimulated with PMA/Ionomycin and monensin-treated for four hours. Intracellular IFNγ and CD107a expression was assessed by flow cytometry. Representative contour plots of CD8+ TILs from one out of four patient samples assessed are shown. (d) Paired analysis of DMSO versus ACY-1215 treated CD8+ IFNγ+CD107a + TILs are shown for all four patients assessed across three experiments. *p < 0.05
Fig. 6
Fig. 6
ACY-1215 Augments T-cell Cytotoxicity. T-cells from melanoma patient PBMC were expanded with DMSO, 500nM ACY-1215 or 500nM ACY-241, washed, then co-cultured with CFSE-labeled, irradiated allogeneic PBMC (target cells). (a) The numbers of viable target cells after co-culture are shown in a representative sample from one patient cultured at the indicated ratios (T-effector:Target) (triplicates assessed) and (b) in paired analyses of DMSO versus ACY-1215 and DMSO versus ACY-241 at 1:5 T-effector:Target ratio. Data are from six patient samples evaluated in two experiments. Error bars are +SEM. *p < 0.05, ***p < 0.001, ****p < 0.0001
Fig. 7
Fig. 7
ACY-1215 alters chromatin accessibility of T-cells and downregulates mTOR signaling pathways. (a-c) ATAC-seq was performed in T-cells from three melanoma patient PBMCs following expansion with 500nM ACY-1215 or DMSO. (a) Scattered dot plot displaying significant peaks (red dots; q < 0.05) of open versus closed chromatin in ACY-1215-treated over DMSO control. Representative (b) open peaks in T-BET, CD45RO, IFNγ and CCR7 gene regions, and (c) closed peaks in AKT and S6K gene regions, in ACY-1215-treated over DMSO control. Significant regions are highlighted in red. All samples were adjusted for false discovery rate (FDR). Three patient samples were assessed. (d-g) After T-cell expansion with DMSO or HDACi, phosphorylation of (d) mTOR S2448, (e) S6K S424, (f) AKT S473 and (g) SGK1 Y238 in CD4+ and CD8+ T-cells was determined by flow cytometry and the geometric mean fluorescence (gMFI) graphed. At least four patient samples were assessed in two to three experiments for each phosphorylated marker evaluated. Each paired line represents an individual patient sample. (h) T-cells from five patient samples in two experiments were treated with GSK650394 100nM (SGK1 inhibitor), ACY-1215 500nM, or DMSO, activated and assessed for IL-4 secretion after 72 h. (i) CD8+ T-cells from four patient samples in two experiments were evaluated by flow cytometry for CD45RO + CD62L+ central memory percentage after expansion in A674563 50nM (AKT inhibitor) or ACY-1215 500nM. Comparisons were made against DMSO

References

    1. Kienzle N, Olver S, Buttigieg K, Groves P, Janas ML, Baz A, Kelso A. Progressive differentiation and commitment of CD8+ T cells to a poorly cytolytic CD8low phenotype in the presence of IL-4. J Immunol. 2005;174:2021–2029. doi: 10.4049/jimmunol.174.4.2021. - DOI - PubMed
    1. Shiao SL, Ruffell B, DeNardo DG, Faddegon BA, Park CC, Coussens LM. TH2-polarized CD4(+) T cells and macrophages limit efficacy of radiotherapy. Cancer Immunol Res. 2015;3:518–525. doi: 10.1158/2326-6066.CIR-14-0232. - DOI - PMC - PubMed
    1. De Monte L, Reni M, Tassi E, Clavenna D, Papa I, Recalde H, Braga M, Di Carlo V, Doglioni C, Protti MP. Intratumor T helper type 2 cell infiltrate correlates with cancer-associated fibroblast thymic stromal lymphopoietin production and reduced survival in pancreatic cancer. J Exp Med. 2011;208:469–478. doi: 10.1084/jem.20101876. - DOI - PMC - PubMed
    1. Sakaguchi S, Wing K, Onishi Y, Prieto-Martin P, Yamaguchi T. Regulatory T cells: how do they suppress immune responses? Int Immunol. 2009;21:1105–1111. doi: 10.1093/intimm/dxp095. - DOI - PubMed
    1. Wherry EJ, Blattman JN, Murali-Krishna K, van der Most R, Ahmed R. Viral persistence alters CD8 T-cell immunodominance and tissue distribution and results in distinct stages of functional impairment. J Virol. 2003;77:4911–4927. doi: 10.1128/JVI.77.8.4911-4927.2003. - DOI - PMC - PubMed

Publication types

MeSH terms