. 2019 Mar;7(3):510-525.
doi: 10.1158/2326-6066.CIR-18-0054. Epub 2019 Feb 6.

Immune-Checkpoint Blockade Opposes CD8+ T-cell Suppression in Human and Murine Cancer

Affiliations

Immune-Checkpoint Blockade Opposes CD8+ T-cell Suppression in Human and Murine Cancer

Lukas W Pfannenstiel et al. Cancer Immunol Res. 2019 Mar.

Abstract

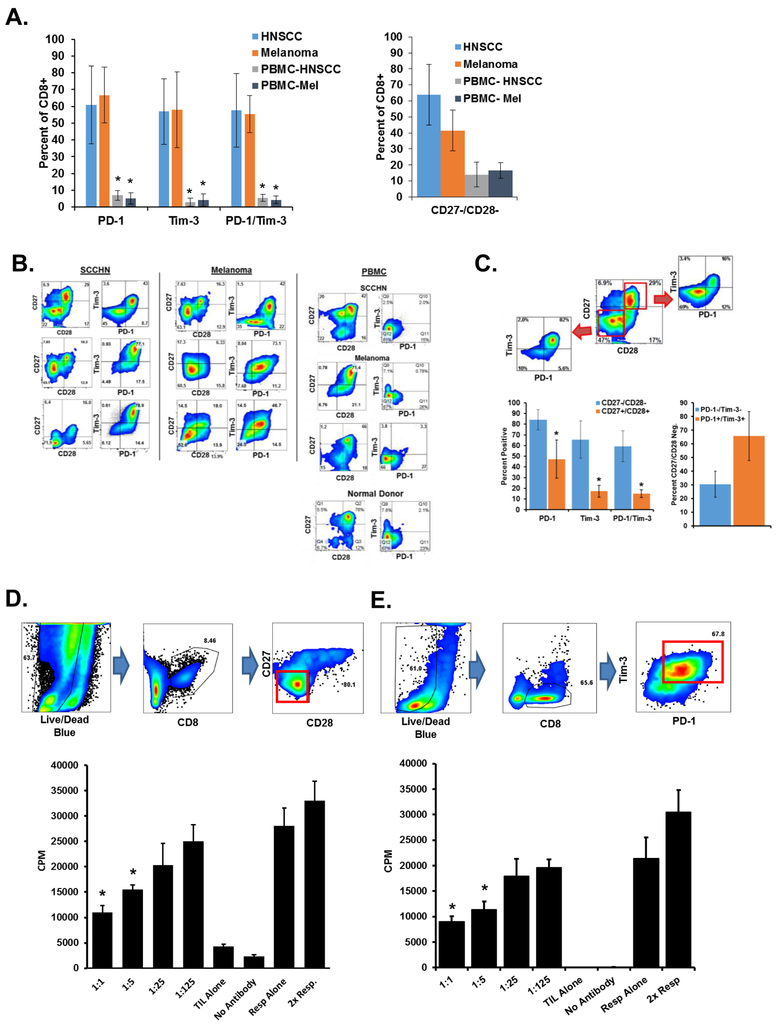
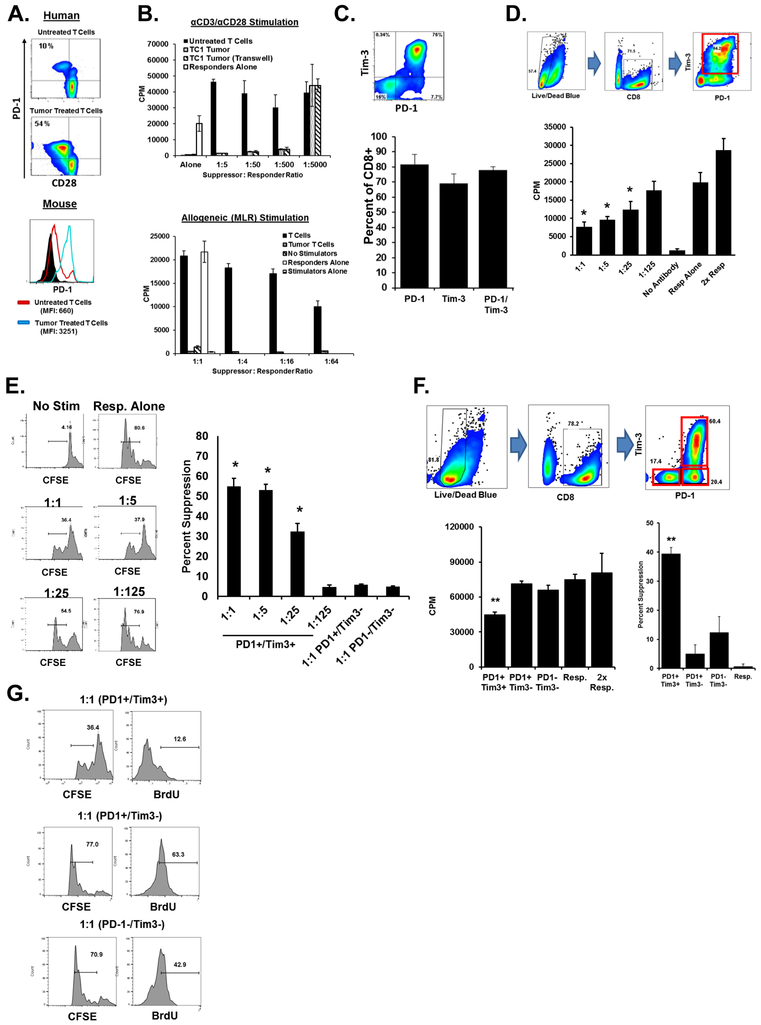
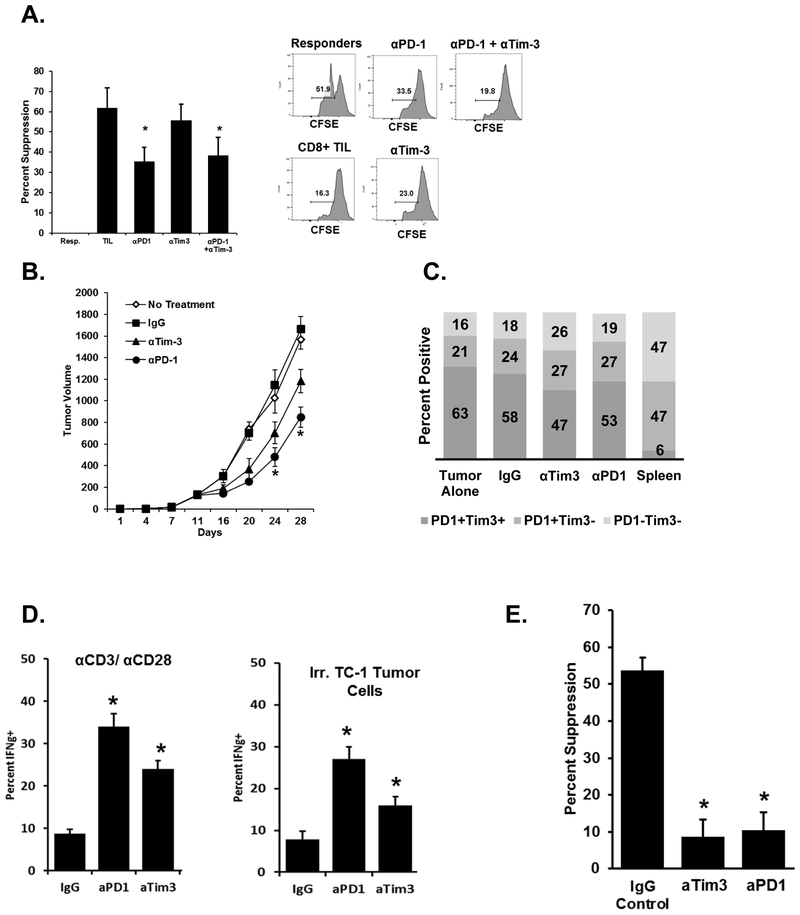
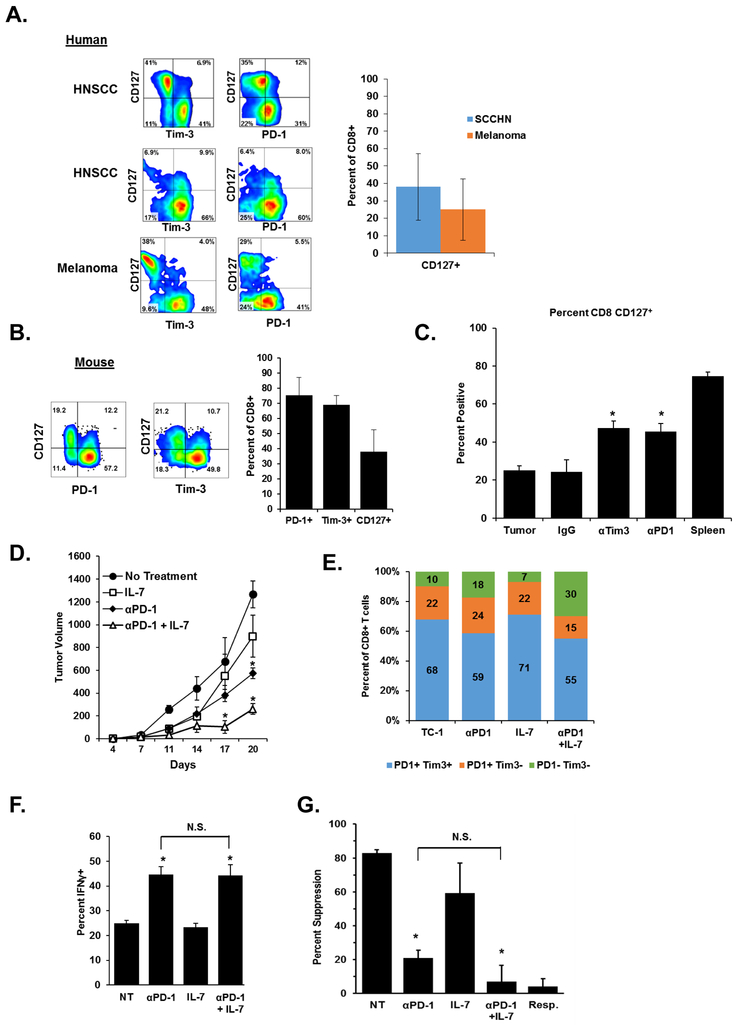
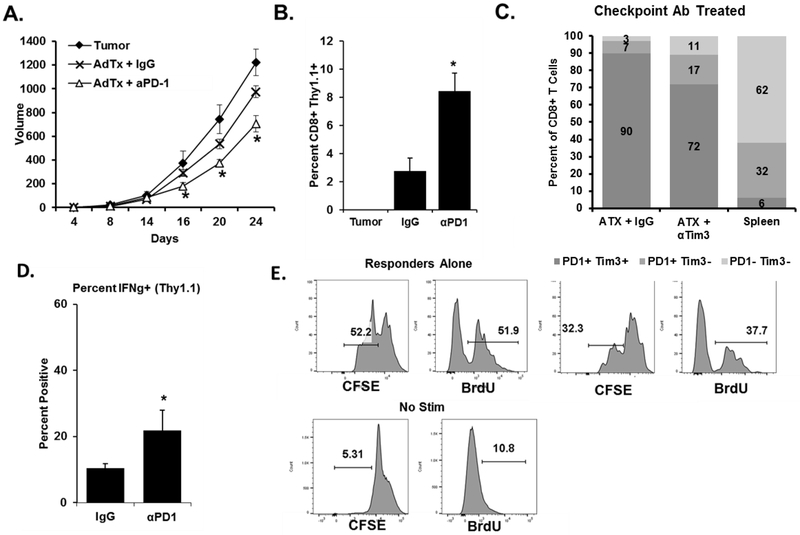
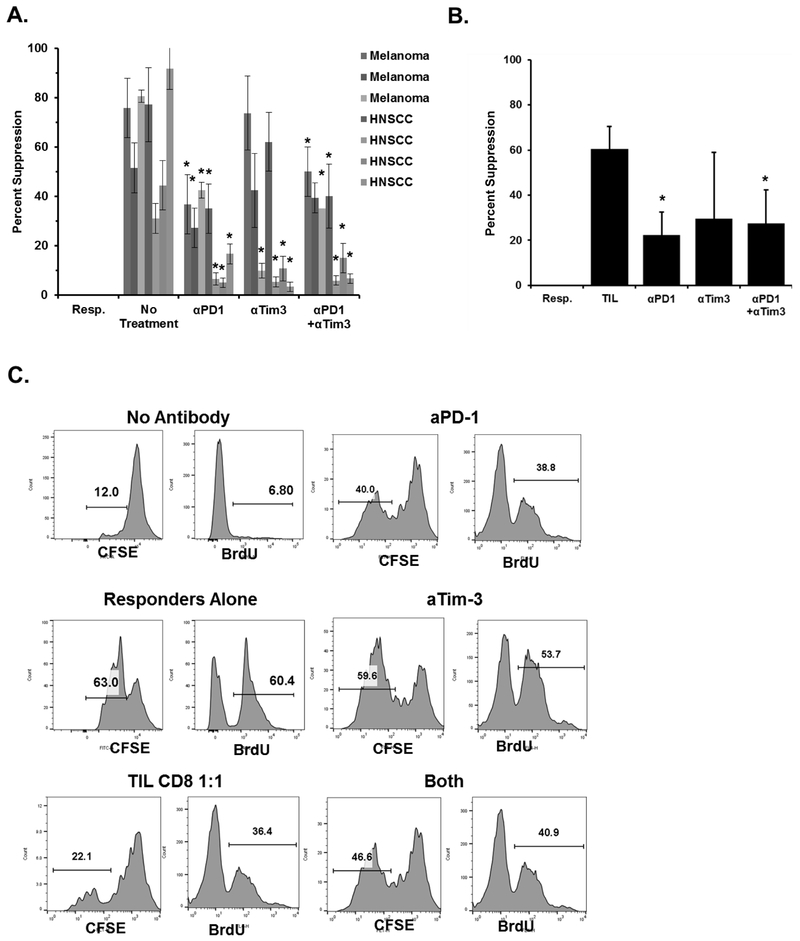
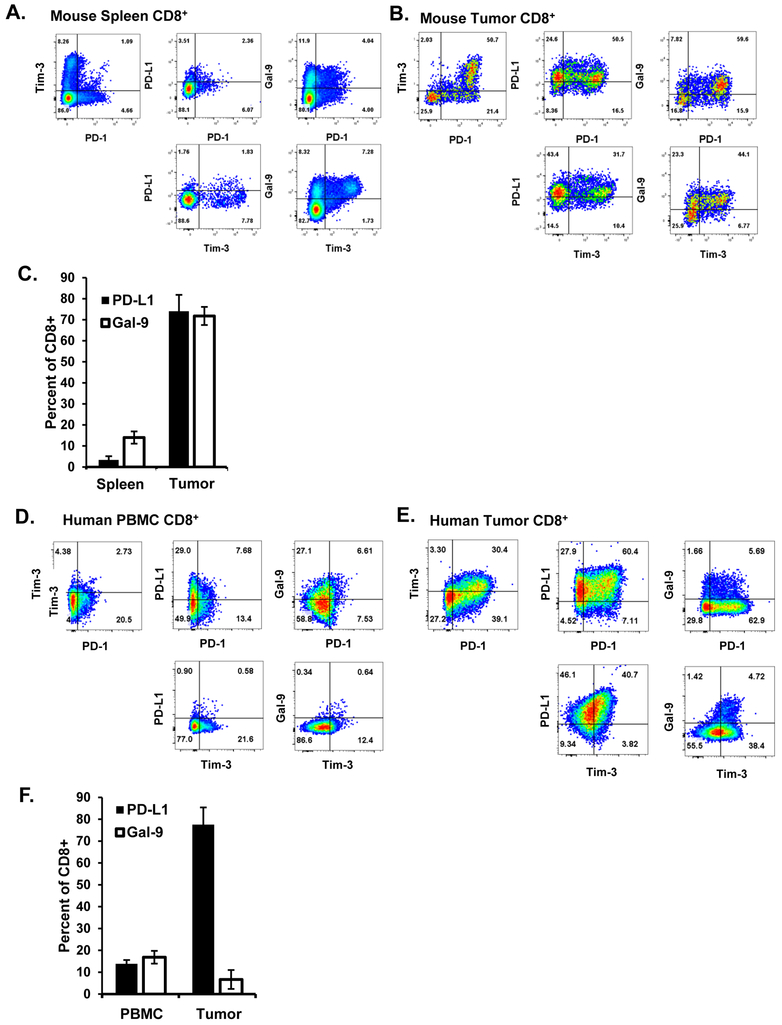
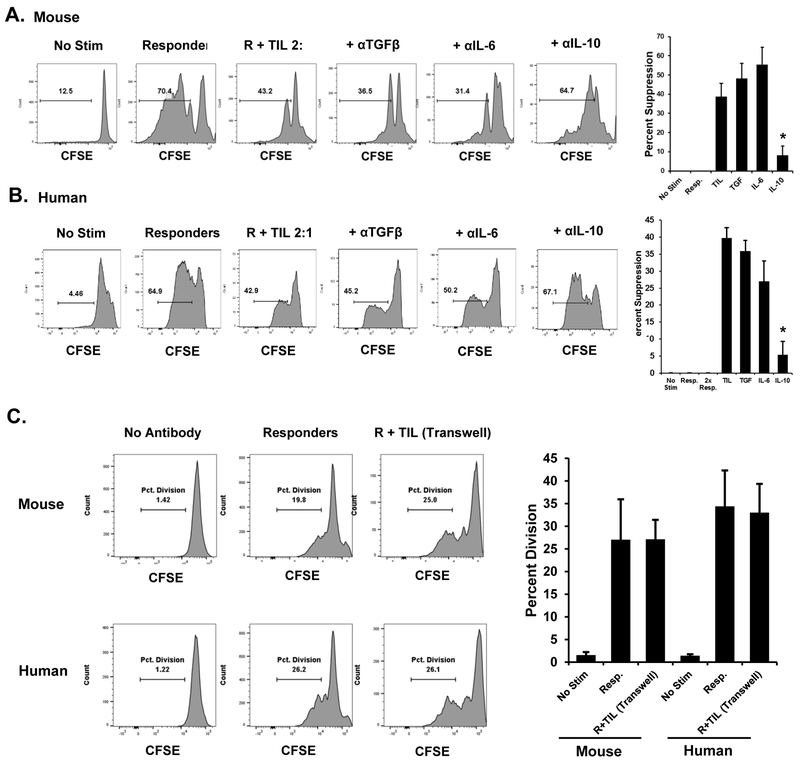
Immune-checkpoint blockade enhances antitumor responses against cancers. One cancer type that is sensitive to checkpoint blockade is squamous cell carcinoma of the head and neck (SCCHN), which we use here to study limitations of this treatment modality. We observed that CD8+ tumor-infiltrating lymphocytes (TILs) in SCCHN and melanoma express excess immune checkpoints components PD-1 and Tim-3 and are also CD27-/CD28-, a phenotype we previously associated with immune dysfunction and suppression. In ex vivo experiments, patients' CD8+ TILs with this phenotype suppressed proliferation of autologous peripheral blood T cells. Similar phenotype and function of TILs was observed in the TC-1 mouse tumor model. Treatment of TC-1 tumors with anti-PD-1 or anti-Tim-3 slowed tumor growth in vivo and reversed the suppressive function of multi-checkpoint+ CD8+ TIL. Similarly, treatment of both human and mouse PD-1+ Tim-3+ CD8+ TILs with anticheckpoint antibodies ex vivo reversed their suppressive function. These suppressive CD8+ TILs from mice and humans expressed ligands for PD-1 and Tim-3 and exerted their suppressive function via IL10 and close contact. To model therapeutic strategies, we combined anti-PD-1 blockade with IL7 cytokine therapy or with transfer of antigen-specific T cells. Both strategies resulted in synergistic antitumor effects and reduced suppressor cell function. These findings enhance our understanding of checkpoint blockade in cancer treatment and identify strategies to promote synergistic activities in the context of other immunotherapies.


Conflict of interest statement

Conflict of Interest Statement: The authors declare that no conflict of interest exists.

Figures

Figure 1.
Figure 1.. CD8+ dysfunctional T cells in the human tumor microenvironment.
Tumor tissue was dissociated and indicated surface markers were stained. PBMCs were isolated from matching patient whole blood. A. Marker expression from eight SCCHN and seven melanoma patients. Error bars represent standard deviation. *P < 0.05 for expression of each marker (or group) as compared to the PBMC group using a student’s T test. B. Representative flow cytometry stains of indicated patient SCCHN or melanoma tumors and PBMC. Plots are gated on CD3+ and CD8+ cells. C. Human tumor tissues from A. were gated on CD27 & CD28 expression and the PD-1+ Tim-3+ expression of these populations are represented (middle) with a representative dot plot (left) of a SCCHN patient used in panel A. CD27 CD28 CD8+ cells from the same patients were assessed for PD-1 and Tim-3 (right). Error bars indicate standard deviation. *P < 0.05 for the CD27+/CD28+ group vs. the CD27/CD28 group for each marker. D. CD3+ CD8+ PD-1+ Tim-3+ and CD3+ CD8+ CD27 CD28 cells were sorted from SCCHN tissue. Dot plots demonstrate gating to exclude tumor cells. Plots of ungated purified cells can be found in Supplementary Fig. S1A. Purified cells were then used in an in vitro suppression assays with autologous T cells. Proliferation was determined by 3H-thymidine incorporation. Ratios indicate the number of suppressors to responders. Resp. = responders alone. Controls are using equivalent numbers of responder cells alone. E. CD3+ CD8+ PD-1+ Tim-3+ cells were sorted from SCCHN tumor tissue and used in ex vivo suppression assays. Ungated plots of sorted cells can be found in Supplementary Fig. S1B. Indicated data are representative of at least three independent experiments. Error bars represent SD of replicate wells for each condition. *P <0.05 for the responders as compared to each experimental group using a student’s t test.
Figure 2.
Figure 2.. Development of an animal model of CD8+ TIL suppression in SCCHN.
A. CD8+ T cells purified from normal human donor PBMCs or from mouse splenocytes were incubated with equal numbers of TU167 (a human cell line) or TC-1 (a mouse cell line) for six hours. Cells were separated by transwell inserts. T cells were then washed and cultured for five days followed by staining for CD8, CD28, and PD-1 (for human cells) or CD8, Tim3, and PD-1 expression (for mouse cells). B. CD8+ T cells were purified from mouse splenocytes and incubated with TC-1 tumor either directly or separated by a transwell insert for six hours. Cells were then separated and cultured for five days followed by use in in vitro suppression assays. Cells were stimulated with either anti-CD3/CD28 (top) or allogeneic splenocytes (bottom). Proliferation was assessed by 3H-thymidine incorporation. C. TC-1 tumors isolated from C57BL/6 mice were dissociated and stained for expression of CD3, CD8, and the indicated markers. Dot plots are gate on CD3+ CD8+ cells. Bar graphs represent at least 10 separate tumor samples. Error bars represent SD. D. CD3+ CD8+ cells were purified from dissociated TC-1 tumors using magnetic bead positive selection followed by use as suppressor cells in in vitro suppression assays. Ungated plots of sorted cells can be found in Supplementary Fig. S1C. Cells were incubated for 72h. E. In similar studys, responders were labeled with CFSE. Bar graph indicates percent suppression and incorporates three independent experiments. Histograms are representative. F. CD3+ CD8+ TILs from dissociated TC-1 tumors were sorted by PD-1 and Tim-3 expression into three groups as indicated. Plots of sorted cells can be found in Supplementary Fig. S1D. Purified cells were then used in in vitro suppression assays and proliferation was used to calculate percent suppression. G. Responders from F. were also labeled with CFSE and BrdU. Error bars represent standard deviation of replicate wells. Data is representative of at least three independent experiments. **P <0.01 for indicated population as compared to responders alone using a student’s t test.
Figure 3.
Figure 3.. Blockade of checkpoint inhibitor proteins in vivo inhibits the suppressive function of CD8+ TILs and enhances antitumor immunity.
A. PD-1+ Tim-3+ CD8+ T cells were sorted from dissociated TC-1 tumors and used in ex vivo suppression assays. Antibodies against PD-1, Tim-3, or both were added to the cocultures. Proliferation was assessed via CFSE dilution or BrdU incorporation. CFSE dilution was used to determine percent suppression. B. TC-1 tumor cells were implanted s.c. into mice (n=10 per group). Five days later treatment groups received 100μg of the indicated antibodies i.p. Injections were repeated every three days thereafter. *P <0.05 for the combination group vs. others at the indicated time points using ANOVA analysis. C. At the conclusion of the study, expression of PD-1 and Tim-3 on CD8+ TILs was assessed by flow cytometry (n = 10 tumors per group). For comparison, splenocytes from non-tumor-bearing mice were stained with a similar panel. D. CD8+ TILs were purified from tumor digests using magnetic beads and stimulated in vitro as indicated for 12 hours (N = 10 per group, representative of three independent studies). Cells were then stained for interferon-γ expression. E. CD8+ PD-1+ Tim-3+ TILs were sorted from tumors as and used in in vitro suppression assays. Data are reported as the percent suppression as compared to responders alone. Error bars indicate standard deviation. *P <0.05 for the indicated treatment groups vs IgG control using a Student t test.
Figure 4.
Figure 4.. Treatment with IL7 synergizes with anti-PD-1 blockade to enhance antitumor immune responses.
A. Tumor tissue from two HNSCC and one melanoma patient were stained for expression of CD127, PD-1, and Tim-3 on CD3+ CD8+ T cells. Graphs indicate the percentage of CD127 on tumor-resident T cells in twelve HNSCC and melanoma patients or normal donor PBMC. B. Expression of CD127 on CD8+ TILs from TC-1 tumors. Graphs indicate the percentage of PD-1, Tim-3, and CD127+ cells in six tumors. C. Expression of CD127 was assessed on CD8+ TILs from tumors treated with the indicated antibodies or combinations as used in Fig. 3. Similar staining of splenocyte CD8+ T cells is included as a comparison. D. TC-1 tumor cells were implanted s.c. into mice (n=10 per group). Five days later, treatment groups received 100μg of anti-PD-1 i.p. Injections were repeated every three days thereafter. IL7 treated mice received 10μg rhIL7 i.p. every 24 hours for seven days. *P <0.05 for the combination group vs. others at the indicated time points. E. At the conclusion of the study, PD-1 and Tim-3 expression on CD8+ T cells was determined (n = 8 mice per group). F. CD8+ TILs were purified from tumor digests using magnetic beads and stimulated in vitro for 12 hours followed by staining for IFNγ expression (N = 8 mice per group, representative of three independent experiments). “NT” indicates the no-treatment control group. G. CD3+ CD8+ PD-1+ Tim-3+ TILs were sorted and used in in vitro suppression assays. Data are reported as percent suppression as compared to responders alone. Error bars indicate standard deviation. *P <0.05 for the IgG treated group vs. other treatments using a student’s t test.
Figure 5.
Figure 5.. Checkpoint inhibitor blockade enhances antitumor treatment by CD8+ adoptive T-cell transfer.
A. TC-1 tumors were implanted into mice on day 0 followed by adoptive transfer of purified E7 TCRβ T cells and 100µg of anti-PD-1 or control antibodies i.p. on day 5 (n=10 per group). Antibody treatment was repeated every three days. Tumor growth (n = 8 per group) was measured at the indicated time points. *P < 0.05 for the combination treatment vs other groups using ANOVA at the indicated time points. B. At the conclusion of the study, the percentage of adoptively transferred cells in the total TIL population was determined. Error bars indicate standard deviation. C. Concurrently, TILs were stained for PD-1 and Tim-3 expression. Similar staining of splenocyte CD8+ T cells from a non-tumor-bearing mouse is also displayed for comparison. D. CD8+ TILs were then restimulated in vitro and interferon-γ production was assessed. Error bars indicate standard deviation, *P < 0.05 for the anti-PD-1 treated group vs control. E. PD-1+ Tim-3+ CD8+ Thy1.1+ TILs pooled from 8 mice were used in ex vivo suppression assays using CFSE dilution and BrdU incorporation as a readout of proliferation. Histograms are representative of three experiments.
Figure 6.
Figure 6.. Checkpoint inhibitor blockade ex vivo reduces the suppressive function of CD8+ TIL.
A. Melanoma and SCCHN tumors from human patients were dissociated and CD3+ CD8+ PD-1+ Tim-3+ TILs were purified by sorting and then used in in vitro suppression assays with autologous PBMC T cells. Antibodies against the indicated checkpoint inhibitor proteins were added during the co-incubation. *P <0.05 for the indicated groups vs. the no-treatment group from the same patient using a student’s t test. B. Percent suppression of each treatment group as compared to responders alone and is cumulative of all samples in A. Error bars indicate the standard deviation of replicate wells. C. CD3+ CD8+ PD-1+ Tim-3+ TILs from a human melanoma patient were purified by sorting and used in vitro suppression assays with purified T cells from PBMC’s from the same patient as described in A using CFSE dilution or BrdU incorporation. Histograms are representative of three replicates.
Figure 7.
Figure 7.. PD-1 and Tim-3 ligand expression in the mouse and human tumor microenvironment.
Mouse tissue from (A) spleen and (B) eight TC-1 tumors was stained for the indicated markers. (C) Cumulative percentages of PD-L1+ and Gal-9+ cells . Error bars represent standard deviation. Human (D) PBMCs from three normal donors or from (E) five human melanoma specimans were similarly stained. E, Cumulative percent-positive cells for PD-L1 and Gal-9. Error bars represent standard deviation.
Figure 8.
Figure 8.. Mechanism of suppression by CD8+ TIL.
A,Mouse CD8+ PD-1+ Tim-3+ TILs were FACS-sorted from dissociated TC-1 tumors and used in in vitro suppression assays with the indicated blocking antibodies. Responder cells were labeled with CFSE. At the conclusion of the experiment, cells were analyzed by flow cytometry. Plots are representative of at least three replicates per sample. Data from all replicates were used to calculate percent suppression. B, Similar studies were conducted using PD-1+ Tim-3+ CD8+ T cells FACS-sorted from human patient specimens (n = 4) with autologous T cells as responders. Error bars represent standard deviation between the replicate samples. *P < 0.05 for the anti-IL10 –treated group as compared to the TIL alone group. C, PD-1+ Tim-3+ CD8+ T cells were sorted from TC-1 tumors or human melanoma tumors and used in in vitro suppression assays with autologous responder T cells. Suppressors were physically separated from responder cells via transwell inserts. Responders were seeded onto the anti-CD3/CD28 coated lower plate. Proliferation was assessed by CFSE dilution. Plots are representative of three independent experiments which were used to cumulatively display percent division of each group in the bar graph. Error bars indicate standard deviation.

References

    1. Tumeh PC, Harview CL, Yearley JH, Shintaku IP, Taylor EJ, Robert L, et al. PD-1 blockade induces responses by inhibiting adaptive immune resistance. Nature 2014;515(7528):568–71 doi 10.1038/nature13954. - DOI - PMC - PubMed
    1. Pardoll DM. The blockade of immune checkpoints in cancer immunotherapy. Nat Rev Cancer 2012;12(4):252–64 doi 10.1038/nrc3239. - DOI - PMC - PubMed
    1. Tsushima F, Yao S, Shin T, Flies A, Flies S, Xu H, et al. Interaction between B7-H1 and PD-1 determines initiation and reversal of T-cell anergy. Blood 2007;110(1):180–5 doi 10.1182/blood-2006-11-060087. - DOI - PMC - PubMed
    1. Sakuishi K, Apetoh L, Sullivan JM, Blazar BR, Kuchroo VK, Anderson AC. Targeting Tim-3 and PD-1 pathways to reverse T cell exhaustion and restore anti-tumor immunity. J Exp Med 2010;207(10):2187–94 doi 10.1084/jem.20100643. - DOI - PMC - PubMed
    1. Goldberg P FDA Eager to Approve PD-1 and PD-L1 Drugs in Novel Combinations, New Settings The Cancer Letter 2016. November 11, 2016:1–6.

Publication types

MeSH terms