. 2019 Apr 1;218(4):1250-1264.
doi: 10.1083/jcb.201805036. Epub 2019 Feb 6.

PLK1 plays dual roles in centralspindlin regulation during cytokinesis

Affiliations

PLK1 plays dual roles in centralspindlin regulation during cytokinesis

Ingrid E Adriaans et al. J Cell Biol. .

Abstract

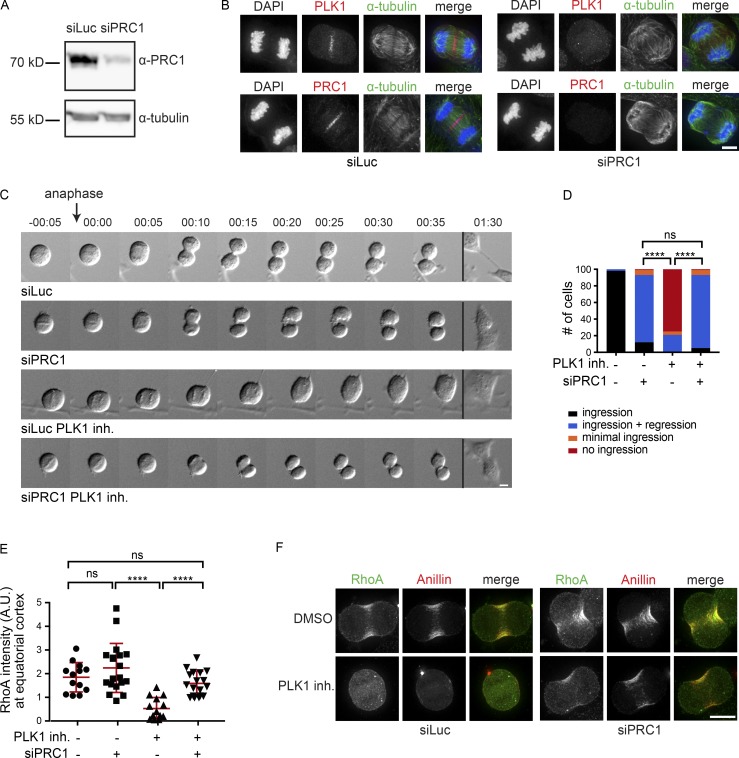
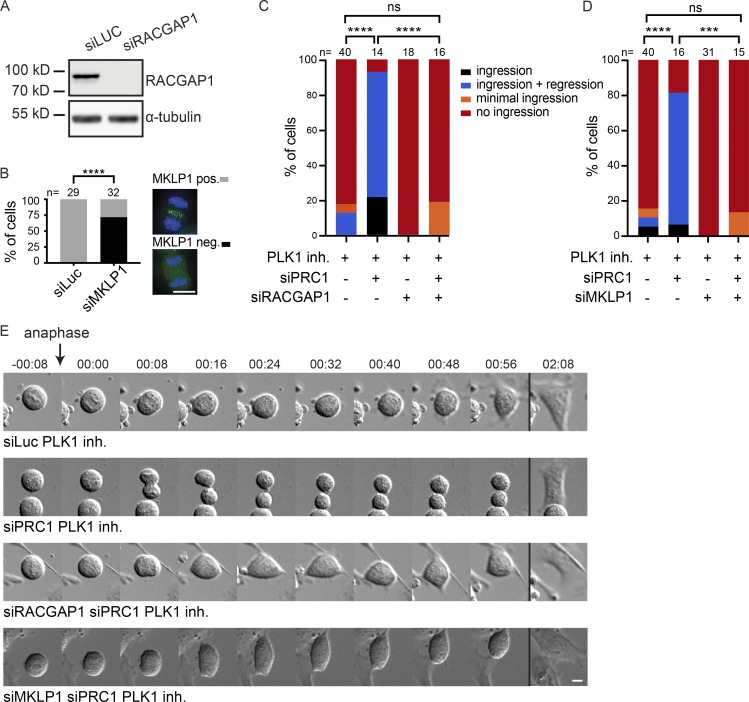
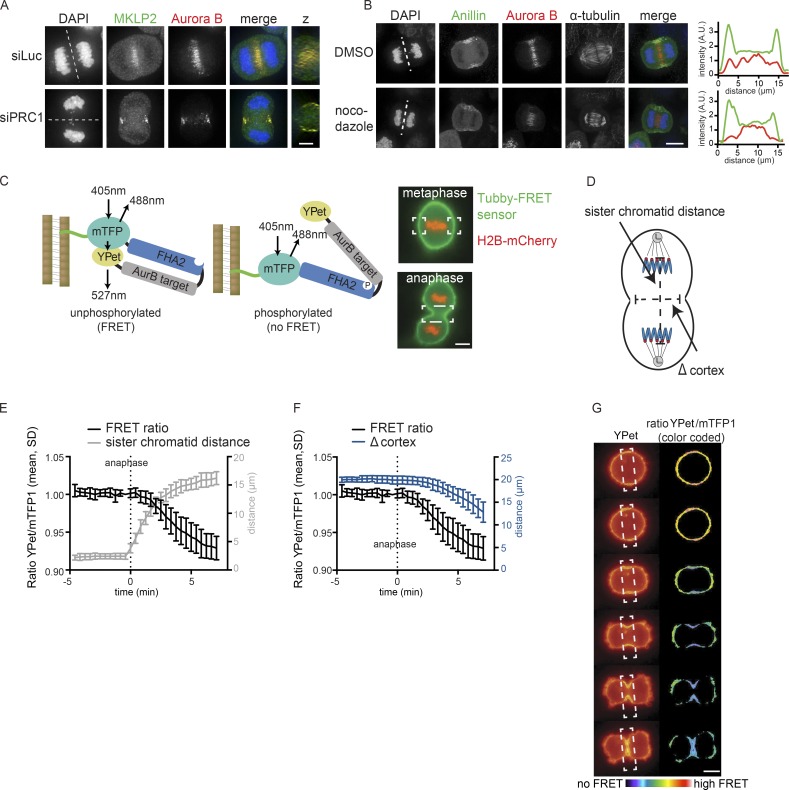
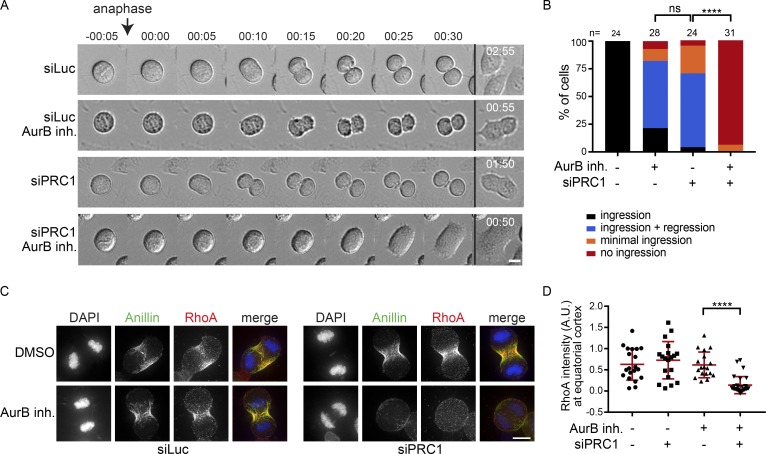
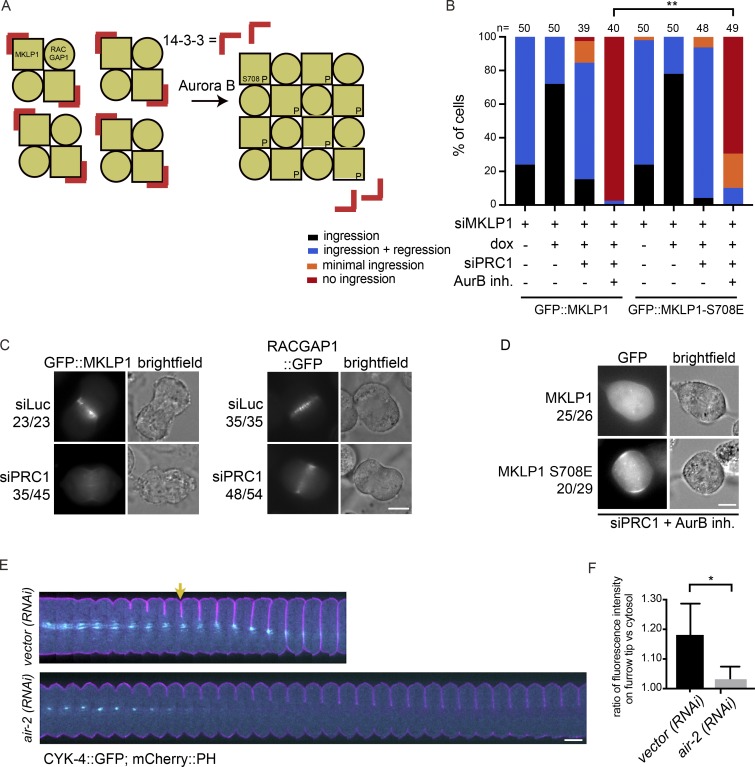
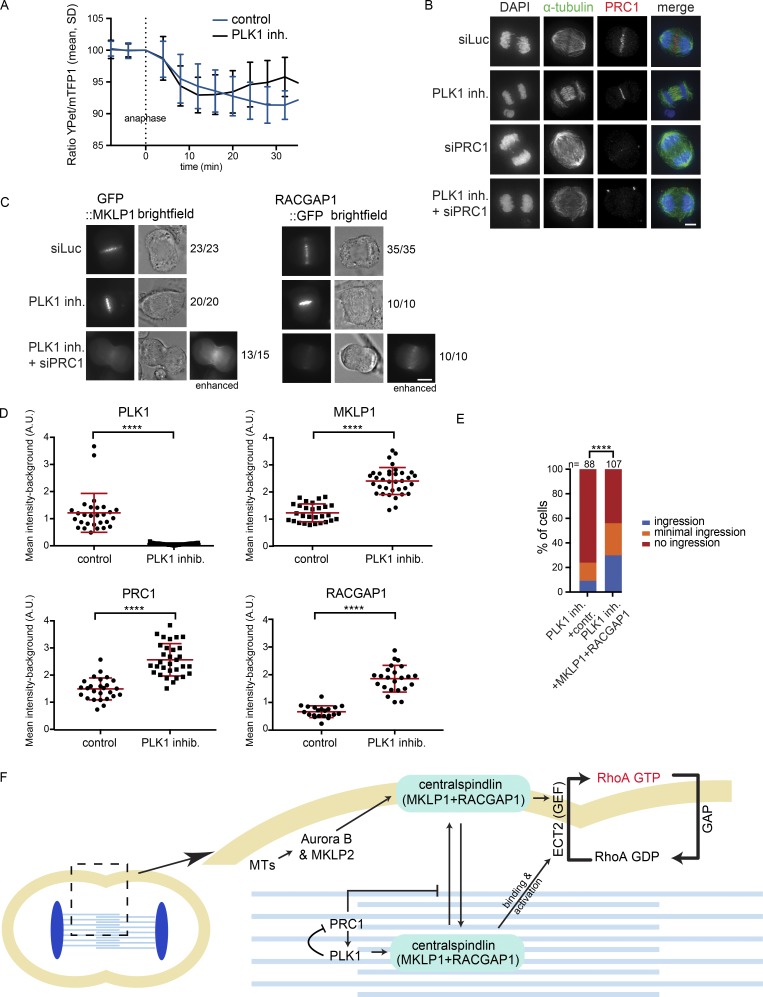
Cytokinesis begins upon anaphase onset. An early step involves local activation of the small GTPase RhoA, which triggers assembly of an actomyosin-based contractile ring at the equatorial cortex. Here, we delineated the contributions of PLK1 and Aurora B to RhoA activation and cytokinesis initiation in human cells. Knock-down of PRC1, which disrupts the spindle midzone, revealed the existence of two pathways that can initiate cleavage furrow ingression. One pathway depends on a well-organized spindle midzone and PLK1, while the other depends on Aurora B activity and centralspindlin at the equatorial cortex and can operate independently of PLK1. We further show that PLK1 inhibition sequesters centralspindlin onto the spindle midzone, making it unavailable for Aurora B at the equatorial cortex. We propose that PLK1 activity promotes the release of centralspindlin from the spindle midzone through inhibition of PRC1, allowing centralspindlin to function as a regulator of spindle midzone formation and as an activator of RhoA at the equatorial cortex.


Figures

Figure 1.
Figure 1.
PRC1 depletion reveals PLK1-independent RhoA activation and furrow ingression. (A) Western blot of HeLa cells transfected with control siRNA (siLuc) or siRNA specific for PRC1. The Western blot was probed with an anti-PRC1 antibody. α-Tubulin is shown as loading control. (B) IF for PLK1, PRC1, and α-tubulin of HeLa cells transfected with siLuc or siPRC1. DNA was visualized using DAPI. (C) DIC stills of a live cell imaging experiment of HeLa cells transfected with either siLuc or siPRC1 with (PLK1 inh.) or without addition of BI2536 (100 nM) before anaphase onset. Time point 00:00 (hours:minutes) refers to the first frame where we observed separating sisters. Stills of more time frames are shown in Fig. S1 B. (D) Percentage of cells showing either complete furrow ingression, full-furrow ingression followed by furrow regression, visible but minimal furrow ingression, or no furrow ingression (n = 100 cells imaged per condition). ****, P < 0.0001; χ2 test for comparison of the indicated conditions; ns, not significant. One representative experiment out of two is shown. (E) Quantification of fluorescence intensity levels of RhoA at the equatorial cortex in anaphase as shown in F. Each dot represents an individual cell. Error bars depict the SD of the mean. ****, P < 0.0001; Student’s t test for comparison of the indicated conditions; ns, not significant. (F) IF for RhoA and Anillin of HeLa cells in anaphase transfected with the indicated siRNAs and treated with or without BI2536 (100 nM). Bars: 5 µm (B); 10 µm (C and F).
Figure 2.
Figure 2.
PLK1-independent furrow ingression requires centralspindlin. (A) Western blot of samples derived from HeLa cells transfected with either siLuc or siRACGAP1. The Western blot was probed with an anti-RACGAP1 antibody. α-Tubulin is shown as loading control. (B) HeLa cells were transfected with siLuc or siMKLP1 and processed for IF (right). The percentage of cells with detectable MKLP1 in anaphase was scored and used as a measure for knock-down efficiency (left). The number of cells that were scored per condition is indicated (n). One representative experiment out of two is shown. ****, P < 0.0001; χ2 test for comparison of the indicated conditions. (C and D) HeLa cells transfected with the indicated siRNAs were imaged live. PLK1 was inhibited by addition of BI2536 (100 nM) before anaphase onset (PLK1 inh.). PLK1 was inhibited by addition of BI2536 (100 nM) before anaphase onset. The number of cells showing complete furrow ingression, full-furrow ingression followed by furrow regression, visible but minimal furrow ingression, or no furrow ingression was scored. The number of cells analyzed per condition is indicated (n). One representative experiment out of two is shown. ****, P < 0.0001; ***, P < 0.001; χ2 test for comparison of the indicated conditions; ns, not significant. (E) DIC stills of HeLa cells transfected with the indicated siRNAs with or without addition of BI2536 (100 nM) before anaphase onset. Bars: 10 µm. Stills of more time frames are shown in Fig. S1 D.
Figure 3.
Figure 3.
Aurora B localization and activity at the equatorial cortex. (A) IF for MKLP2 and Aurora B in HeLa cells transfected with siLuc or siPRC1. Dotted line indicates z plane for z-axis view. (B) IF for Anillin and Aurora B in anaphase cells treated with 83 nM nocodazole to depolymerize microtubules that are not part of the spindle midzone. Dotted line indicates z plane for line plot analysis of Anillin (green) and Aurora B (red) intensity (far right). (C) Left: Scheme of the FRET-based Aurora B biosensor fused to Tubby protein (green line). Right: HeLa Flp-In T-Rex cells stably expressing Tubby-Aurora B FRET sensor (green) and H2B-mCherry (red). White boxes indicate the areas where FRET was measured. (D) Measurement of distance between the separating sister chromatids and the width of the ingressing furrow (Δ cortex). (E and F) HeLa cells stably expressing the Tubby-Aurora B FRET sensor and H2B-mCherry were synchronized in G2 by treatment with the CDK1 inhibitor RO3306 and imaged live after release from the G2 block. The emission ratio at the equatorial cortex was calculated for each time point (interval, 25 s; mean ± SD of 10 cells) and plotted with the distance between the separating sister chromatids (E) or with the width of the ingressing furrow (F). (G) Color-coded images of the YPet/mTFP1 emission ratios. Bars: 5 µm (A and B); 10 µm (C and G).
Figure 4.
Figure 4.
Aurora B activity at the equatorial cortex is required for spindle midzone–independent furrow ingression. (A) Representative brightfield stills of a live cell imaging experiment with HeLa cells transfected with the indicated siRNAs and treated with (AurB inh.) or without the Aurora B inhibitor ZM447439 (2 µM) before anaphase onset. (B) Cells were treated and imaged as in A, and the percentage of cells showing either stable furrow ingression, furrow ingression followed by furrow regression, minimal furrow ingression, or no furrow ingression was scored. The number of cells analyzed per condition is indicated (n). One representative experiment out of two is shown. ****, P < 0.0001; χ2 test for comparison of the indicated conditions; ns, not significant. (C) IF for Anillin and RhoA. DNA was visualized using DAPI. (D) Quantification of the fluorescence intensity levels of RhoA at the equatorial cortex in anaphase. Each dot represents an individual cell. Error bars depict the SD of the mean. ****, P < 0.0001; Student’s t test for comparison of the indicated conditions. Bars: 10 µm (A and C).
Figure 5.
Figure 5.
Aurora B–dependent centralspindlin oligomerization contributes to spindle midzone–independent furrow ingression. (A) Scheme explaining how oligomerization of centralspindlin is induced by Aurora B–dependent phosphorylation of MKLP1. (B) HeLa cell lines with stable inducible expression of GFP::MKLP1 and GFP::MKLP1-S708E were transfected with the indicated siRNAs, treated with or without ZM447439 before anaphase, and imaged live. The number of cells showing stable furrow regression, full-furrow regression followed by furrow regression, visible but minimal furrow ingression or no furrow ingression was scored. The number of cells analyzed per condition is indicated. One representative experiment out of three is shown. **, P < 0.01; χ2 test for comparison of the indicated conditions. (C) Representative stills of HeLa cells in anaphase with stable inducible expression of GFP::MKLP1 and RACGAP1::GFP and transfected with the indicated siRNAs. Numbers indicate the number of times the depicted localization was observed/total number of cells that were imaged live. (D) Representative stills of HeLa cells in anaphase with stable inducible expression of GFP::MKLP1 and GFP::MKLP1-S708E and transfected with siPRC1 and treated with the Aurora B inhibitor ZM447439 (2 µM) before anaphase onset. (E) C. elegans embryos expressing a mCherry::PH membrane marker (pink) with a CYK-4::GFP transgene (cyan) were depleted of endogenous Aurora B (AIR-2) by RNAi. These embryos were filmed starting at metaphase in the first division cycle. Shown are montages of the equatorial region as the cell divides (n ≥ 5). The arrow indicates the appearance of cortical CYK-4::GFP under wild-type conditions. (F) Embryos expressing CYK-4::GFP were scored for the extent of recruitment of the GFP marker to the ingressing furrow tip during anaphase, relative to a cytosolic background (see Materials and methods). Error bars represent ± SD; *, P < 0.05; Student’s t test, n ≥ 5. Bars: 10 µm (C–E).
Figure 6.
Figure 6.
PLK1 suppresses PRC1 to allow dynamic exchange of centralspindlin between the spindle midzone and cell cortex. (A) HeLa cells stably expressing the Tubby-Aurora B FRET sensor and H2B-mCherry were synchronized in G2 using RO3306 and imaged live after release from the Cdk1 inhibitor. 35 min after release, BI2536 (100 nM) was added. The emission ratio at the equatorial cortex was calculated for each time point (interval, 5 min). Mean ± SD of 11 cells is shown. (B) IF for α-tubulin and PRC1 of HeLa cells in anaphase transfected with the indicated siRNAs and treated with or without BI2536. (C) Representative stills of HeLa cells in anaphase with stable inducible expression of GFP::MKLP1 and RACGAP1::GFP and transfected with the indicated siRNAs and treated with or without BI2536 (100 nM). Numbers indicate the number of times the depicted localization was observed/total number of cells that was imaged live. See also Fig. S5 A. (D) Quantification of the IF intensity levels of PLK1, MKLP1, PRC1, and RACGAP1 at the spindle midzone in anaphase (see also Fig. S5 B). Each dot represents an individual cell. One representative experiment out of three is shown. Error bars depict SDs of the mean. ****, P < 0.0001 (Student’s t test). (E) HeLa cells were infected with control GFP virus or with lentiviruses expressing GFP::MKLP1 and RACGAP1::GFP and were treated with BI2536 (100 nM) before anaphase onset and imaged live. The number of cells showing full-furrow ingression, visible but minimal furrow ingression, or no furrow ingression was scored. The number of cells analyzed per condition is indicated (n). ****, P < 0.0001; χ2 test for comparison of the indicated conditions. (F) Model explaining how PLK1 and Aurora B activate centralspindlin and RhoA at the equatorial cortex. The phosphorylation of RACGAP1 by PLK1 promotes centralspindlin binding and activation of ECT2, while Aurora B most likely promotes ECT2 activation via oligomerization of centralspindlin after phosphorylation of MKLP1. PLK1 also exerts an inhibitory effect on PRC1 which promotes the release of a fraction of centralspindlin from the spindle midzone. MTs, microtubules. Bars: 5 µm (B); 10 µm (C).

References

    1. Ahonen L.J., Kukkonen A.M., Pouwels J., Bolton M.A., Jingle C.D., Stukenberg P.T., and Kallio M.J.. 2009. Perturbation of Incenp function impedes anaphase chromatid movements and chromosomal passenger protein flux at centromeres. Chromosoma. 118:71–84. 10.1007/s00412-008-0178-0 - DOI - PMC - PubMed
    1. Amano M., Ito M., Kimura K., Fukata Y., Chihara K., Nakano T., Matsuura Y., and Kaibuchi K.. 1996. Phosphorylation and activation of myosin by Rho-associated kinase (Rho-kinase). J. Biol. Chem. 271:20246–20249. 10.1074/jbc.271.34.20246 - DOI - PubMed
    1. Andreassen P.R., Lohez O.D., Lacroix F.B., and Margolis R.L.. 2001. Tetraploid state induces p53-dependent arrest of nontransformed mammalian cells in G1. Mol. Biol. Cell. 12:1315–1328. 10.1091/mbc.12.5.1315 - DOI - PMC - PubMed
    1. Asano E., Hasegawa H., Hyodo T., Ito S., Maeda M., Takahashi M., Hamaguchi M., and Senga T.. 2013. The Aurora-B-mediated phosphorylation of SHCBP1 regulates cytokinetic furrow ingression. J. Cell Sci. 126:3263–3270. 10.1242/jcs.124875 - DOI - PubMed
    1. Ban R., Irino Y., Fukami K., and Tanaka H.. 2004. Human mitotic spindle-associated protein PRC1 inhibits MgcRacGAP activity toward Cdc42 during the metaphase. J. Biol. Chem. 279:16394–16402. 10.1074/jbc.M313257200 - DOI - PubMed

Publication types

MeSH terms