. 2019 Mar 28;57(4):e01652-18.
doi: 10.1128/JCM.01652-18. Print 2019 Apr.

Epidemiological Typing of Serratia marcescens Isolates by Whole-Genome Multilocus Sequence Typing

Affiliations

Epidemiological Typing of Serratia marcescens Isolates by Whole-Genome Multilocus Sequence Typing

John W A Rossen et al. J Clin Microbiol. .

Abstract

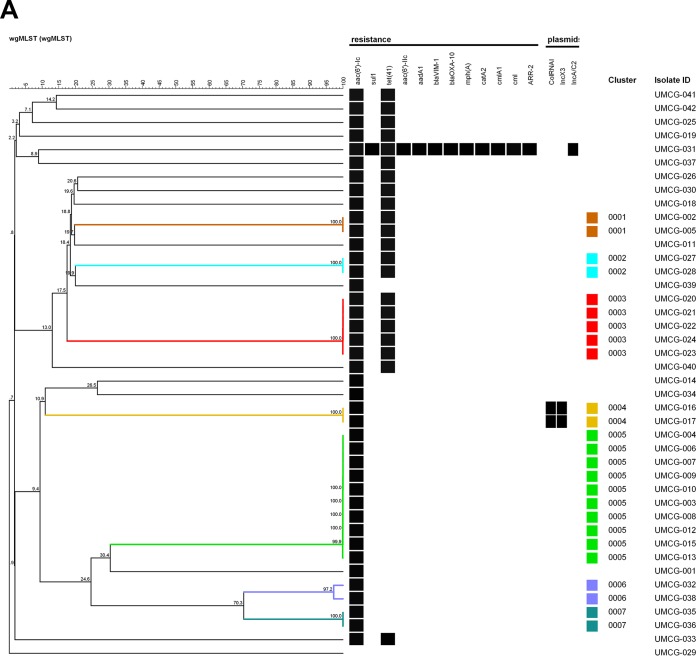
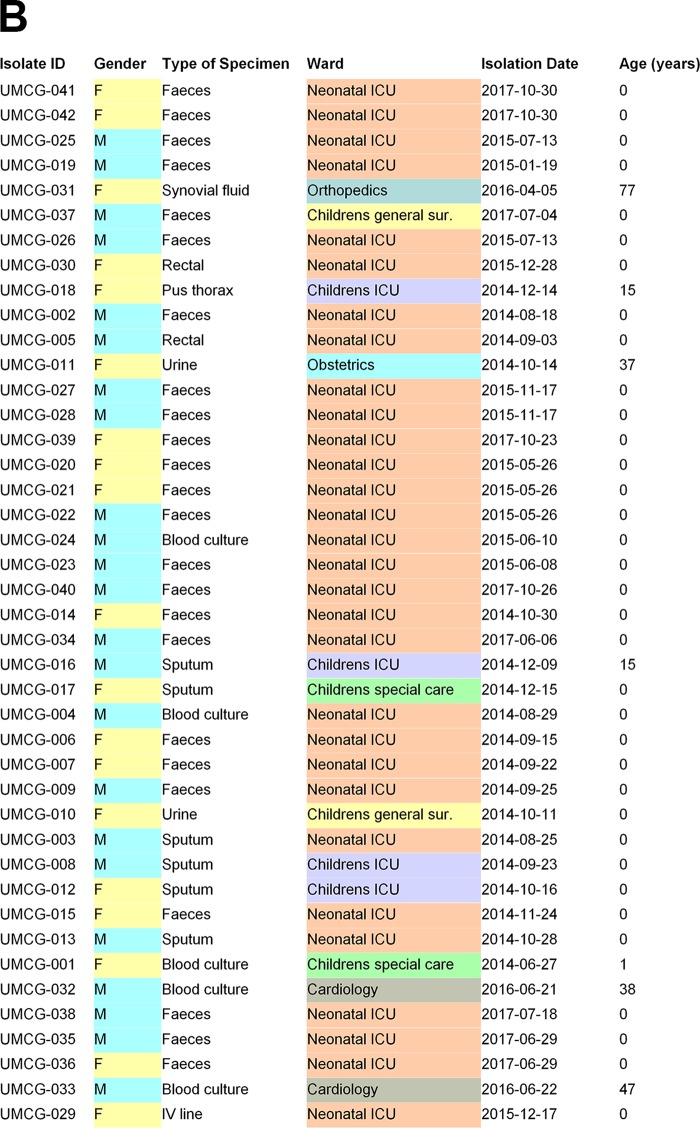
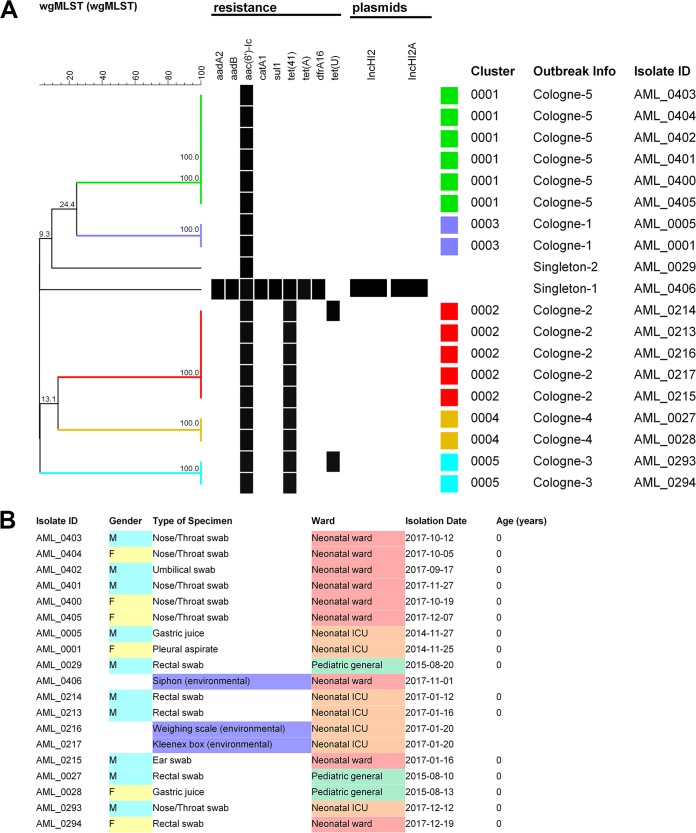
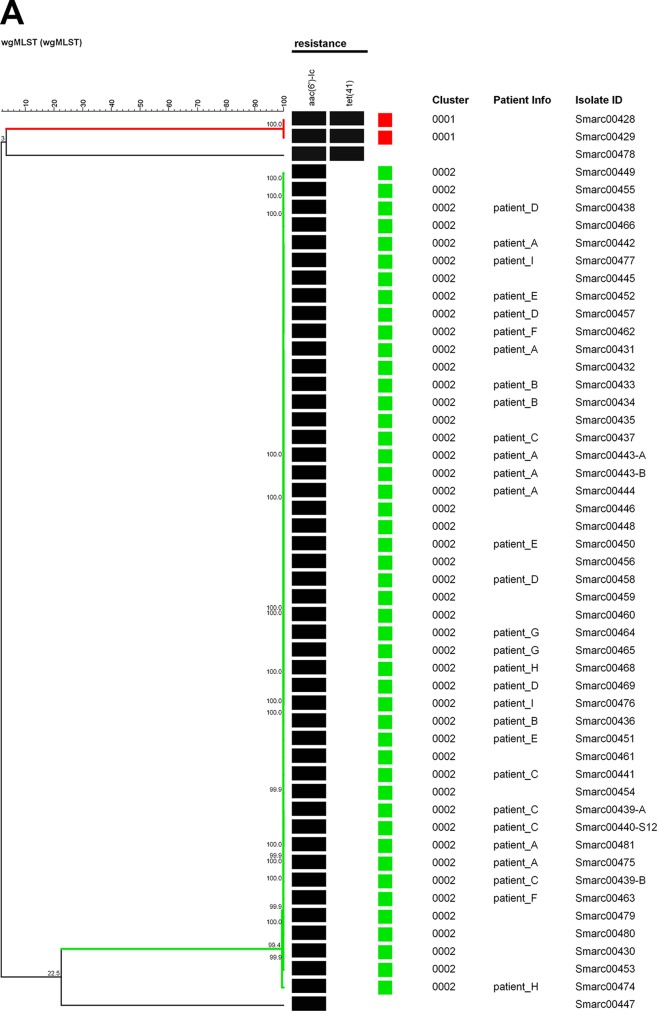
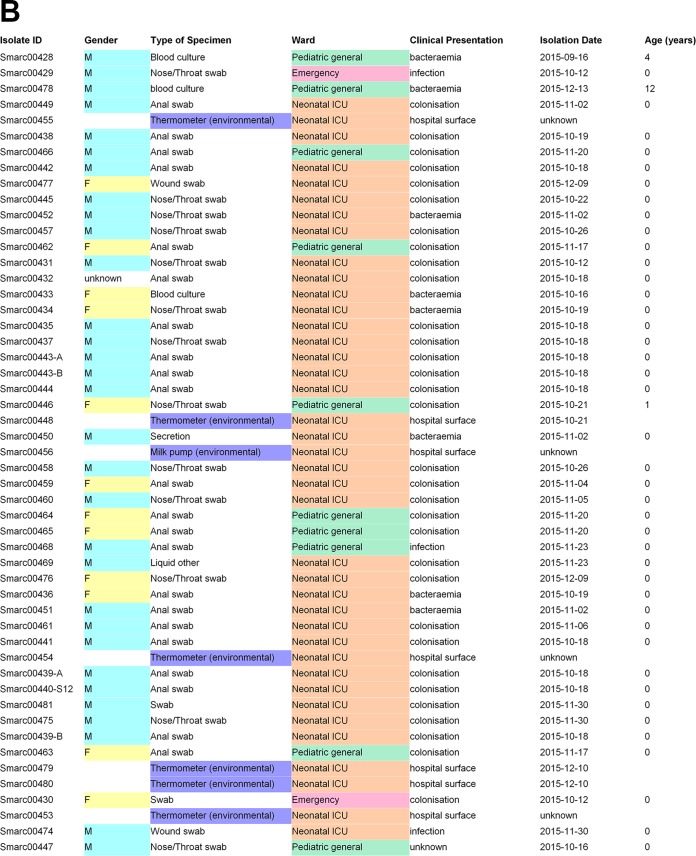
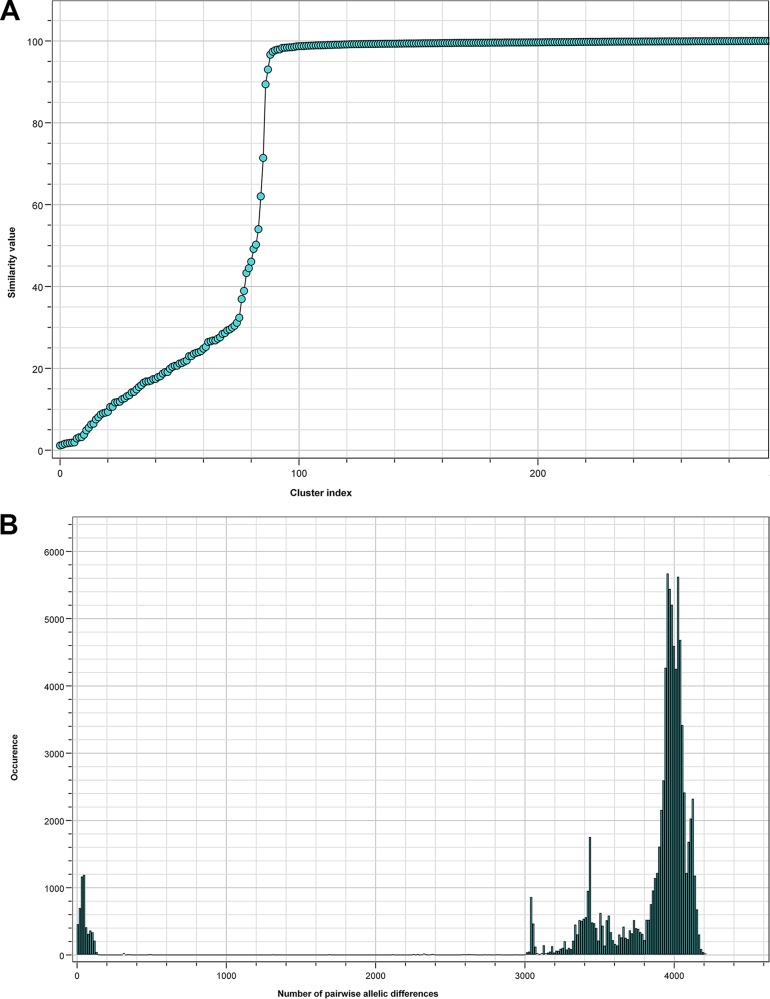
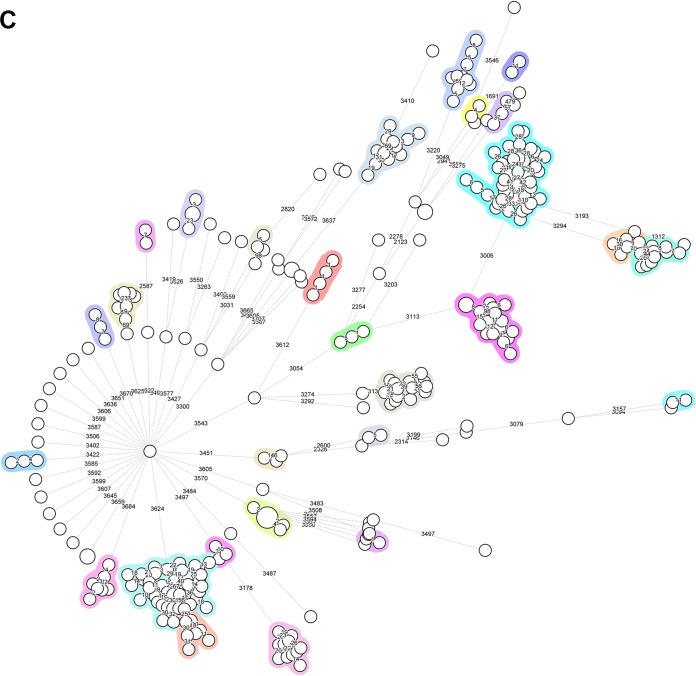
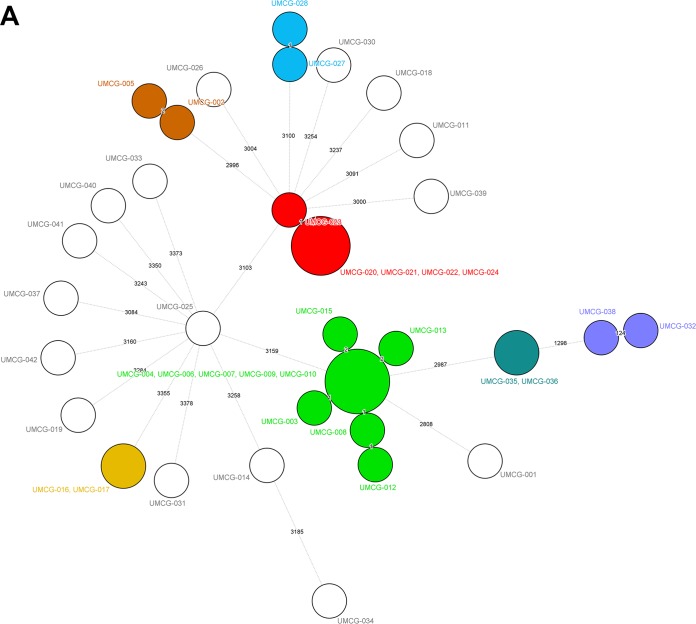
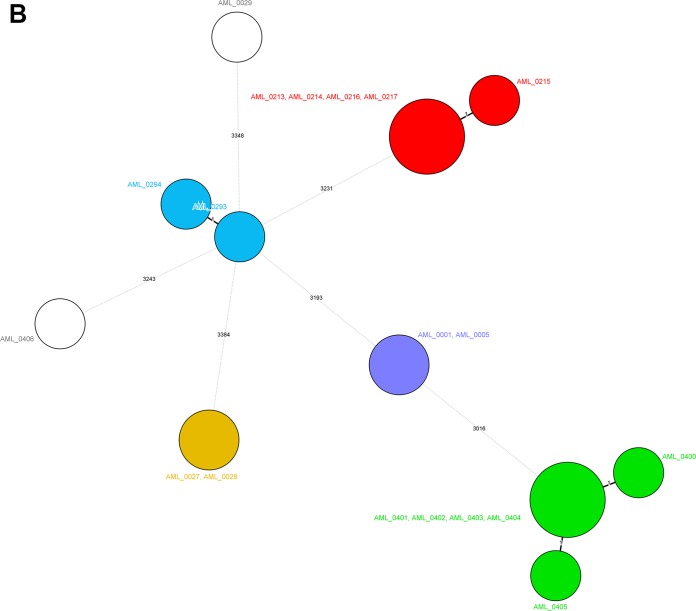
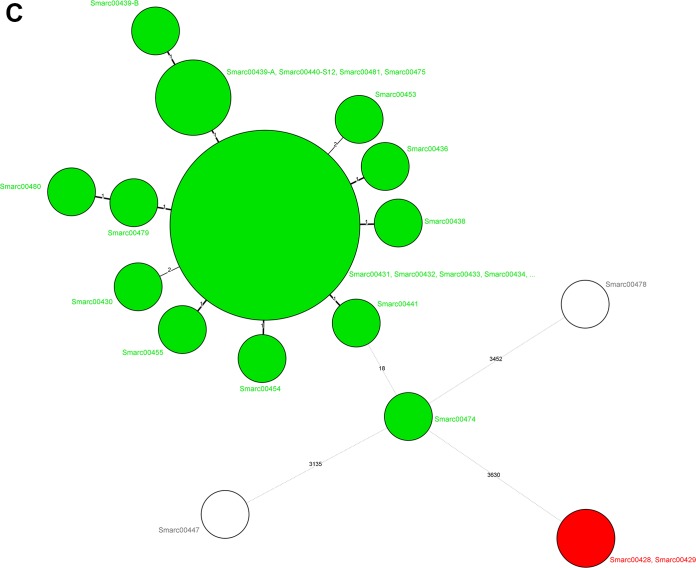
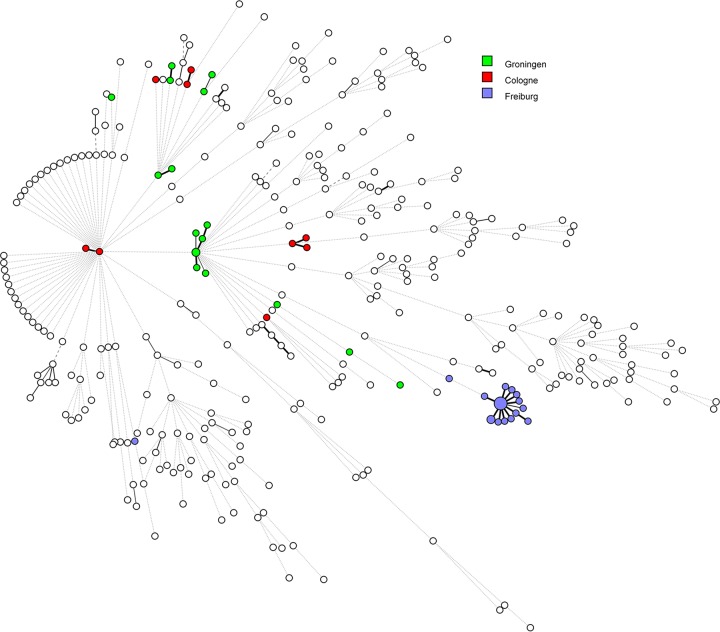
Serratia marcescens is an opportunistic bacterial pathogen. It is notorious for its increasing antimicrobial resistance and its potential to cause outbreaks of colonization and infections, predominantly in neonatal intensive care units (NICUs). There, its spread requires rapid infection control response. To understand its spread, detailed molecular typing is key. We present a whole-genome multilocus sequence typing (wgMLST) method for S. marcescens Using a set of 299 publicly available whole-genome sequences (WGS), we developed an initial wgMLST system consisting of 9,377 gene loci. This included 1,455 loci occurring in all reference genomes and 7,922 accessory loci. This closed system was validated using three geographically diverse collections of S. marcescens consisting of 111 clinical isolates implicated in nosocomial dissemination events in three hospitals. The validation procedure showed a full match between epidemiological data and the wgMLST analyses. We set the cutoff value for epidemiological (non)relatedness at 20 different alleles, though for the majority of outbreak-clustered isolates, this difference was limited to 4 alleles. This shows that the wgMLST system for S. marcescens provides prospects for successful future monitoring for the epidemiological containment of this opportunistic pathogen.

Keywords: Serratia marcescens; WGS; bionumerics; molecular typing; neonatal intensive care; outbreak management; wgMLST.


Figures

FIG 1
FIG 1
UPGMA tree of the pan-genomic allelic profiles (n = 25) derived for S. marcescens isolates from the University Medical Center Groningen, The Netherlands. (A) Outbreaks and transfer events identified prior to our study (clusters 0001 to 0007) are highlighted by color. (B) Relevant microbiological, host-associated, and environmental metadata. The UPGMA tree was built using a similarity coefficient based on categorical values expressed as percentages. Isolate UMCG-029, located at the bottom of the tree, represents S. liquefaciens, a species only sharing approximately 2,900 loci with the S. marcescens wgMLST scheme, as opposed to 4,300 loci that are typically detected in S. marcescens.
FIG 1
FIG 1
UPGMA tree of the pan-genomic allelic profiles (n = 25) derived for S. marcescens isolates from the University Medical Center Groningen, The Netherlands. (A) Outbreaks and transfer events identified prior to our study (clusters 0001 to 0007) are highlighted by color. (B) Relevant microbiological, host-associated, and environmental metadata. The UPGMA tree was built using a similarity coefficient based on categorical values expressed as percentages. Isolate UMCG-029, located at the bottom of the tree, represents S. liquefaciens, a species only sharing approximately 2,900 loci with the S. marcescens wgMLST scheme, as opposed to 4,300 loci that are typically detected in S. marcescens.
FIG 2
FIG 2
UPGMA tree of the pan-genomic allelic profiles (n = 7) derived for S. marcescens isolates from the Institute for Medical Microbiology, Immunology and Hygiene at the University of Cologne, Germany. (A) Outbreaks and transfer events (Cologne-1 to Cologne-5) identified prior to our study are highlighted by color. (B) Relevant microbiological, host-associated, and environmental metadata. The UPGMA tree was built using a similarity coefficient based on categorical values expressed as percentages. Isolates originating from inanimate surfaces are highlighted in blue.
FIG 3
FIG 3
UPGMA tree of the pan-genomic allelic profiles (n = 4) derived for S. marcescens isolates from the University Hospital of Freiburg, Germany. (A) A single major outbreak event generated all strains except four (red and nonboxed). (B) Relevant microbiological, host-associated, and environmental metadata. The UPGMA tree was built using a similarity coefficient based on categorical values expressed as percentages. Note that in this case, multiple isolates were included for 8 different individuals. Isolates originating from inanimate surfaces are highlighted in blue.
FIG 3
FIG 3
UPGMA tree of the pan-genomic allelic profiles (n = 4) derived for S. marcescens isolates from the University Hospital of Freiburg, Germany. (A) A single major outbreak event generated all strains except four (red and nonboxed). (B) Relevant microbiological, host-associated, and environmental metadata. The UPGMA tree was built using a similarity coefficient based on categorical values expressed as percentages. Note that in this case, multiple isolates were included for 8 different individuals. Isolates originating from inanimate surfaces are highlighted in blue.
FIG 4
FIG 4
Review of quality parameters for the S. marcescens-specific whole-genome sequences used to construct the wgMLST reference database. (A) Correlation between numbers of clusters and similarity cutoff values for the founding S. marcescens wgMLST database. The cluster index was based on the average numbers of alleles being different between closely related strain pairs. The analysis was performed using all WGS listed in Table S2 in the supplemental material. (B) Correlation between the numbers of pairwise allelic differences and their frequency of occurrence. (C) Minimum spanning tree based on the pan-genomic allelic profiles of 299 S. marcescens isolates, representing the reference set used to create the wgMLST database. Colors highlight closely related isolates, numbers of allelic differences are indicated on the lines connecting the various types.
FIG 4
FIG 4
Review of quality parameters for the S. marcescens-specific whole-genome sequences used to construct the wgMLST reference database. (A) Correlation between numbers of clusters and similarity cutoff values for the founding S. marcescens wgMLST database. The cluster index was based on the average numbers of alleles being different between closely related strain pairs. The analysis was performed using all WGS listed in Table S2 in the supplemental material. (B) Correlation between the numbers of pairwise allelic differences and their frequency of occurrence. (C) Minimum spanning tree based on the pan-genomic allelic profiles of 299 S. marcescens isolates, representing the reference set used to create the wgMLST database. Colors highlight closely related isolates, numbers of allelic differences are indicated on the lines connecting the various types.
FIG 5
FIG 5
Minimum spanning trees for the S. marcescens isolates from Groningen (A), Cologne (B), and Freiburg (C) built from the pan-genomic allelic profiles. Colors of the circles identify the epidemiological clusters and cases of transmission. The values on the lines indicate the numbers of allelic differences between the connected isolates. Circle sizes are associated with the numbers of isolates per type. The figure implies that there are no clusters extending across hospitals. Color codes are specific for the three different panels and should not be compared between panels.
FIG 5
FIG 5
Minimum spanning trees for the S. marcescens isolates from Groningen (A), Cologne (B), and Freiburg (C) built from the pan-genomic allelic profiles. Colors of the circles identify the epidemiological clusters and cases of transmission. The values on the lines indicate the numbers of allelic differences between the connected isolates. Circle sizes are associated with the numbers of isolates per type. The figure implies that there are no clusters extending across hospitals. Color codes are specific for the three different panels and should not be compared between panels.
FIG 6
FIG 6
Overall genomic population structure of S. marcescens based on a combined analysis of our epidemiologically related isolates and the reference genomes that were used to construct the wgMLST scheme. Note the extended number of singletons and the occurrence of epidemic clones seemingly originating from several of such singletons. Green bullets represent isolates from Groningen, red ones the isolates from Cologne, and blue ones identify the isolates from Freiburg.

References

    1. Sabat AJ, Budimir A, Nashev D, Sá-Leão R, van Dijl JM, Laurent F, Grundmann H, Friedrich AW, ESCMID Study Group of Epidemiological Markers (ESGEM). 2013. Overview of molecular typing methods for outbreak detection and epidemiological surveillance. Euro Surveill 18:20380. - PubMed
    1. Goering RV, Köck R, Grundmann H, Werner G, Friedrich AW, ESCMID Study Group for Epidemiological Markers (ESGEM). 2013. From theory to practice: molecular strain typing for the clinical and public health setting. Euro Surveill 18:20383. - PubMed
    1. Higgins PG, Prior K, Harmsen D, Seifert H. 2017. Development and evaluation of a core genome multilocus typing scheme for whole-genome sequence-based typing of Acinetobacter baumannii. PLoS One 12:e0179228. doi: 10.1371/journal.pone.0179228. - DOI - PMC - PubMed
    1. Rossen JWA, Friedrich AW, Moran-Gilad J, ESCMID Study Group for Genomic and Molecular Diagnostics (ESGMD). 2018. Practical issues in implementing whole-genome-sequencing in routine diagnostic microbiology. Clin Microbiol Infect 24:355–360. doi: 10.1016/j.cmi.2017.11.001. - DOI - PubMed
    1. Revez J, Zhang J, Schott T, Kivistö R, Rossi M, Hänninen ML. 2014. Genomic variation between Campylobacter jejuni isolates associated with milk-borne-disease outbreaks. J Clin Microbiol 52:2782–2786. doi: 10.1128/JCM.00931-14. - DOI - PMC - PubMed

MeSH terms

LinkOut - more resources