

DNA helicase RecQ1 regulates mutually exclusive expression of virulence genes in Plasmodium falciparum via heterochromatin alteration
- PMID: 30728298
- PMCID: PMC6386683
- DOI: 10.1073/pnas.1811766116
DNA helicase RecQ1 regulates mutually exclusive expression of virulence genes in Plasmodium falciparum via heterochromatin alteration
Abstract
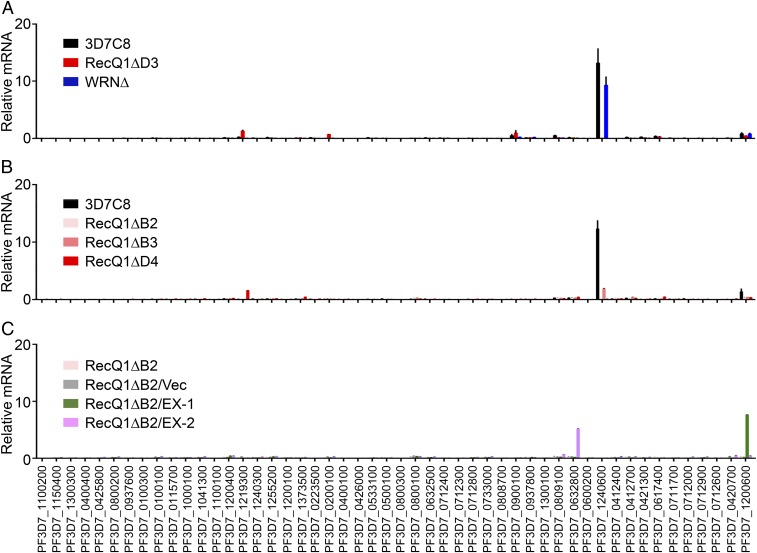
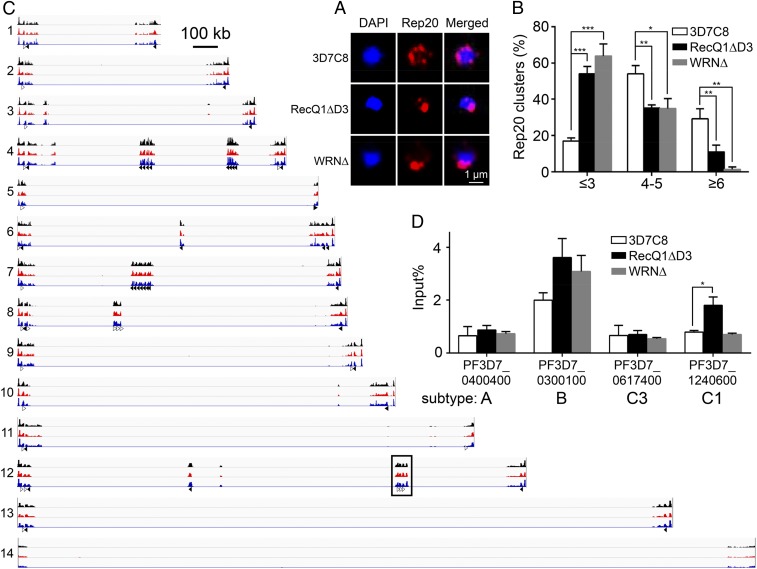
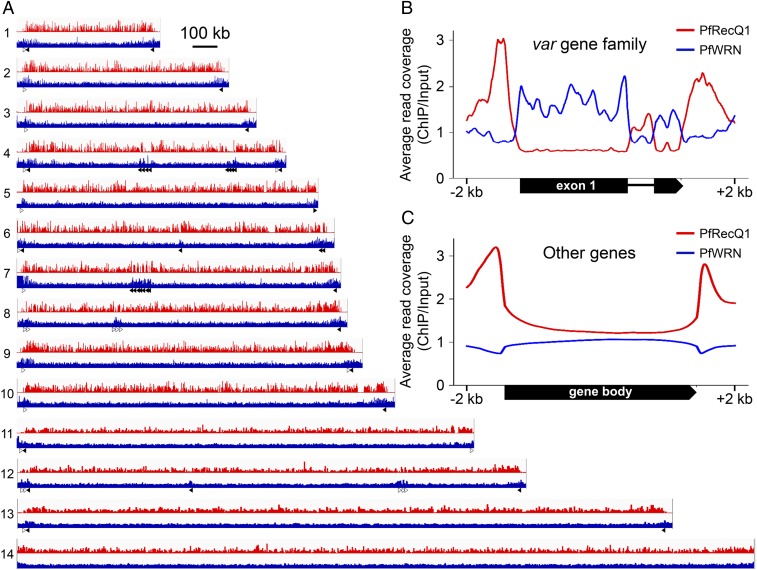
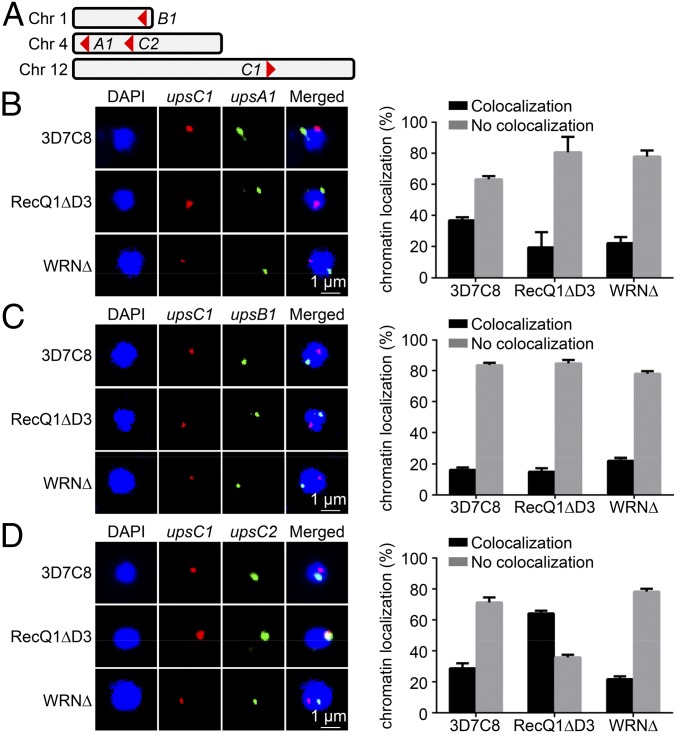
The Plasmodium falciparum var gene family encodes ∼60 surface antigens by which parasites escape the host immune responses via clonal expression of var genes. However, the mechanism controlling this mutual exclusivity, associated with alterations in chromatin assembly, is not understood. Here, we determined how expression of the var gene family is regulated by two RecQ DNA helicase family members, PfRecQ1 and PfWRN, in P. falciparum Through genetic manipulation, we found that the complete var repertoire was silenced on PfRecQ1 knockout, whereas their expression did not show noticeable changes when PfWRN was knocked out. More important, mutually exclusive expression of var genes could be rescued by complementation of PfRecQ1. In addition, knocking out either of these two helicase genes changed the perinuclear cluster distribution of subtelomeres and subtelomeric var genes. Whereas deletion of PfRecQ1 increased the heterochromatin mark trimethylated (H3K9me3) at the transcription start site (TSS) of the var gene upsC1, that deletion had no effect on the global distribution of H3K9me3 over gene bodies, including those for the var genes. ChIP-seq assay showed that PfRecQ1 was enriched globally at the TSSs of all genes, whereas PfWRN-enriched regions occurred at the gene bodies of the var gene family, but not of other genes or at TSSs of all genes. On PfRecQ1 deletion, the upsC1 var gene moved from the active perinuclear transcription region to a silenced region of the upsC type. These findings imply that PfRecQ1, but not PfWRN, is essential for maintaining the clonal expression of var genes.
Keywords: DNA helicases; Plasmodium falciparum; heterochromatin; mutually exclusive expression; virulence gene.
Conflict of interest statement
The authors declare no conflict of interest.
Figures
Similar articles
-
Expression of P. falciparum var genes involves exchange of the histone variant H2A.Z at the promoter.PLoS Pathog. 2011 Feb;7(2):e1001292. doi: 10.1371/journal.ppat.1001292. Epub 2011 Feb 17. PLoS Pathog. 2011. PMID: 21379342 Free PMC article.
-
Plasmodium falciparum: epigenetic control of var gene regulation and disease.Subcell Biochem. 2013;61:659-82. doi: 10.1007/978-94-007-4525-4_28. Subcell Biochem. 2013. PMID: 23150271 Review.
-
Heterochromatin silencing and locus repositioning linked to regulation of virulence genes in Plasmodium falciparum.Cell. 2005 Apr 8;121(1):13-24. doi: 10.1016/j.cell.2005.01.036. Cell. 2005. PMID: 15820675
-
The Plasmodium falciparum histone methyltransferase PfSET10 is dispensable for the regulation of antigenic variation and gene expression in blood-stage parasites.mSphere. 2024 Nov 21;9(11):e0054624. doi: 10.1128/msphere.00546-24. Epub 2024 Oct 24. mSphere. 2024. PMID: 39445826 Free PMC article.
-
Mutually exclusive var gene expression in the malaria parasite: multiple layers of regulation.Trends Parasitol. 2008 Oct;24(10):455-61. doi: 10.1016/j.pt.2008.07.005. Epub 2008 Sep 2. Trends Parasitol. 2008. PMID: 18771955 Review.
Cited by
-
Evolution of transcriptional control of antigenic variation and virulence in human and ape malaria parasites.BMC Ecol Evol. 2021 Jul 8;21(1):139. doi: 10.1186/s12862-021-01872-z. BMC Ecol Evol. 2021. PMID: 34238209 Free PMC article.
-
Elucidation of DNA Repair Function of PfBlm and Potentiation of Artemisinin Action by a Small-Molecule Inhibitor of RecQ Helicase.mSphere. 2020 Nov 25;5(6):e00956-20. doi: 10.1128/mSphere.00956-20. mSphere. 2020. PMID: 33239368 Free PMC article.
-
The Role of the Histone Methyltransferase PfSET10 in Antigenic Variation by Malaria Parasites: a Cautionary Tale.mSphere. 2021 Feb 3;6(1):e01217-20. doi: 10.1128/mSphere.01217-20. mSphere. 2021. PMID: 33536326 Free PMC article.
-
Bloom Helicase Along with Recombinase Rad51 Repairs the Mitochondrial Genome of the Malaria Parasite.mSphere. 2021 Dec 22;6(6):e0071821. doi: 10.1128/mSphere.00718-21. Epub 2021 Nov 3. mSphere. 2021. PMID: 34730376 Free PMC article.
-
Discovery of RUF6 ncRNA-interacting proteins involved in P. falciparum immune evasion.Life Sci Alliance. 2022 Nov 15;6(1):e202201577. doi: 10.26508/lsa.202201577. Print 2023 Jan. Life Sci Alliance. 2022. PMID: 36379669 Free PMC article.
References
-
- Miller LH, Baruch DI, Marsh K, Doumbo OK. The pathogenic basis of malaria. Nature. 2002;415:673–679. - PubMed
-
- World Health Organization . Global Technical Strategy for Malaria 2016-2030. WHO; Geneva: 2015.
-
- Scherf A, Lopez-Rubio JJ, Riviere L. Antigenic variation in Plasmodium falciparum. Annu Rev Microbiol. 2008;62:445–470. - PubMed
Publication types
MeSH terms
Substances
Grants and funding
LinkOut - more resources
Full Text Sources
