. 2019 Feb 6;10(1):620.
doi: 10.1038/s41467-019-08541-2.

Pharmacological reactivation of MYC-dependent apoptosis induces susceptibility to anti-PD-1 immunotherapy

Affiliations

Pharmacological reactivation of MYC-dependent apoptosis induces susceptibility to anti-PD-1 immunotherapy

Heidi M Haikala et al. Nat Commun. .

Erratum in

Abstract

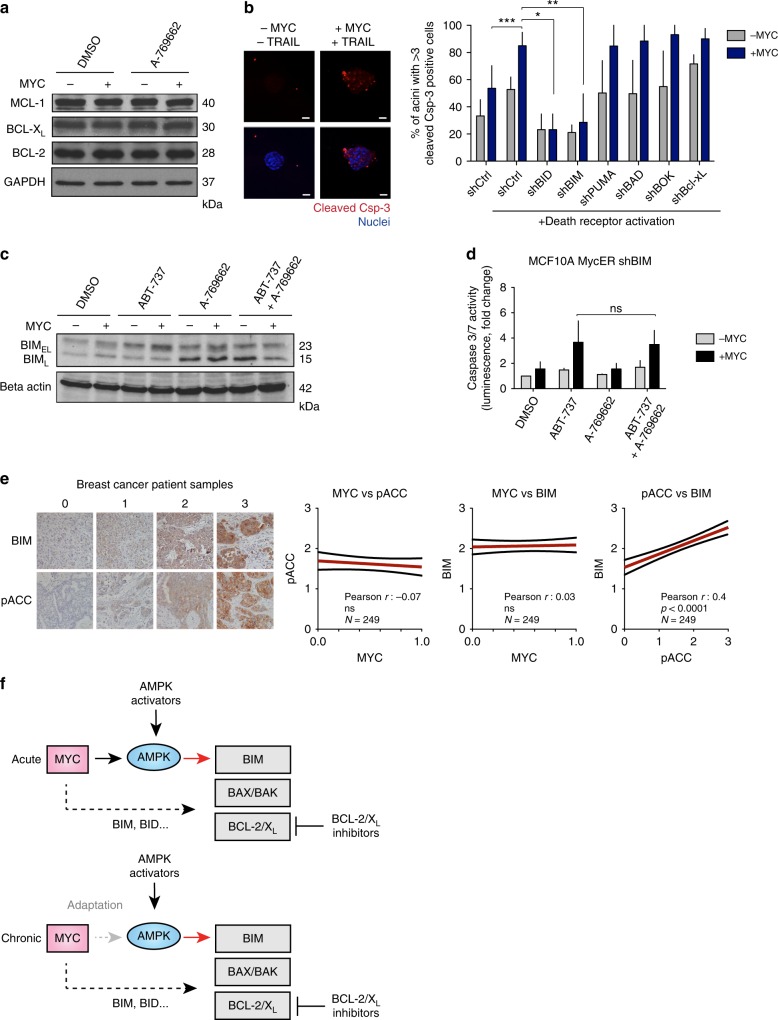
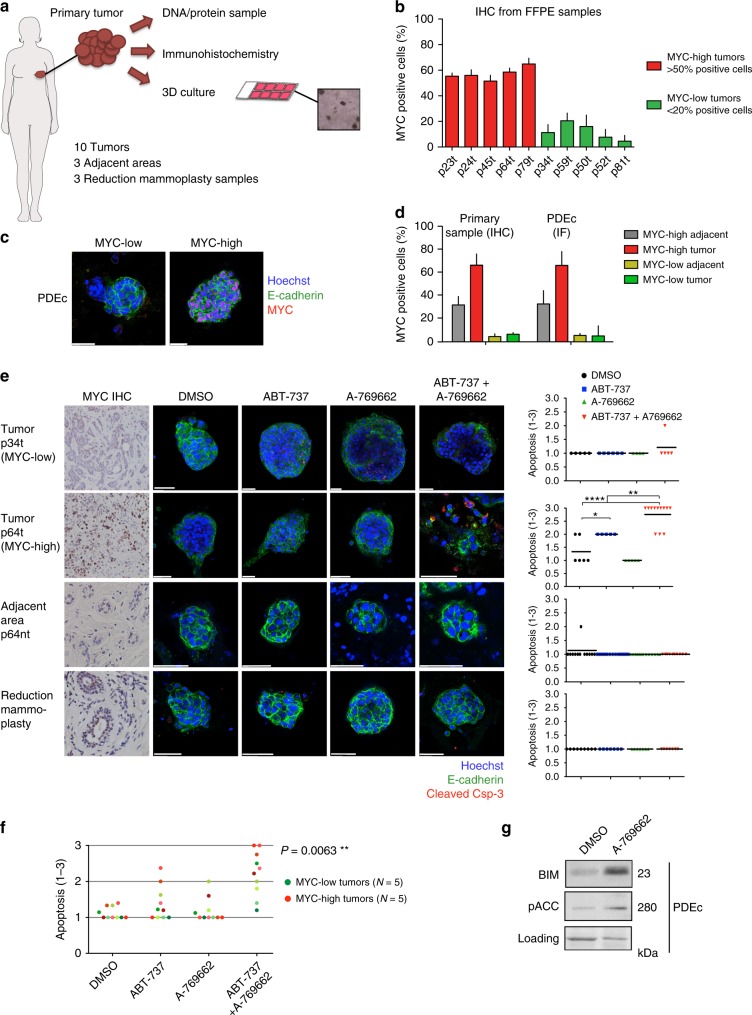
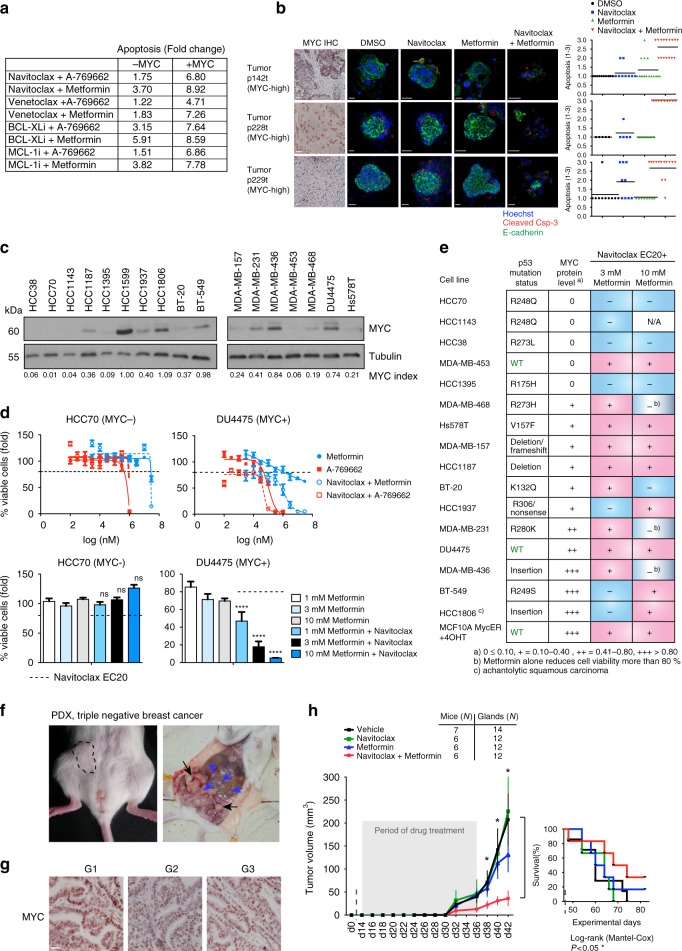
Elevated MYC expression sensitizes tumor cells to apoptosis but the therapeutic potential of this mechanism remains unclear. We find, in a model of MYC-driven breast cancer, that pharmacological activation of AMPK strongly synergizes with BCL-2/BCL-XL inhibitors to activate apoptosis. We demonstrate the translational potential of an AMPK and BCL-2/BCL-XL co-targeting strategy in ex vivo and in vivo models of MYC-high breast cancer. Metformin combined with navitoclax or venetoclax efficiently inhibited tumor growth, conferred survival benefits and induced tumor infiltration by immune cells. However, withdrawal of the drugs allowed tumor re-growth with presentation of PD-1+/CD8+ T cell infiltrates, suggesting immune escape. A two-step treatment regimen, beginning with neoadjuvant metformin+venetoclax to induce apoptosis and followed by adjuvant metformin+venetoclax+anti-PD-1 treatment to overcome immune escape, led to durable antitumor responses even after drug withdrawal. We demonstrate that pharmacological reactivation of MYC-dependent apoptosis is a powerful antitumor strategy involving both tumor cell depletion and immunosurveillance.


Conflict of interest statement

The in vivo work was partly funded by AbbVie Inc. J.D.L. is an employee and a shareholder in AbbVie Inc. The remaining authors declare no competing interests.

Figures

Fig. 1
Fig. 1
Inhibition of anti-apoptotic BCL-2 proteins by ABT-737 curbs WapMyc-driven mammary tumor growth. a Nuclear expression of MYC in breast cancer. Representative images from a breast cancer tissue microarray (TMA) immunostained for MYC. Samples that were missing from the TMA slide or had insufficient clinical diagnosis data, or had inadequate technical quality were excluded from all analyses. b Cross-tabulation of MYC expression against BCL-2, BCL-XL, or MCL-1 expression status. Gray boxes: Double-positive samples. c ABT-737 treatment protocol for WapMyc-induced autochthonous mammary adenocarcinoma. Red arrow: start of the treatment. d Upper: Western blot analysis of anti-apoptotic BCL-2 proteins in parallel non-tumor and tumor glands dissected from the same WapMyc mouse (N = 4 mice). Tubulin: Loading control. Lower: Immunostaining of BCL-XL in a hyperplastic gland and a tumor gland. Tumor–stroma border indicated with red dotted line. e Flow cytometric quantification of apoptosis in primary cultures. Epithelial cells were isolated from tumor or non-tumor glands, treated 24 h with 1 μM ABT-737 and stained with Annexin V/PI. Triplicate experiments performed on control (N = 2) or WapMyc tumor cell isolates (N = 5). Student’s t-test (unpaired), SD. f Quantification of apoptosis in tumor tissue. Positive cells scored from 16 vehicle and 16 ABT-737-treated tumors. Student’s t-test (unpaired), SD. g Left: Tumor growth during the 21-day treatment period. Arrow: First mice killed due to tumor burden (Ø > 2 cm). Right: Survival of the mice. h ABT-737 treatment decreases incidence of lung metastases in WapMyc tumor bearing mice, Student’s t-test (unpaired). i ABT-737 treatment protocol for orthotopically syngrafted WapMyc tumors. j MYC expression pattern in normal human breast tissue, human breast tumors, and endogenous & syngrafted WapMyc mouse mammary tumors. k Left: Tumor growth during the 21-day treatment period. Arrow: The first mice sacrificed due to tumor burden (Ø > 2 cm). Right: Survival of the mice
Fig. 2
Fig. 2
AMPK activation potentiates MYC-dependent apoptosis by ABT-737. a Drug-targeted pathways. b Protocol for drug combination testing. MCF10A MycER cells were allowed to form mammospheres for 24 h. MYC was activated with 100 nM 4OHT for 24 h followed by 24 h incubation with drug combinations. c Combination drug testing to identify pharmacological triggers of MYC-dependent apoptosis. The drugs were administered as single agents or as ABT-737 with and without MYC activation. Each drug was tested in two concentrations. N = 3 biological repeats. Student’s t-test (unpaired), SD. d The relative level of apoptosis with and without MYC activity (+MYC: −MYC ratio). The ratio was calculated from fold-change in c. e Representative images of drug-treated mammospheres. fg Sensitization to MYC-dependent apoptosis by 100 nM ABT-737 with either 1 μM A-769662 or 10 mM metformin. Mammospheres were treated as in b. Student’s t-test (unpaired), N = 3 biological replicates, SD. h Activation of AMPK alone does not sensitize to MYC-dependent apoptosis. N = 3 biological repeats, SD. i CRISPR/dead-Cas9-mediated transcriptional activation of MYC. HEK293 and MCF10A cells were transduced with vectors encoding dCas9-VP192 transcription-activating construct and MYC-promoter-targeted guide-RNAs. Western blot analysis shows MYC expression levels after 72 h treatment with doxycycline (DOX) and trimethoprim (TMP). Lamin B: Loading control. j CRISPR-mediated induction of endogenous MYC sensitizes cells to apoptosis by ABT-737+A-769662. Mammospheres with and without dCas9-VP192+MYC-gRNA were treated and analyzed as in b. Student’s t-test (unpaired), N = 3 biological replicates, SD
Fig. 3
Fig. 3
AMPK activation upregulates BIM to sensitize cells to apoptosis. a AMPK activation does not alter the expression of anti-apoptotic BCL-2 family proteins. MCF10A MycER cells were treated with vehicle or 1 μM A-769662. MYC was activated with 100 nM 4OHT for 24 h before the 24 h drug treatment. b shRNA screen to determine pro-apoptotic regulators of MYC-dependent apoptosis. Left: Apoptosis induced by MYC and TRAIL in 3D MCF10A acini. Right: shRNA-transduced cells were seeded into Matrigel to form acini and MycER was activated on day 20. The 3D acini were treated with 100 ng/ml of TRAIL for 72 h. Apoptosis was scored using active caspase-3 readout. Student’s t-test (unpaired), N = 3 biological replicates, SD. c The effect of A-769662 on BIMEL and BIML expression. MYC was activated in MCF10A MycER for 24 h followed by 24 h treatment with 100 nM ABT-737, 1 μM A-769662, or with combination. Lamin B: Loading control. d BIM knockdown blunts AMPK-mediated sensitization to apoptosis. MCF10A MycER shBIM cells were treated as in c followed by quantitative analysis of apoptosis. Student’s t-test (unpaired), N = 3 biological replicates, SD. e Correlations between nuclear MYC protein and BIM or AMPK activity (pACC) in breast cancer. Left: Representative images of BIM and pACC staining intensity groupings. Right: High AMPK activity associates with elevated BIM expression in breast cancer. Blinded scoring of BIM and pACC levels, with intensities from 1 to 3 in a breast cancer tissue microarray. f A model for AMPK-induced reactivation of MYC-dependent apoptosis in cancer. Acute: Acute activation of MYC sensitizes cells to apoptosis via BIM-dependent modulation of the interactions between pro-apoptotic BAK/BAX and the anti-apoptotic BCL-2/XL proteins. Likely, other BH3-only proteins also contribute to the apoptotic sensitization (dotted arrow). Pharmacological activation of AMPK enhances the BIM load in MYC-overexpressing cells (red arrow), which together with inhibition of BCL-2/XL triggers apoptosis. Chronic: Tumors may escape AMPK-BIM pathway via metabolic adaptation or by acquiring resistance mechanisms (thick dotted arrow), but the pro-apoptic pathway is still amenable to reactivation by pharmacological AMPK activators
Fig. 4
Fig. 4
AMPK activation combined with BCL-2/XL inhibition induces MYC-associated apoptosis in breast cancer patient-derived explant cultures. a Workflow for breast cancer patient tissue-derived explant cultures (PDEc). Tumor pieces were brought to the lab directly after surgery and cut into three pieces; one for DNA/protein extraction, one for immunohistochemical (IHC) analyses and one for 3D culture. b IHC analysis of MYC in breast tumors. Paraffin-embedded samples were immunostained for MYC and ≥5 fields of view (FOV) from 1 to 3 sections scored. MYC-high tumors: >50% positive cells/FOV, MYC-low tumors: <20%-positive cells/FOV. N = 10 tumors. c Representative images of MYC-low and MYC-high PDEc cultures. The PDEc samples were cultured for 7 days, stained and imaged by confocal microscopy (IF). d MYC status before and after 3D culture. MYC positivity scored as in b. e ABT-737+A-769662-induced apoptosis in MYC-high, MYC-low, and non-cancerous (tumor adjacent tissue and reduction mammoplasty) PDEc cultures. Samples were adjusted to culture for 6 days and treated for 24 h with vehicle (DMSO), 1 μM ABT-737, 10 μM A-769662 or ABT-737+A-769662 combination. The level of apoptosis was scored from confocal immunofluorescence images. The left panel shows representative images. The graphs at right plot the quantification of apoptosis. Apoptosis was scored as 1 = <10% apoptotic cells/explant, 2 = >10% apoptotic cells/explant in a cohesive structure, 3 = >10% apoptotic cells/explant in a deteriorated structure. Each dot indicates one fragment. Horizontal lines: Average, Student’s t-test (unpaired). f Summary of the apoptotic response in PDEc. Student’s t-test (unpaired). The different shades of green represent the different MYC-low tumor samples, and the different shades of red represent the different MYC-high tumor samples. g AMPK activation upregulates BIM in PDEc culture. pACC was used as an AMPK activity marker. The sample was treated with DMSO or 10 μM A-769662 for 24 h
Fig. 5
Fig. 5
ABn treatment reduces viability of MYC-high triple-negative breast cancer cell lines, inhibits tumor growth, and extends survival in patient-derived xenografts. a A summary of the results of BH3 mimetic screen in MCF10A MycER cells. The numbers refer to fold change as in Supplementary Figure 4A. The drugs were navitoclax, venetoclax, a BCL-XL-selective inhibitor A-1155463 and an MCL-1-selective inhibitor A-1210477. b AB treatment-induces apoptosis in MYC-high PDEc. The cultures were treated with DMSO, 1 μM navitoclax, 10 mM metformin or combination for 24 h. Blinded scoring of apoptosis was carried out for all samples. c MYC expression in 17 triple-negative breast cancer cell lines. MYC index: MYC intensity normalized to a blot-to-blot reference sample, highest intensity band (HCC1599) and loading control. N.B. HCC1599 excluded from the final analysis due to poor growth. Tubulin: Loading control. d The effect of AB treatment on the viability of MYC-low and MYC-high TNBC cell lines. The upper panel shows kill curves and the dashed line marks the EC20 of navitoclax (20% reduction in survival); see also Fig.S4E. The lower panel shows metformin effect at EC20 of navitoclax. Student’s t-test (unpaired), SD. e Summary table of drug treatments in TNBC cell lines. The cell lines were categorized according to MYC index (0 = undetectable MYC expression; + to +++ = relative MYC expression level). Blue boxes indicate statistically non-significant and pink boxes statistically significant differences between each single-agent treatment and the corresponding combination. Student’s t-test (unpaired). f Representative images of tumors developing in TNBC-PDX mice. Black arrows: Primary tumors developing at the site of the tumor grafts; blue arrows: Metastases. g TNBC-PDX tumors retain MYC expression during in vivo passaging. Tumor generations G1–G3. h Effect of AB treatment on tumor growth and survival in cohorts of TNBC-PDX mice. The mice were treated with vehicle, 100 mg/kg/d navitoclax, 600 mg/kg/d metformin or the combination for 21 days, and followed up until day 60. Student’s t-test (unpaired), SEM. In the survival graph: P-value: Significant difference between vehicle and AB-treated cohorts
Fig. 6
Fig. 6
ABn treatment inhibits tumor growth and extends survival of mice syngrafted with WapMyc tumors. a Combination treatment protocol for orthotopically syngrafted WapMyc tumors. The mice were treated with a vehicle, navitoclax, and two concentrations of metformin alone or in combination with navitoclax for 21 days. Immunoprofiling samples were collected right after the drug treatments or after a follow-up period. In the follow-up period the samples were collected when the tumors reached Ø 2 cm and the mice had to be killed. b ABn treatment-induces BIM activation in vivo. The level of BIM immunostaining was scored in IHC samples from treated tumors using a scale of 1–4 (representative examples are shown in the figure). The samples were blinded for analysis. Student’s t-test (unpaired), SD. c ABn treatment-induced “apoptotic ponds”. Representative images of tumor samples stained for cleaved caspase-3. d ABn treatment stimulates T-cell infiltration. WapMyc tumor samples were isolated from mice killed after the 21-day AB treatment period. Representative images are shown and the data below show average and SD of CD4+ or CD8+ T cells in the tumors. Immunohistochemical stainings were performed for at least 45 tumors per antibody and 3–6 field of view (fov) per tumor were analyzed. Student’s t-test (unpaired). e ABn treatment-induced changes in proportions of peripheral lymphocytes. N (vehicle) = 7 mice, N (ABn) = 4 mice. Blood was collected after 21 days treatment with either vehicle or ABn. Student’s t-test (unpaired), SD. f Tumor growth in ABn-treated mice. Student’s t-test (unpaired), SEM. g, h ABn treatment extends survival. P-values: Difference between the vehicle and ABn-treated cohorts. i Flow cytometry-based immunoprofiling of vehicle and ABn (navitoclax+metformin)-treated tumors. The heatmaps show fold-change compared to control. N = 6 (vehicle), N = 2 Navitoclax+Metformin. j Post-treatment ratios of tumor-infiltrating PD-1+CD8+ T cells. Student’s t-test (unpaired), SD
Fig. 7
Fig. 7
ABv treatment with anti-PD-1 immunotherapy offers durable therapeutic response. a Treatment protocol for syngrafted WapMyc tumors. The mice received vehicle, venetoclax, metformin, or venetoclax+metformin (ABv) for 21 days. Tumors were surgically removed, and mice were given adjuvant treatments. ABv was given every day for 1 week, and control IgG or anti-PD-1 was given every third day, four times in total. The mice were followed up until the tumors reached Ø 2 cm. Flow cytometry-based immunoprofilings were done after the adjuvant treatment and after the follow-up. b Tumor growth during the neoadjuvant treatment. Student’s t-test (unpaired), SEM. N = 8 mice/treatment group. c Tumor volume during the adjuvant treatment (d7 from surgery). Student’s t-test (unpaired), SD. N = 4 mice/treatment group. d Tumor volume after the adjuvant treatment (d14 from surgery). Student’s t-test (unpaired), SD. e Box plot of tumor volumes in ABv+IgG- vs anti-PD-1-treated groups during and after the adjuvant treatment. After the adjuvant treatment, the only tumor in the ABv+anti-PD-1 group was surgically biopsied for immunoprofiling. f Tumor immunoprofiles after the adjuvant treatment. The heatmap shows fold-changes compared to vehicle+IgG. N = 4 mice/group, except N = 1 in the biopsy. Cell populations derived from parental populations with less than 90 cells are marked with asterisk (*). g Survival of the mice. P-value: Difference between vehicle+IgG and ABv+anti-PD-1-treated mice. h Total white blood cell (WBC) and red blood cell (RBC) counts in the treatment groups. Student’s t-test (unpaired), SD. i Liver injury measured by plasma ALAT levels. Student’s t-test (unpaired), SD. j Average tumor sizes during (d11) adjuvant treatment with vehicle+anti-PD-1, paclitaxel+anti-PD-1, or ABv+anti-PD-1, and after the drug withdrawal (d15). Length of one treatment cycle is 10 days. p-value denotes the difference between post-adjuvant vehicle+anti-PD-1 and ABv+anti-PD-1. N = 3 (vehicle+anti-PD-1), 7 (Paclitaxel+anti-PD-1), 10 (1 cycle of ABv+anti-PD-1). SD, student’s t-test. k Survival of the mice. N = 6 (Paclitaxel+anti-PD-1), 2 (1 cycle of ABv+anti-PD-1), 3 (3 cycles of ABv+anti-PD-1)

References

    1. Bieche I, et al. Quantitation of MYC gene expression in sporadic breast tumors with a real-time reverse transcription-PCR assay. Cancer Res. 1999;59:2759–2765. - PubMed
    1. Cancer Genome Atlas Network. Comprehensive molecular portraits of human breast tumours. Nature490, 61–70 (2012). - PMC - PubMed
    1. Deming SL, Nass SJ, Dickson RB, Trock BJ. C-myc amplification in breast cancer: a meta-analysis of its occurrence and prognostic relevance. Br. J. Cancer. 2000;83:1688–1695. doi: 10.1054/bjoc.2000.1522. - DOI - PMC - PubMed
    1. Stephens PJ, et al. The landscape of cancer genes and mutational processes in breast cancer. Nature. 2012;486:400–404. doi: 10.1038/nature11017. - DOI - PMC - PubMed
    1. Naidu R, Wahab NA, Yadav M, Kutty MK. Protein expression and molecular analysis of c-myc gene in primary breast carcinomas using immunohistochemistry and differential polymerase chain reaction. Int. J. Mol. Med. 2002;9:189–196. - PubMed

Publication types

MeSH terms