. 2019 Feb 6;9(1):1505.
doi: 10.1038/s41598-018-38017-0.

FOXM1 modulates 5-FU resistance in colorectal cancer through regulating TYMS expression

Affiliations

FOXM1 modulates 5-FU resistance in colorectal cancer through regulating TYMS expression

Vidhya Varghese et al. Sci Rep. .

Abstract

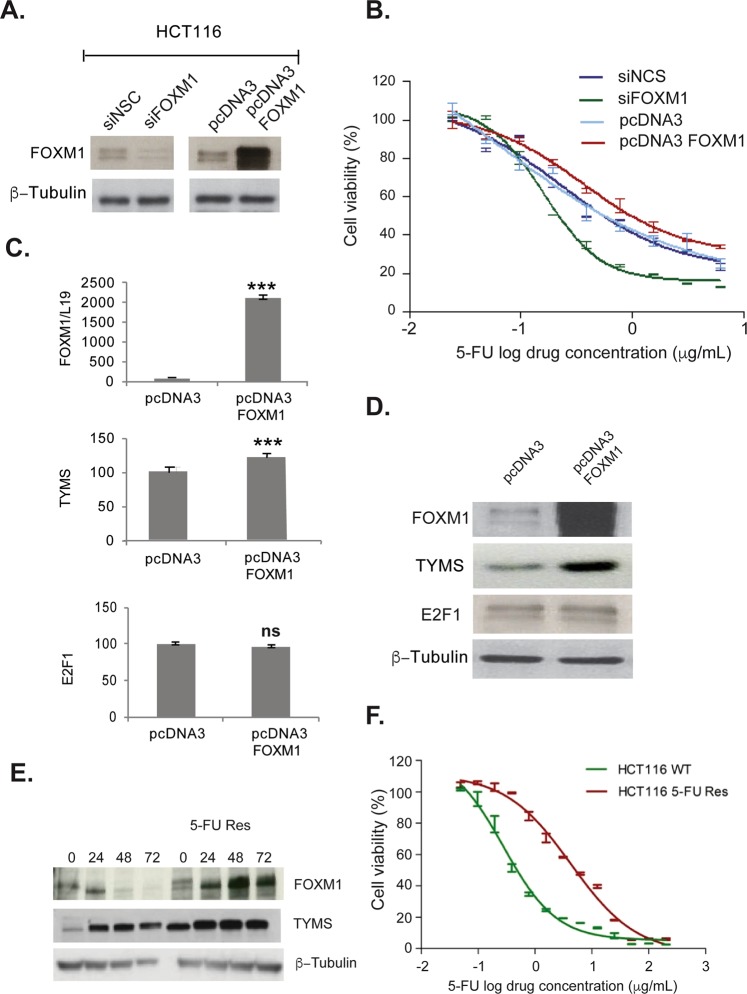
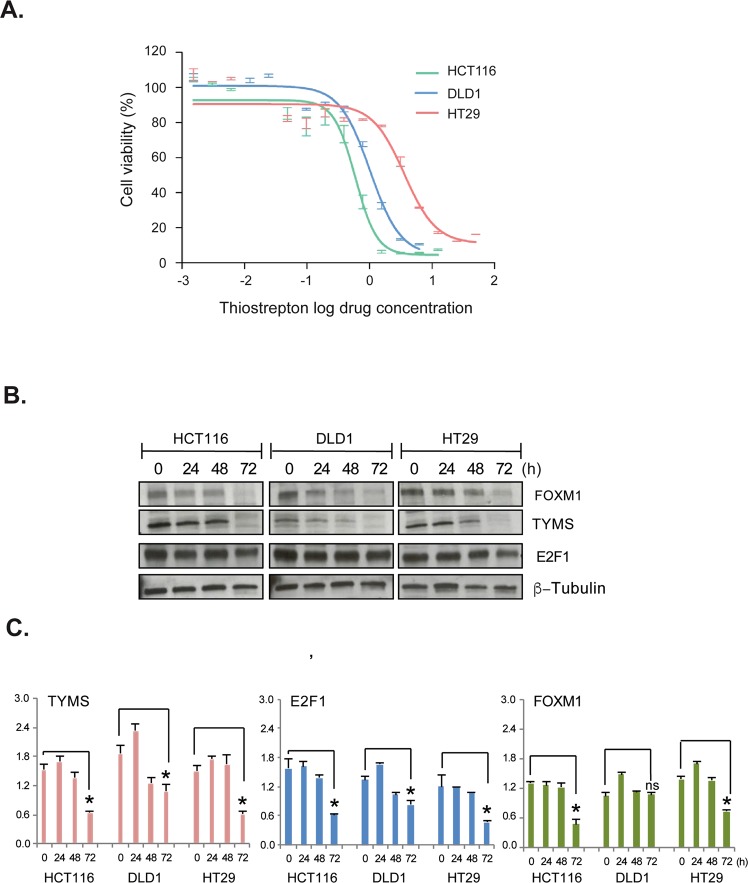
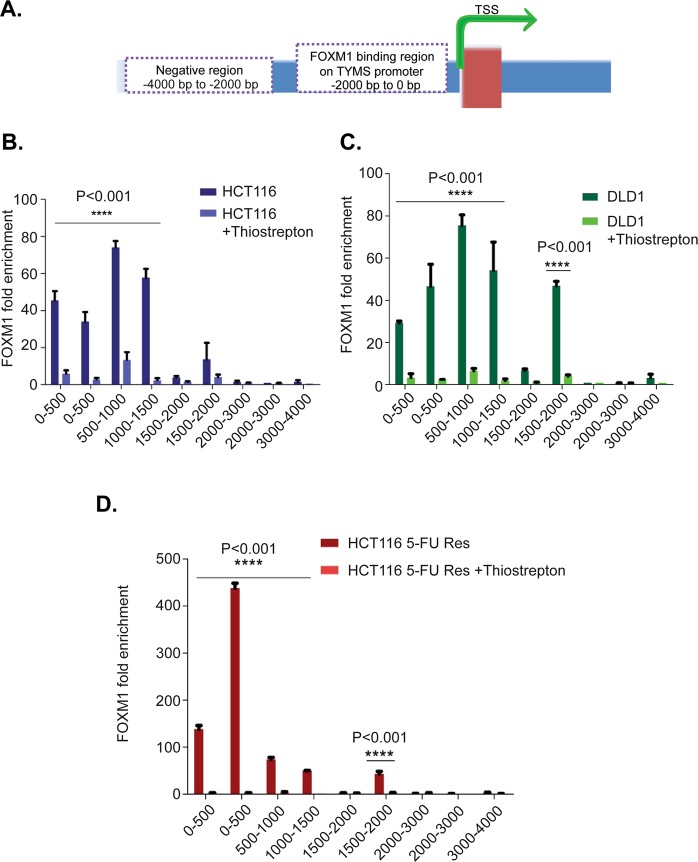
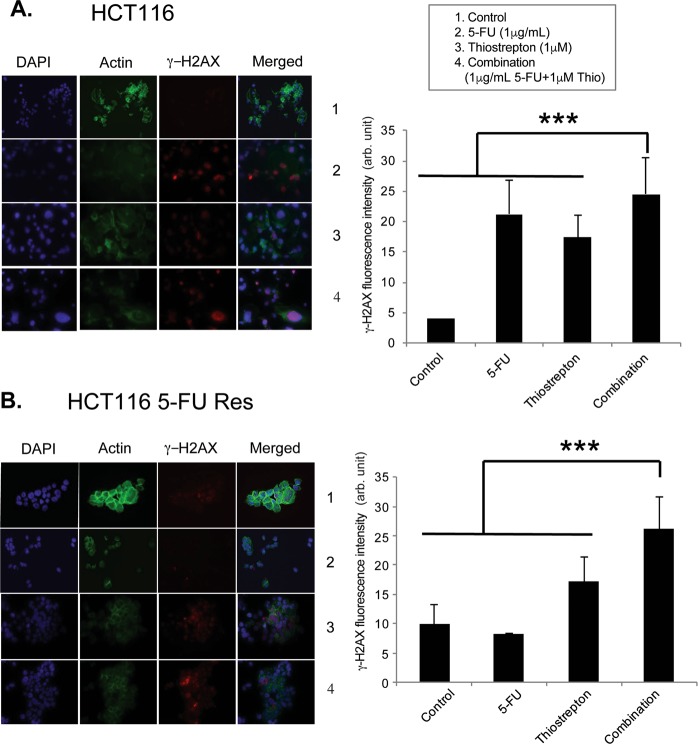
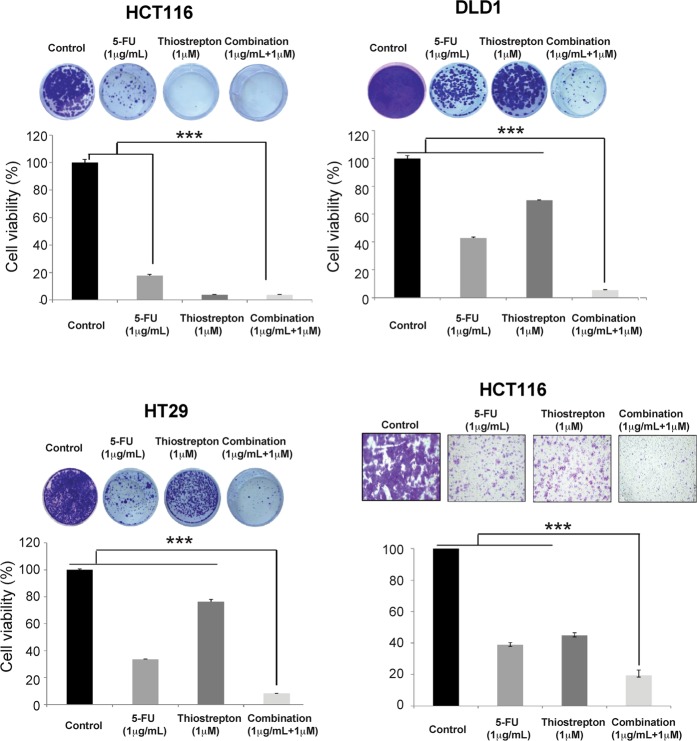
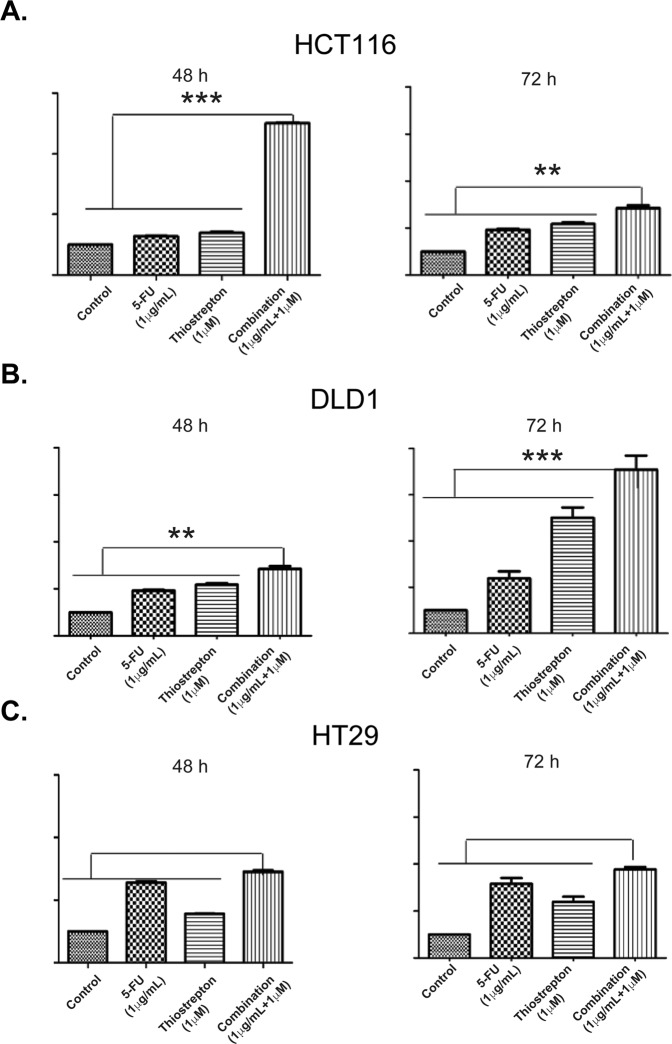
Resistance to 5-Fluoruracil (5-FU) has been linked to elevated expression of the main target, thymidylate synthase (TYMS), which catalyses the de novo pathway for production of deoxythymidine monophosphate. The potent oncogenic forkhead box transcription factor, FOXM1 is is regulated by E2F1 which also controls TYMS. This study reveals a significant role of FOXM1 in 5-FU resistance. Overexpression and knock-down studies of FOXM1 in colon cancer cells suggest the importance of FOXM1 in TYMS regulation. ChIP and global ChIP-seq data also confirms that FOXM1 can also potentially regulate other 5-FU targets, such as TYMS, thymidine kinase 1 (TK-1) and thymidine phosphorylase (TYMP). In human colorectal cancer tissue specimens, a strong correlation of FOXM1 and TYMS staining was observed. Elevated FOXM1 and TYMS expression was also observed in acquired 5-FU resistant colon cancer cells (HCT116 5-FU Res). A synergistic effect was observed following treatment of CRC cells with an inhibitor of FOXM1, thiostrepton, in combination with 5-FU. The combination treatment decreased colony formation and migration, and induced cell cycle arrest, DNA damage, and apoptosis in CRC cell lines. In summary, this research demonstrated that FOXM1 plays a pivotal role in 5-FU resistance at least partially through the regulation of TYMS.


Conflict of interest statement

The authors declare no competing interests.

Figures

Figure 1
Figure 1
Correlations between FOXM1 and TYMS in CRC. (A) Representative photographs of FOXM1 and TYMS, staining in human CRC tissue showing close similarity in protein expression patterns. Cytoplasmic FOXM1 expression levels were directly correlated with the TYMS expression in the TMA (p = 0.008, r = 0.314). The images above were taken from the A1, C8 and B12 cores: (B) SRB assay shows the average cell viability of colon cancer cells. HCT116, DLD1, and HT29 colon cancer cells were treated with 5-FU, ranging from 0 to 100 µg/ml for 72 h. IC50 values were: HCT116 0.6 ± 0.23, DLD1 0.7 ± 0.22, and HT29 3.09 ± 0.39 µg/ml. Results shown are mean and SD of three independent experiments, each with three replicates. IC50 values were determined by fitting a sigmoidal dose-response curve to the data using Graph Pad Prism. HCT116, DLD1, and HT29 cells were seeded at a 60–70% confluence, the cells were treated with 0.5 µg/ml 5-FU for 0, 6, 18, 24, and 48 h. Cells were trypsinised and harvested at the indicated time points for (C) RT-PCR and (D) western blot. Gene expression was quantified using a standard curve and normalised to the housekeeping gene L19. This HCT116 FOXM1, TYMS and E2F1 mRNA levels at 48 h. Error Bars represent standard deviation. Statistical significance was determined by student’s T-test (*p value < 0.05 0 h versus 48 h in HCT116 cells). The mRNA patterns were reflected in protein expression as shown in Western blots.
Figure 2
Figure 2
Overexpression of FOXM1 increases chemo-resistance to 5-FU. (A) HCT116 cells were transiently transfected with SiFOXM1 or FOXM1 pcDNA3 plasmid, after 48 h transfection cells were harvested and probed for FOXM1 by Western blotting. (B) HCT116 cells were transiently transfected with SiFOXM1 and FOXM1 pcDNA3 plasmid. After 48 h transfection cells were harvested and seeded in 96 well plate and treated with 5-FU for 72 h. Overexpressed FOXM1 increases chemoresistance in HCT116 cells measured using SRB assays, whereas SiFOXM1 HCT116 cells were more sensitive to treatment. Over-expression of FOXM1 is associated with increased TYMS mRNA (C) levels and protein expression (D) but did not affect E2F1. (E) HCT116 cells with acquired resistance to 5-FU (HCT116 5-FU Res) have higher basal expression of FOXM1 and TYMS compared to wild-type HCT116 cells, TYMS and FOXM1 remain elevated in the resistant cell line following treatment with 0.5 µg/ml of 5-FU. F) The IC50s show a 10 fold difference in sensitivity to 5-FU between the two cell lines (mean IC50, 0.54 μg/ml ± SD 0.03, n = 2) and HCT116 5-FU Res cells (mean IC50, 5.33 μg/ml ± SD 0.30, n = 3).
Figure 3
Figure 3
FOXM1 regulates TYMS in colon cancer. (A) Cells were treated with the FOXM1 inhibitor thiostrepton to detect cell viability. HCT116 IC50-0.65 ± 0.37 μM, DLD1 IC50-1.43 ± 0.02 μM, HT29 IC50-2.1 ± 0.98 μM. (B,C) HCT116, DLD1, and HT29 colon cancer cells were treated with 2 µM of thiostrepton for 0, 24, 48, and 72 h; cells were trypsinised and harvested at the time points indicated for western blot analysis and RT-PCR. (A) Protein lysates were prepared and expression levels were analysed by western blotting using antibodies for FOXM1, E2F1, TYMS and TK-1. β-tubulin was used as a loading control. mRNA expression indicates a significant decrease in FOXM1, TYMS, E2F1 and TK-1 levels (BE) at 72 h. Error Bars represent standard deviation. Statistical significance was determined by student’s T-test. (*p value < 0.05 versus control).
Figure 4
Figure 4
FOXM1 binding site on Thymidylate Synthase (TYMS) promoter region. (A) Schematic representation of FOXM1 binding sites in 0 to 2000 bp upstream of TYMS transcription start site (TSS). ChIP for FOXM1 was done followed by RT PCR to analyses the binding in the TYMS promoter region in HCT116 (B), DLD1 (C), HCT116 5-FU res (D) cell lines. Enrichment of FOXM1 at the TYMS promoter (0–2000 bp upstream) and no enrichment observed in the control (2000–4000 bp). Thiostrepton treatment significantly down-regulates FOXM1 binding on TYMS promoter. These experiments were done in triplicate. Error Bars represent standard deviation. Statistical significance was determined by 2 way annova using graph pad prism. (P value < 0.001).
Figure 5
Figure 5
Genome wide distribution of FOXM1 binding in HCT116 cells. (A) Venn diagram representing the shared FOXM1 peaks between HCT116 and DLD1 cells. (B) Graphs displaying statistics about the association of input genomic regions to the TSS of all the genes putatively regulated by the genomic regions. The ‘Number of associated genes per region’ graph shows how many genes each genomic region is assigned as putatively regulating based on the association rule used. (C) The distance to TSS graphs show the distance between input regions and their putatively regulated genes. The distances are divided into four separate bins: one from 0 to 5 kb, another from 5 kb to 50 kb, a third from 50 kb to 500 kb, and a final bin of all associations over 500 Kb. (D) Heat map showing FOXM1 binding events in HCT116 (right) and DLD1 (left) and HCT116 DLD1 shared reads. Heatmap was generated using ChAsE (Chromatin Analysis and Exploration) platform. Settings (peak extensions 5 kb upstream and 5 kb downstream of the peak summit and bin size 50 (bp). (E) The Integrative Genomics Viewer (IGV) browser was used to visualise the FOXM1 binding in down-stream targets. The input track has been subtracted from the data shown above. Blue peaks represent FOXM1 enrichment in 5-FU targets: TYMS, TYMP, and TK-1. (F) To confirm the IGV ChIP-seq data of FOXM1 binding, RT-PCR was carried out on HCT116 (A) and DLD1 (B) cells. The result shows FOXM1 binding on TK-1, TYMP, E2F1, E2F2, MMP2, and MLH1. P38, which is not a FOXM1 regulator, does not show any FOXM1 enrichment.
Figure 6
Figure 6
Combination of thiostrepton and 5-FU increases DNA damage in colon cancer cells. Combination of thiostrepton and 5-FU increases DNA damage in (A) HCT116 wt and (B) HCT116 5-FU res cell lines. Both cells were treated with 1 µg/ml of 5-FU, 1 µM of thiostrepton and combination for 24 h and stained with DAPI, tubulin and γH2AX antibodies. Combination of thiostrepton and 5-FU increases DNA damage in both cells. The combination of 5-FU and thiostrepton significantly increases γH2AX staining in HCT116 cells compared to control and either drugs alone ***p < 0.01. The combination of 5-FU and thiostrepton significantly increases γH2AX staining in HCT116 5-FU Res cells compared to control and either drugs alone ***p < 0.001. Images were visualized by microscopy. Images: original magnification X 40. Images were quantified using ImageJ software.
Figure 7
Figure 7
Combination treatment significantly inhibits tumour colony formation. (AC) Clonogenic assays showing HCT116, DLD1 and HT29 cells lines treated with 5-FU (1 μg/ml) and thiostrepton (Thio) (1 μM) alone or in combination for 72 hours, followed by media replacement and culture for 14 days. The combination of 5-FU and thiostrepton significantly decreases colony formation in HCT116, DLD1 and HT29 cells. Data were represented as mean ± SD (n = 3). ***p < 0.0001. (D) 5-FU and thiostrepton combination significantly decreases migration of colorectal cancer cells, HCT116. Data were represented as mean ± SD (n = 2) (5-FU with combination p < 0.0001, thiostrepton with combination p < 0.0001).
Figure 8
Figure 8
Combination treatment induces caspase-dependent apoptosis in colon cancer cells. Cellular caspase 3/7 activity measured in HCT116, DLD1 and HT29 cells following treatment with 5-FU (1 μg/ml) and thiostrepton (1 μM) alone or in combination for 48 and 72 hours. Data were represented as mean ± SD (n = 3). (A) 5-FU and thiostrepton combination significantly increased apoptosis compared to either agent alone or control HCT116 48 hours (p < 0.0001); HCT116 72 hours (p < 0.006). (B) DLD1 48 hours (p < 0.006); 72 hours (p < 0.0001). (C) HT29 48 hours (p < 0.005); 72 hours (p < 0.0001).

References

    1. Haggar FA, Boushey RP. Colorectal cancer epidemiology: incidence, mortality, survival, and risk factors. Clin Colon Rectal Surg. 2009;22:191–197. doi: 10.1055/s-0029-1242458. - DOI - PMC - PubMed
    1. Cancer Research UK-2014. Bowel cancer statistics. Cancer Research UK (2014).
    1. Giuliani J, Bonetti A. The Pharmacological Costs of First-Line Therapies in Unselected Patients With Advanced Colorectal Cancer: A Review of Published Phase III Trials. Clin Colorectal Cancer. 2016;15:277–284. doi: 10.1016/j.clcc.2016.07.002. - DOI - PubMed
    1. Aspinall SL, et al. Adjuvant chemotherapy for stage III colon cancer: relative dose intensity and survival among veterans. BMC Cancer. 2015;15:62. doi: 10.1186/s12885-015-1038-y. - DOI - PMC - PubMed
    1. Cardinale D, et al. Protein-protein interface-binding peptides inhibit the cancer therapy target human thymidylate synthase. Proc Natl Acad Sci USA. 2011;108:E542–549. doi: 10.1073/pnas.1104829108. - DOI - PMC - PubMed

Publication types

MeSH terms