. 2019 Feb;566(7743):224-229.
doi: 10.1038/s41586-019-0917-9. Epub 2019 Feb 6.

Ultra-large library docking for discovering new chemotypes

Affiliations

Ultra-large library docking for discovering new chemotypes

Jiankun Lyu et al. Nature. 2019 Feb.

Abstract

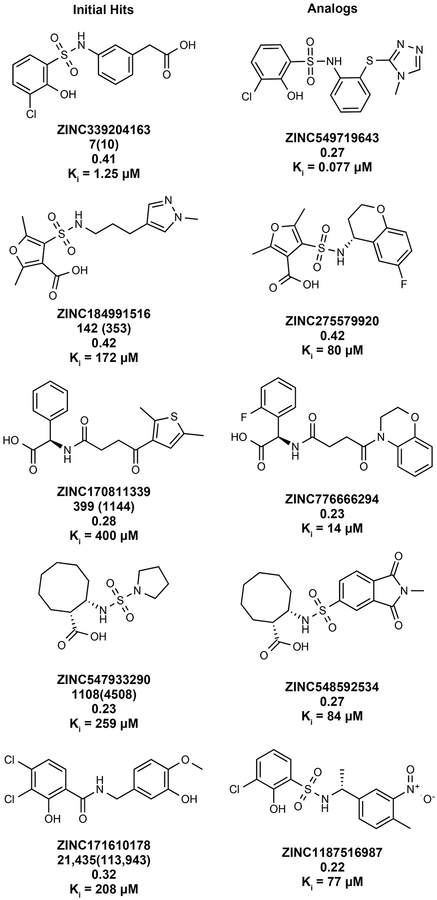
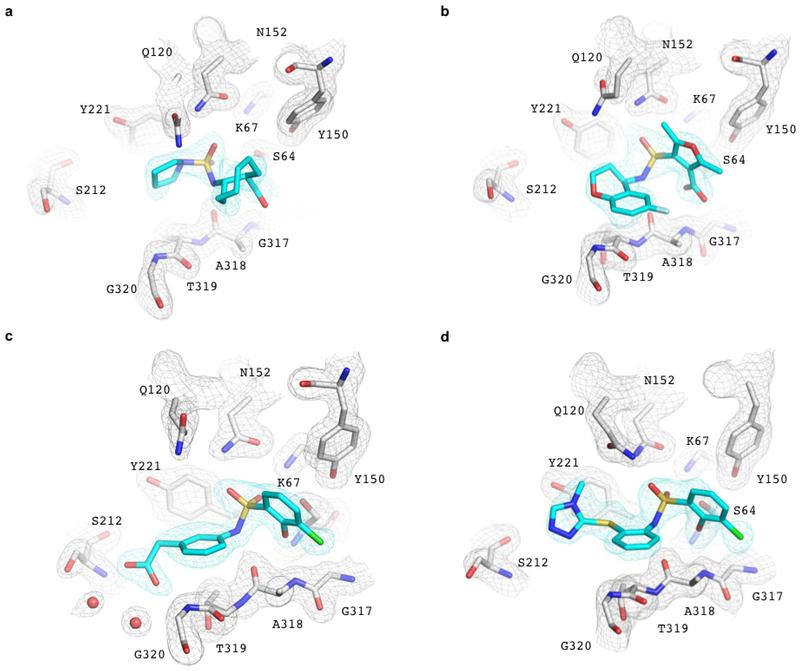
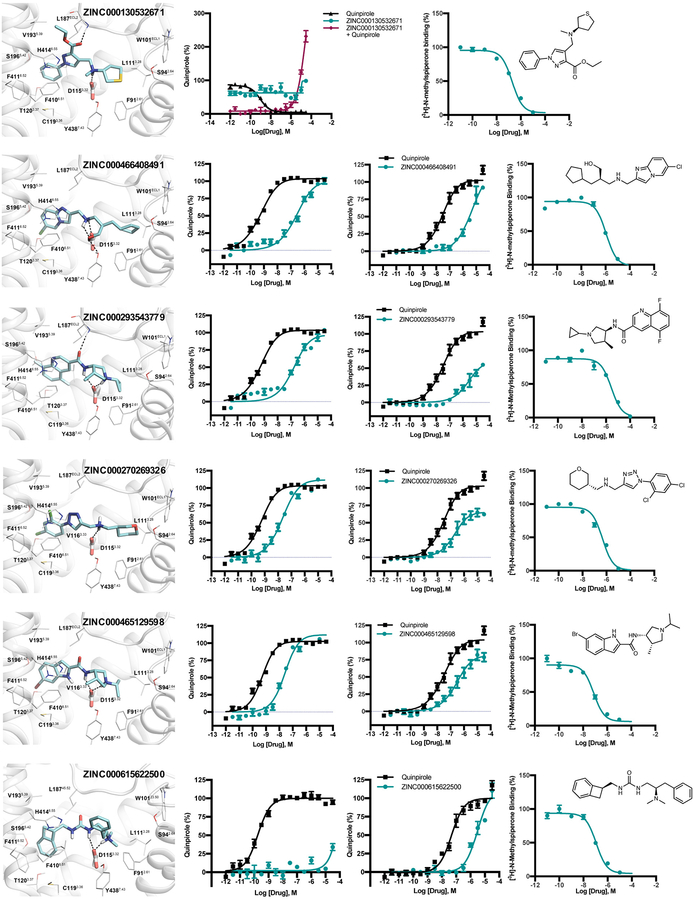
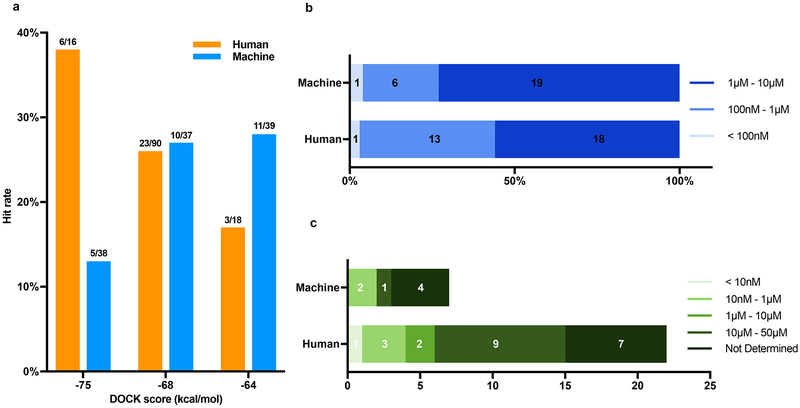
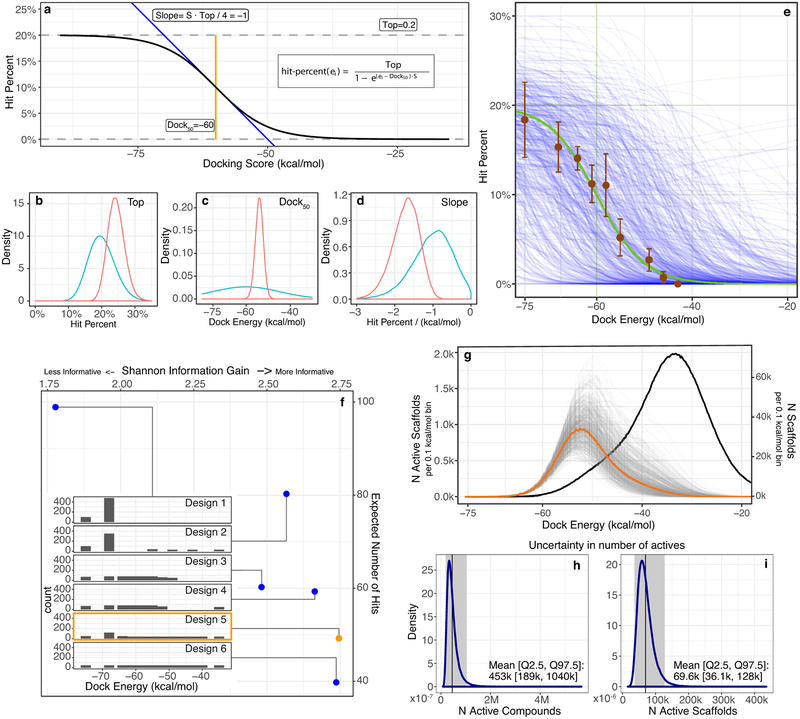
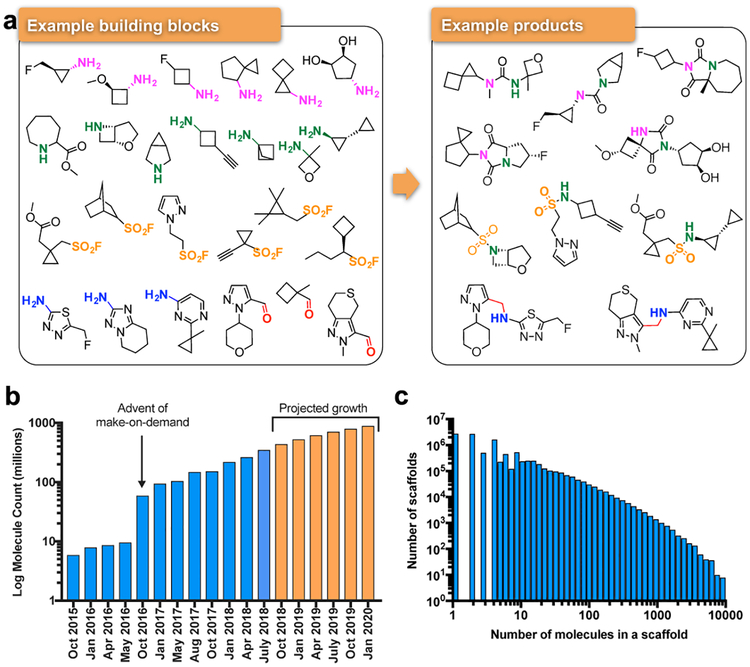
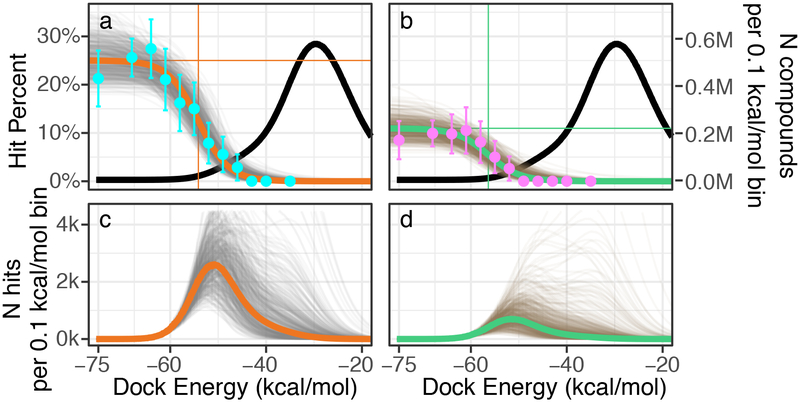
Despite intense interest in expanding chemical space, libraries containing hundreds-of-millions to billions of diverse molecules have remained inaccessible. Here we investigate structure-based docking of 170 million make-on-demand compounds from 130 well-characterized reactions. The resulting library is diverse, representing over 10.7 million scaffolds that are otherwise unavailable. For each compound in the library, docking against AmpC β-lactamase (AmpC) and the D4 dopamine receptor were simulated. From the top-ranking molecules, 44 and 549 compounds were synthesized and tested for interactions with AmpC and the D4 dopamine receptor, respectively. We found a phenolate inhibitor of AmpC, which revealed a group of inhibitors without known precedent. This molecule was optimized to 77 nM, which places it among the most potent non-covalent AmpC inhibitors known. Crystal structures of this and other AmpC inhibitors confirmed the docking predictions. Against the D4 dopamine receptor, hit rates fell almost monotonically with docking score, and a hit-rate versus score curve predicted that the library contained 453,000 ligands for the D4 dopamine receptor. Of 81 new chemotypes discovered, 30 showed submicromolar activity, including a 180-pM subtype-selective agonist of the D4 dopamine receptor.


Conflict of interest statement

Competing Financial Interests: BKS & JJI declare a competing financial interest; they are founders of a company, BlueDolphin LLC, that works in the area of molecular docking. No other authors declare a competing financial interest.

Figures

Extended Data Fig. 1 |
Extended Data Fig. 1 |. Simulating the effect of library size on ligand enrichment among the top 1,000 docked molecules.
The energy distribution of a. ligands and b. decoys from docking enrichment calculations against AmpC β-lactamase. The skewed normal fitting curves are plotted in red lines. The fitting parameters (α, loc and scale values) are shown. c. Heatmaps of number of active molecules in the top 1,000 docked molecules for six targets. The number of ligands in the top 1,000 docked molecules for a given library size and the ratio of ligands/decoys is colored in a log10 scale from 1 (blue) to 1,000 (red). Cells with zero ligands are colored white. d. Large-library docking screens of AmpC (top, N=99 million molecules) and D4 (bottom, N=138 million molecules). Known binders and close analogs are treated as ligands and the rest of the molecules are treated as decoys. Panel on the left: the energy distributions of decoys (grey), ligands defined by ECFP4 Tc similarity ≥ 0.5 (blue), 0.6 (green) and 0.7 (orange) to ligands from ChEMBL. Middle Panel: heatmaps of number of ligands in the top 1000 docked molecules based on fit on full-library docking with the ligands (AmpC, Tc ≥ 0.5, green; D4, Tc ≥ 0.6, orange) and decoys (grey) distributions. Right panel: number of ligands in the top 1,000 docked molecules as the library grows based on actual distributions plotted in left most panel. The data are the mean ± SD from 20 samples (See Supplementary Table 1 for retrospective performance on three more targets).
Extended Data Fig. 2 |
Extended Data Fig. 2 |. Initial hits and selected analogs against AmpC β-lactamase.
5 initial hits are shown in the first column. For each compound, the first row is the ZINC ID; the second row is the cluster rank (position in cluster head list sorted by DOCK score) with global rank (position in unclustered hit list sorted by DOCK score) in the brackets; the third row is the Tc value (Tanimoto coefficient to known AmpC inhibitors in ChEMBL); the fourth row is the Ki value. Five selected analogs for the corresponding hits are shown in the second column. For each compound, the first row is the ZINC ID; the second row is the Tc value; the third row is the Ki value.
Extended Data Fig. 3 |
Extended Data Fig. 3 |. Lineweaver-Burk plot and Ki analysis for analogs of each of the five series of AmpC inhibitors.
(a-f) Lineweaver-Burk plots for ‘6291 (a), ‘9920 (b), ‘2532 (c), ‘6987 (d), ‘4163 (e), and ‘9643 (f) indicating competitive inhibition. IC50 values were determined by non-linear regression fit in GraphPad Prism, and Ki values calculated by a replot of the slope of each Lineweaver-Burk plot versus the corresponding inhibitor concentration.
Extended Data Fig. 4 |
Extended Data Fig. 4 |. Electron density maps for AmpC/inhibitor complexes.
The initial Fo-Fc electron density map contoured at 2.5σ around the inhibitor (density in cyan) with refined 2Fo-Fc electron density contoured at 1σ for enzyme residues for the complexes with compounds a.3290, b. ‘9920, c. ‘4163 and d. ‘9643. Inhibitor carbons in cyan and enzyme carbons in grey, oxygens red, nitrogens blue, sulfurs yellow and chlorides green.
Extended Data Fig. 5 |
Extended Data Fig. 5 |. Selected D4 hits from docking 138 million make-on-demand molecules.
Six ligands with docked poses (first column), cAMP Gαi/o activities (second column), Tango β-arrestin activities (third column) and [3H]-N-methylspiperone displacement and chemical drawing (fourth column) are shown. The receptor structure is in grey and ligand carbons are in teal. Ballesteros-Weinstein residue numbering in superscript. Functional assays represent normalized concentration-response curves of the ligands in cloned human D4-mediated activation of Gαi/o and β-arrestin translocation. The data are the mean ± SEM from three assays. The first row shows an example of an antagonist identified among the D4 hits. Both agonist (teal curve) and antagonist (purple curve) modes are shown for ZINC000130532671 in the third panel; the concentration of Quinpirole in the antagonist mode was 100 nM.
Extended Data Fig. 6 |
Extended Data Fig. 6 |. Pre-clustering the docking library yields much worse scores of scaffold representatives compared to full library docking.
Comparison of energy distributions of scaffold representatives between full library docking (orange) and pre-clustered library docking for a) D4 and b) AmpC using four strategies: the closest member to the centroid of molecular weights and clogP (blue), the closest member to the centroid of molecular weights (pink), the member with the largest molecular weights (magenta) and the member with the smallest molecular weights (green). The inset shows the ratio of the number of molecules at a given docking score for full library docking divided by the number at that score when only cluster representatives are docked (colored by clustering method). For each target, two examples illustrate the effect on our experimentally active scaffold families. c) D4, d) AmpC. The scaffold for each molecule is highlighted in red. The ZINC ID, post-cluster rank and pre-cluster rank are labelled for each pair. The arrow color is as for the pre-clustering methods in panels a and b
Extended Data Fig. 7 |
Extended Data Fig. 7 |. Comparison of hit rates achieved by combined docking score and human prioritization vs. by docking score alone.
a) The hit rates from selecting compounds at different scoring ranges by each strategy: human prioritization and docking score (orange), docking score alone (blue). Hit rate is actives/tested; the raw numbers appear at the top of each bar. b) Binding affinity level distribution among the hits from panel a. There are 32 hits from human prioritization and docking score, and 26 from docking score alone. These are divided into three affinity ranges: < 100 nM (pale blue); 100 nM - 1 μM (blue); 3) 1 – 10 μM (dark blue). c) Functional activity distribution among the hits from panel b. There are 22 molecules from human prioritization and docking score, and 7 molecules from docking score alone. These are divided in five activity ranges: < 10 nM (pale green); 10 nM - 1 μM (light green); 1 μM - 10 μM (olive); 10 μM - 50 μM (forest green); 5) not determined (dark green).
Extended Data Fig. 8 |
Extended Data Fig. 8 |. Bayesian Prior modeling for balancing information gain and ligand discovery in molecule-selection design and error estimation.
a) Sigmoid functional form for the hit-rate model. b-d) Marginal Bayesian prior (teal) and posterior (red) distributions (n=200,000) for each model parameter b) Top, c) Dock50 and d) Slope. e) Estimated hit-rate based on evaluation by the authors of the docked poses before any molecules were tested (brown: mean (n compound = 200, 220, 230, 230, 285, 235, 210, 230, 200) ± stddev. (n experts = 5,4,4,4,4,4,4,4,4)), the prior mean (green), and samples (n=200) from the prior (blue). f) Candidate (blue) and chosen (orange) experimental designs (Inset Designs 1–6), with expected number of hits and information gain for each. g) Expected number of active scaffolds (orange: mean, gray: posterior draws n=200,000) superimposed on the total number of scaffold cluster heads (black). h-i) Marginal distribution of the number of active compounds (h) and scaffolds (i) over the posterior distributions (n=200,000).
Fig. 1 |
Fig. 1 |. Make-on-demand compounds are diverse and have increased exponentially.
a. Characteristic reagents, reactions, and products in the make-on-demand library. b. The expansion of the make-on-demand library; orange bars represent projected growth. c. The distribution of compounds among the 10.7 million scaffolds in the library.
Fig. 2 |
Fig. 2 |. Structural fidelity between docked-predicted and crystallographically-determined poses of the new β-lactamase inhibitors.
Crystal structures of the inhibitors (carbons in cyan) overlaid with their docking predictions (magenta). AmpC carbon atoms in grey, oxygens in red, nitrogens in blue, sulfurs in yellow, chlorides in green, fluorides in light blue. Hydrogen bonds are shown as black dashed lines. The AmpC complexes with a. ‘3290 (PDB 6DPZ, RMSD 1.3 Å); b. ‘9920 (PDB 6DPY, RMSD 1.2 Å for the warhead); c. The 1.3 μM inhibitor ‘4163 (PDB 6DPX; RMSD 0.98 Å) and d. its 77 nM analog ‘9643 (PDB 6DPT, RMSD 1.52 Å). e. Close up of the ‘9643 phenolate in the oxyanion hole. Extended Fig. 4 shows electron density.
Fig. 3 |
Fig. 3 |. Testing 549 molecules at different docking ranks against the D4 dopamine receptor.
a. Displacement of the antagonist 3H-N-methylspiperone by each of the 549 molecules tested at 10 μM (mean ± SEM of three assays). The molecules are colored by their docking score. The number of binders (<50% remaining radio-ligand—below the dashed line) diminish with docking score. b. Six actives, each a different scaffold. c. Docked poses of ‘2964 (left panel), ‘8888 (middle panel), and superposed ‘3143 and ‘3144 (right panel). The receptor helices are shown in ribbon, the conserved D115. is shown in stick, interacting residues within 4Å of the docked molecules are shown as lines. Ballesteros-Weinstein residue numbering in superscript. Modeled hydrogen bonds are in dashed lines. d. cAMP functional assays of the 180 pM full agonist ‘3144 (orange) and the 10 nM partial agonist ‘1011 (blue, agonist mode, purple, antagonist mode (‘1011+100 nM Quinpirole)). The data are the mean ± SEM from three assays. e. Gαi/o BRET and arrestin BRET functional assays of the 180 pM full agonist ‘3144 (Gαi/o, orange; arrestin, red) and the unbiased ligand Quinpirole (Gαi/o, black; arrestin, blue). The data are the mean ± SEM from three assays. f. The effect of pre-clustering on docking scores: the orange curve is the distribution of the best-scoring scaffold representative, the blue curve is the score distribution from pre-clustering and choosing only single cluster representatives to dock.
Fig. 4 |
Fig. 4 |. Estimating the number of active D4 dopamine receptor ligands in the 138 million compound library.
Top row). Left y-axis, the hit-rate of 549 tested compounds, right y-axis, distribution of library compounds by docking energy (black curve). a. Modeling the number of library compounds with Ki values ≤ 10 μM. Top = 24%; Bottom = 0%; Dock50 = −54 kcal/mol; and Slope50 = −1.7 % / (kcal/mol). Cyan points represent the hit-rate means and standard errors at each docking energy bin, with 47,121, 51, 38, 37, 40, 38, 36, 35, 36, 35, 35 compounds tested in each bin, from best to worst scoring. The gold curve gives the mode and the gray curves give the draws (n=500) from the Bayesian posterior distribution (i.e., the envelope of possible distributions). b. Modeling the number of library compounds with Ki values ≤ 1 μM. Top = 11%; Bottom = 0%; Dock50 = −56 kcal/mol; and Slope = −2.8 % / (kcal/mol). Magenta points represent the hit-rate means and standard errors at each docking energy bin. The green curve gives the mode and the gray curves give the draws from the Bayesian posterior distribution. Bottom row). c. Predicted number of actives by docking energy under the hit-rate model for the 10 μM model and d. the 1 μM model, with the mode (gold; green) and draws (gray; brown) from the respective posterior distributions. Expected total actives for the 10 μM model = 453,000 (188,000–1,035,000, 95% inter-quantile range) and for the 1 μM model = 158,000 (38,000–489,000, 95% inter-quantile range).

Comment in

References

    1. Bohacek RS, McMartin C & Guida WC The art and practice of structure-based drug design: A molecular modeling perspective. Medicinal Research Reviews 16, 3–50, (1996). - PubMed
    1. Ertl P Cheminformatics Analysis of Organic Substituents: Identification of the Most Common Substituents, Calculation of Substituent Properties, and Automatic Identification of Drug-like Bioisosteric Groups. Journal of Chemical Information and Computer Sciences 43, 374–380, (2003). - PubMed
    1. Fink T, Bruggesser H & Reymond JL Virtual Exploration of the Small-Molecule Chemical Universe below 160 Daltons. Angewandte Chemie International Edition 44, 1504–1508, (2005). - PubMed
    1. Chevillard F & Kolb P SCUBIDOO: a large yet screenable and easily searchable database of computationally created chemical compounds optimized toward high likelihood of synthetic tractability. Journal of chemical information and modeling 55, 1824–1835 (2015). - PubMed
    1. Keserü GM & Makara GM The influence of lead discovery strategies on the properties of drug candidates. Nature Reviews Drug Discovery 8, 203, (2009). - PubMed

References to Online Methods

    1. Hawkins PC, Skillman AG, Warren GL, Ellingson BA & Stahl MT Conformer generation with OMEGA: algorithm and validation using high quality structures from the Protein Databank and Cambridge Structural Database. Journal of chemical information and modeling 50, 572–584 (2010). - PMC - PubMed
    1. AMSOL 7.1, University of Minnesota, Minneapolis: (2004).
    1. Wei BQ, Baase WA, Weaver LH, Matthews BW & Shoichet BK A model binding site for testing scoring functions in molecular docking. Journal of molecular biology 322, 339–355 (2002). - PubMed
    1. Mysinger MM & Shoichet BK Rapid context-dependent ligand desolvation in molecular docking. Journal of chemical information and modeling 50, 1561–1573 (2010). - PubMed
    1. Sterling T & Irwin JJ ZINC 15 – Ligand Discovery for Everyone. Journal of Chemical Information and Modeling 55, 2324–2337, (2015). - PMC - PubMed

Publication types

MeSH terms