. 2019 Feb;566(7743):270-274.
doi: 10.1038/s41586-019-0916-x. Epub 2019 Feb 6.

Anti-tumour immunity controlled through mRNA m6A methylation and YTHDF1 in dendritic cells

Affiliations

Anti-tumour immunity controlled through mRNA m6A methylation and YTHDF1 in dendritic cells

Dali Han et al. Nature. 2019 Feb.

Erratum in

Abstract

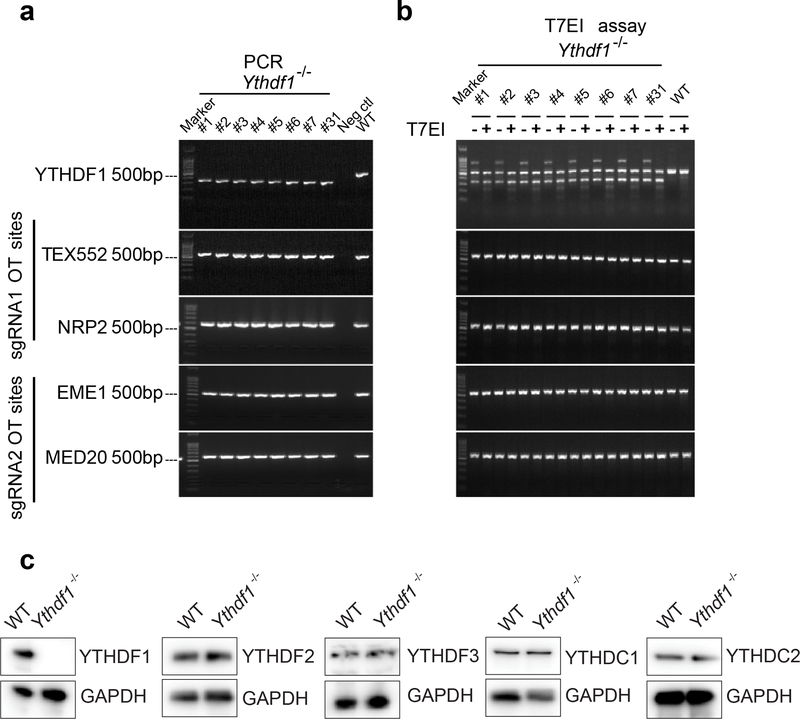
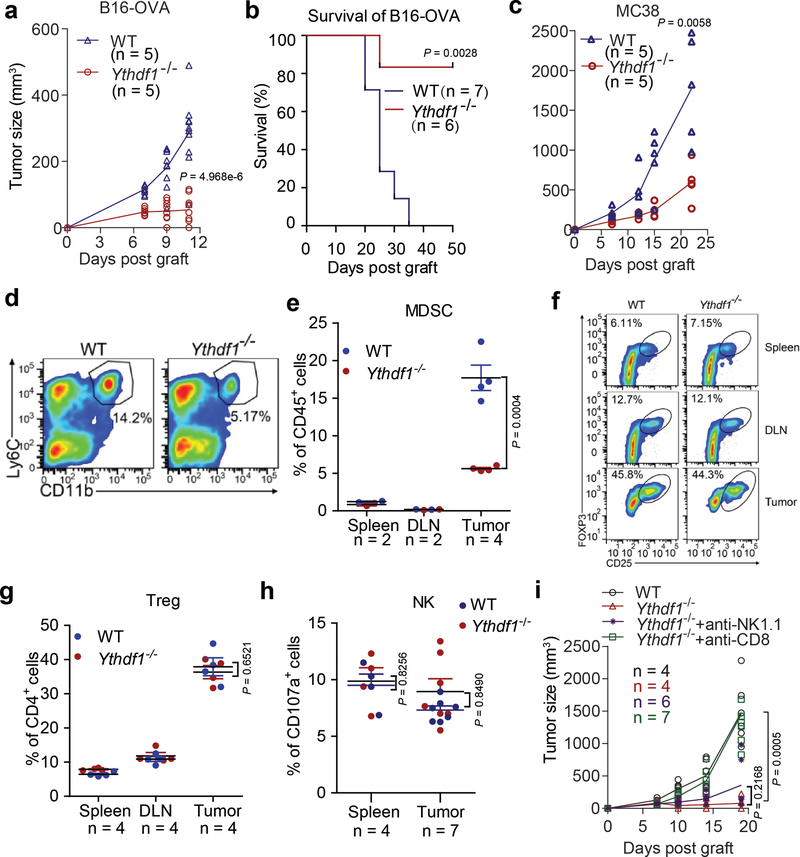
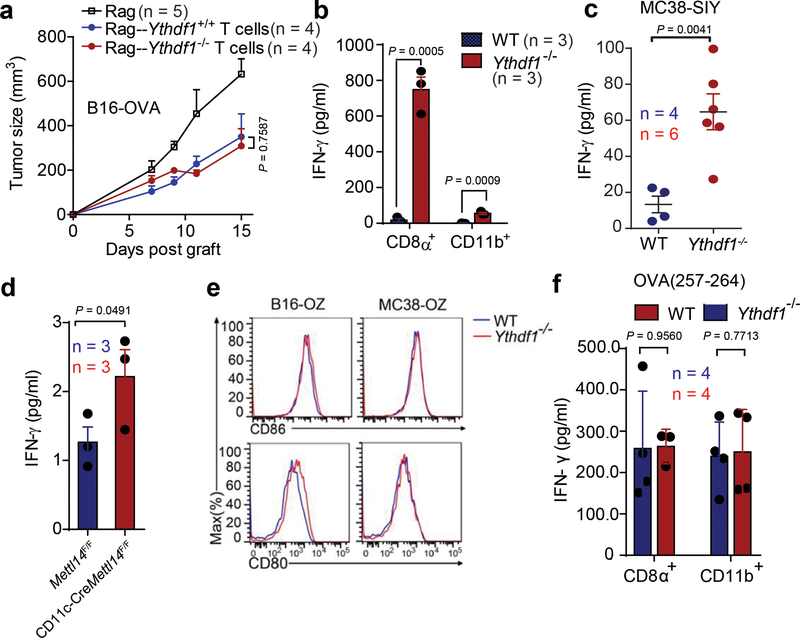
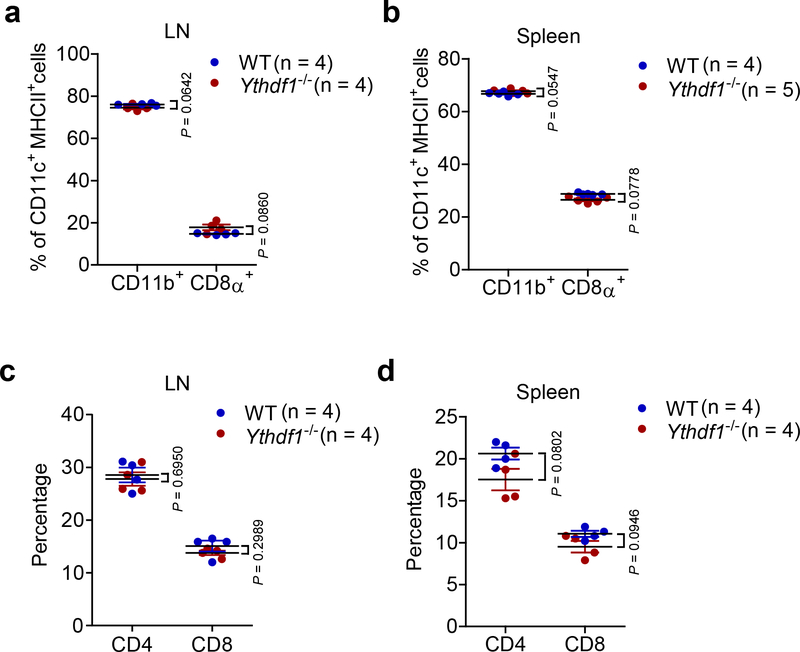
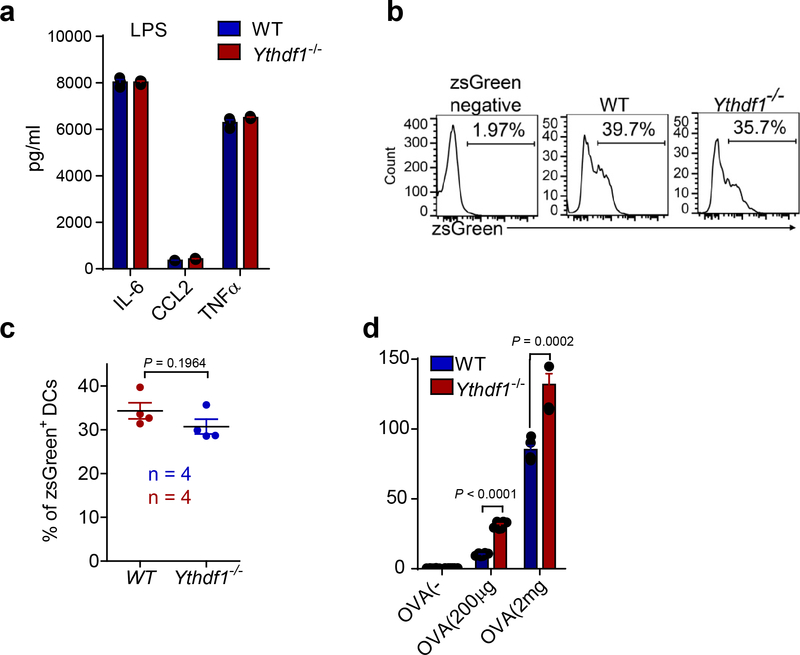
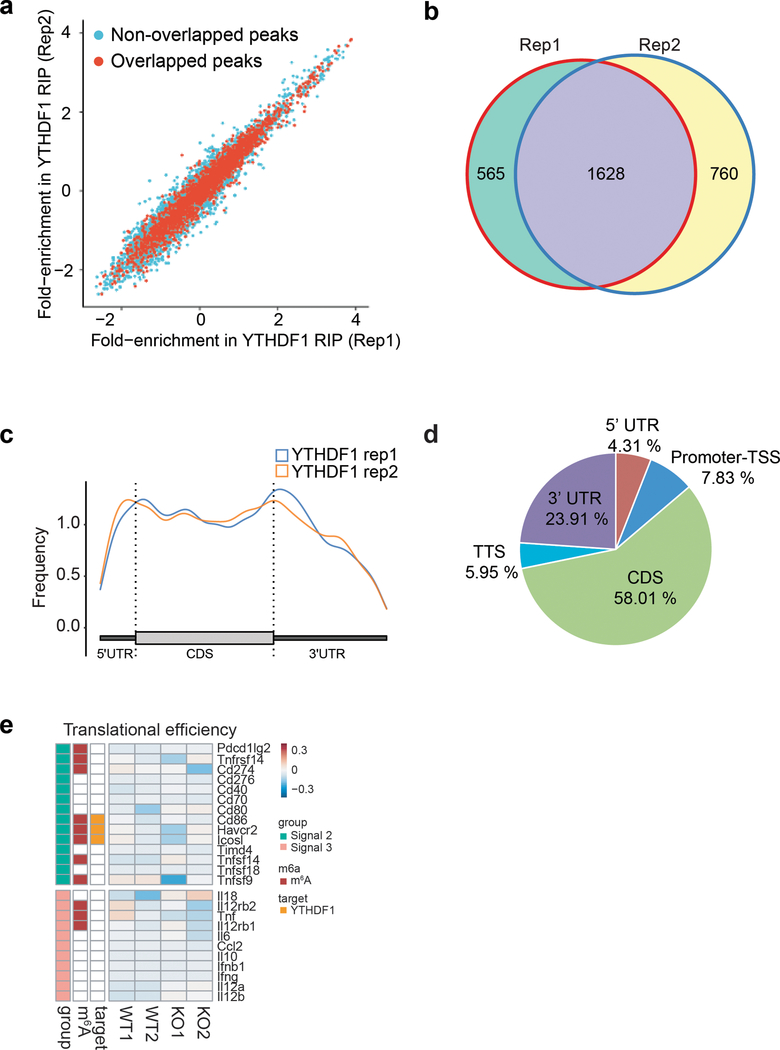
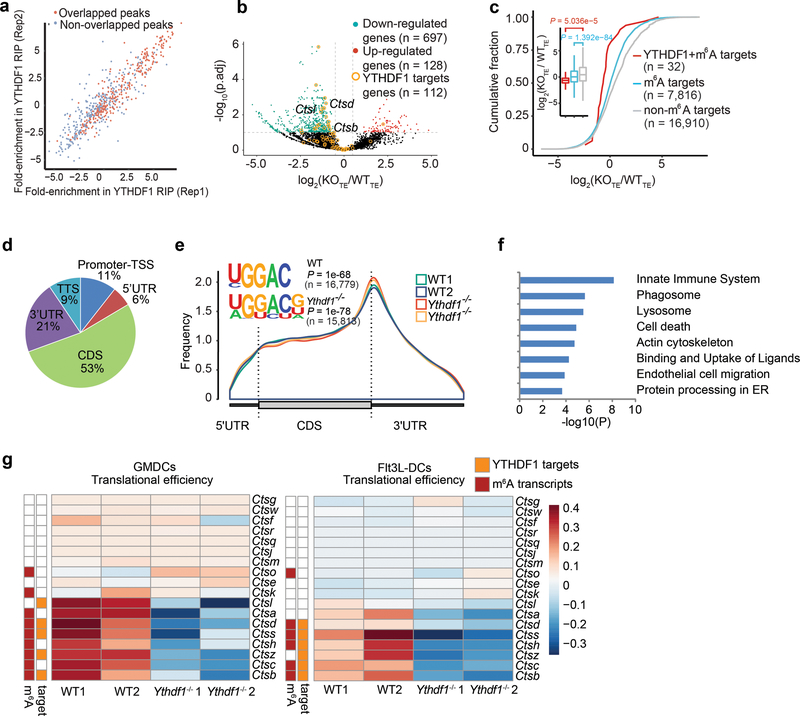
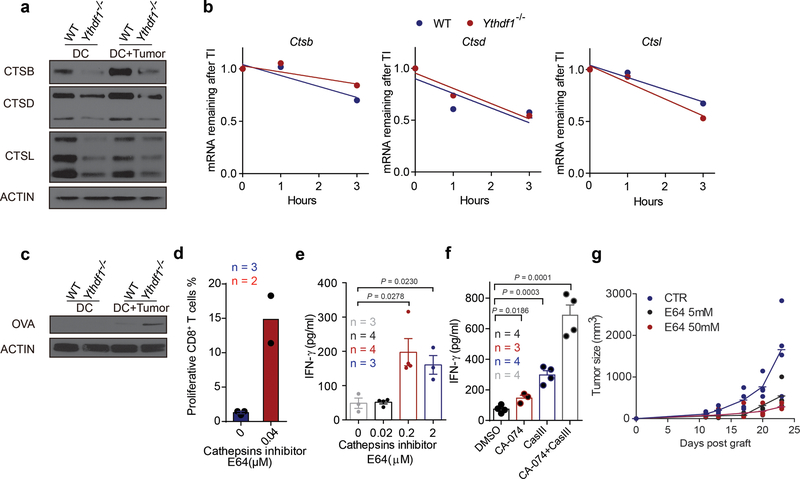
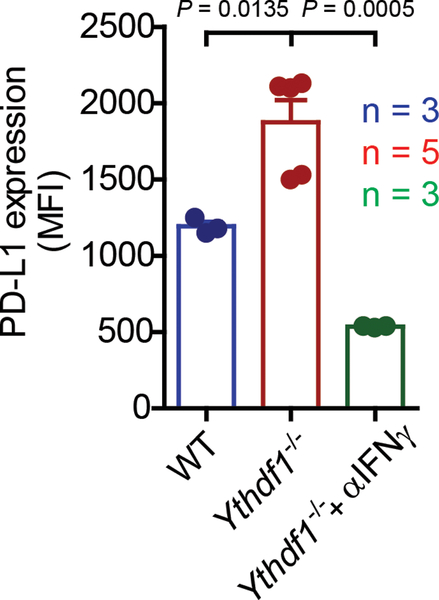
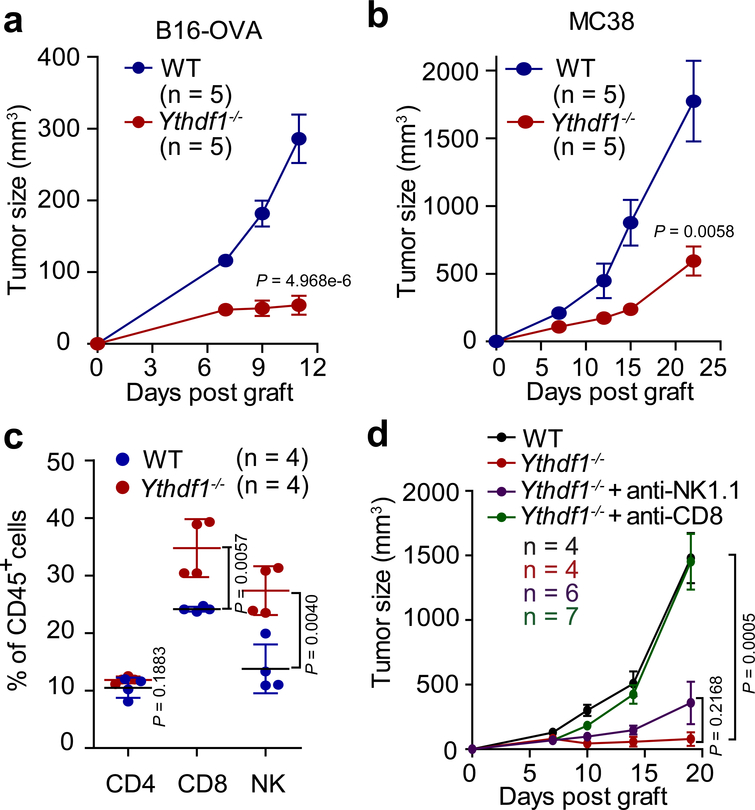
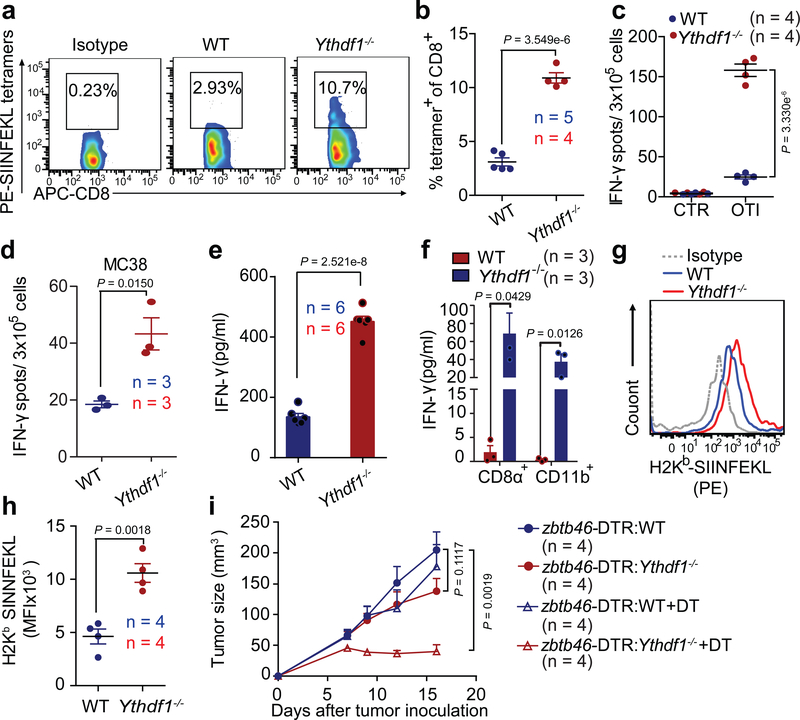
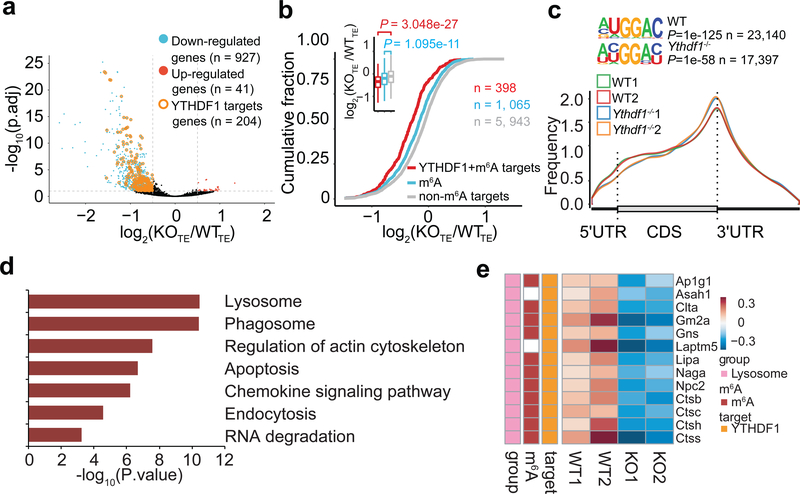
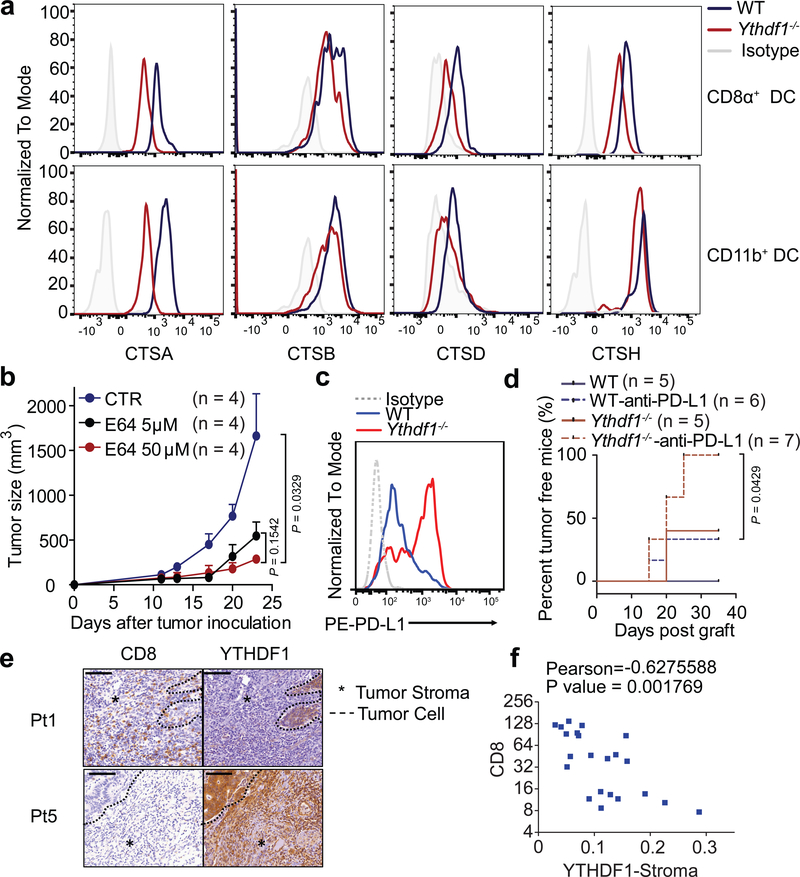
There is growing evidence that tumour neoantigens have important roles in generating spontaneous antitumour immune responses and predicting clinical responses to immunotherapies1,2. Despite the presence of numerous neoantigens in patients, complete tumour elimination is rare, owing to failures in mounting a sufficient and lasting antitumour immune response3,4. Here we show that durable neoantigen-specific immunity is regulated by mRNA N6-methyadenosine (m6A) methylation through the m6A-binding protein YTHDF15. In contrast to wild-type mice, Ythdf1-deficient mice show an elevated antigen-specific CD8+ T cell antitumour response. Loss of YTHDF1 in classical dendritic cells enhanced the cross-presentation of tumour antigens and the cross-priming of CD8+ T cells in vivo. Mechanistically, transcripts encoding lysosomal proteases are marked by m6A and recognized by YTHDF1. Binding of YTHDF1 to these transcripts increases the translation of lysosomal cathepsins in dendritic cells, and inhibition of cathepsins markedly enhances cross-presentation of wild-type dendritic cells. Furthermore, the therapeutic efficacy of PD-L1 checkpoint blockade is enhanced in Ythdf1-/- mice, implicating YTHDF1 as a potential therapeutic target in anticancer immunotherapy.


Conflict of interest statement

Competing interests C.H. is a scientific founder and a member of the scientific advisory board of Accent Therapeutics, Inc. A patent application on YTHDF1 has been filed by the University of Chicago.

Figures

Extended Data Fig. 1 |
Extended Data Fig. 1 |. Deletion efficacy of Ythdf1−/− mice.
a-b, Off-target analysis of the CRISPR/Cas9 system in Ythdf1−/− mice. (a) Ythdf1 sgRNA targeting sites and four putative off-target sites were amplified. (b) PCR products of Ythdf1−/− mice and WT mice were mixed and digested by T7EI. The PCR product from WT mice was used as negative control. c, Immunoblot assays were shown to validate YTH protein expression level changes in Ythdf1−/− DCs. Data are representative of one experiment (a, b) and two independent biological replications for (c).
Extended Data Fig. 2 |
Extended Data Fig. 2 |. Characterizations of immune phenotypes of Ythdf1-deficient mice.
(a) data points for Fig. 1a. (b) WT or Ythdf1−/− mice were injected s.c. with 106 B16-OVAcells. Tumor survival were monitored. Mice with tumor volumes less than 200 mm3 are considered to be surviving. One of three representative experiments is shown. (c) data points for Fig. 1b. d-h, WT or Ythdf1−/− mice were injected s.c. with 106 B16-OVAcells. (d,e) The frequency of tumor infiltrating MDSC (Ly6c+CD11b+) cells was assessed 12 days post tumor inoculation. (f,g) The percentages of Treg in spleen, draining lymph node (DLN) and tumor are shown. (h) Degranulation of tumor NK cells in response to in vitro re-stimulation with PMA/ionomycin. (i) data points for Fig. 1d. Data are representative of two independent experiments (a, c). n, numbers of mice. Data are mean ± s.e.m. and were analyzed by two-tailed unpaired Student’s t-test for (a, c, e, g-i) and two- tailed log-rank (Mantel-Cox) test (b).
Extended Data Fig. 3 |
Extended Data Fig. 3 |. Cross priming of tumor neoantigen is increased in Ythdf1-deficient mice.
a, Rag2−/− mice were transferred with T cells isolated from WTor Ythdf1−/− miceon day 0. On the same day, mice were injected s.c. with 5×10⁵ B16-OVA cells. Tumor growth was monitored over time. b, WT or Ythdf1−/− mice were injected s.c. with 106 MC38-OTIp cells. 6 days after tumor inoculation, CD8+ or CD11b+ DCs were sorted from draining LNs. DCs were co-cultured with CD8T+ cells isolated from naive OTI mice. Capacity of cross priming was determined by the production of IFN-γ. c, WT or Ythdf1−/− mice were injected s.c. with 106 MC38-SIY cells. 6 days after tumor inoculation, DCs were sorted from draining LNs and co-cultured with CD8+ T cells isolated from naive 2C mice. Capacity of cross priming was determined by the production of IFN-γ. d, WT or Mett14-deficient GMDCs were co-cultured with B16-OVA cells. The cross-priming capacity was shown. e, WT or Ythdf1−/− mice were injected s.c. with 106 B16-OVAcells. Data is shown as the expression of CD80 and CD86 on tumor infiltrating DCs. f, WT or Ythdf1−/− mice were injected s.c. with 106 B16-OVA cells. 6 days after tumor inoculation, CD8+ or CD11b+ DCs were sorted from draining LNs. DCs were pulsed with 1 μg/ml exogenous OT-I peptide and co-cultured with isolated CD8+ T cells from naive OTI mice for 3 days and analyzed by IFN-γ CBA. Data are representative of two independent experiments with similar results(e). n, numbers of mice. Data are mean ± s.e.m. and were analyzed by two-tailed unpaired Student’s t-test (a-c, f) or one-tailed unpaired Student’s t-test (d).
Extended Data Fig. 4 |
Extended Data Fig. 4 |. The development of DCs and T cells were similar in Ythdf1+/+ and Ythdf1−/− mice.
a-b, Percentages of CD11b+ and CD8α+ DCs in lymph node (LN) and spleen are shown. c-d, Percentages of CD4+ and CD8+ T cells in lymph node (LN) and spleen are shown. No significant difference was detected between WT and Ythdf1−/− mice. n, numbers of mice. Data are mean ± s.e.m. and were analyzed by two-tailed unpaired Student’s t-test.
Extended Data Fig. 5 |
Extended Data Fig. 5 |. In vitro functional analysis of GMCSF-induced DCs (GMDCs) generated from Ythdf1−/− mice.
a, The production of IL-6, CCL2 and TNFα upon stimulation of Ythdf1−/− GMDCs with LPS. b-c, WT or Ythdf1−/− mice were injected s.c. with 106 B16-OTI-zsGreencells. Percentage of tumor infiltrating zsGreen+ DC, six days after tumor inoculation, is shown. Data are representative of two independent experiments (b). d, Splenic DCs from WT and Ythdf1−/− mice were stimulated with LPS overnight. Cross-presentation capacity of DCs in response to soluble OVA was assessed. n = 3 independent experiments for (a); n = 6 independent experiments for (d). n, numbers of mice. Data are mean ± s.e.m. and were analyzed by two-tailed unpaired Student’s t-test.
Extended Data Fig. 6 |
Extended Data Fig. 6 |. Transcriptome-wide analysis of the YTHDF1 binding sites in Flt3L-DCs.
a, High reproducibility of YTHDF1 RIP-seq data. For each potential YTHDF1 binding peak, the fold-enrichment of RIP/Input signal was determined for both Replicate 1 and Replicate 2. The peaks identified in both replicates were considered as high-confidence peak and indicated in red. b, Overlap of YTHDF1-binding transcripts revealed from RIP-seq of two biological replicates. c, Meta-gene analysis to show the distribution of YTHDF1-binding sites along a normalized transcript. d, Distribution of YTHDF1-binding sites in transcripts. (e) Heatmap showing the translational efficiency of co-simulatory/inhibitory (signal 2) and cytokines (signal 3) in WT and Ythdf1−/− Flt3L-DCs.
Extended Data Fig. 7 |
Extended Data Fig. 7 |. YTHDF1-deficient GMDCs exhibit lower translational rates.
a, High reproducibility of YTHDF1 RIP-seq data in GMDCs. For each potential YTHDF1 binding peak, the fold-enrichment of RIP/Input signal was determined for both Replicate 1 and Replicate 2. The peaks identified in both replicates were considered as high-confidence peak and indicated in red. b, Volcano plots of genes with differential translational efficiency in WT and Ythdf1−/− GMDCs. YTHDF1 targets were marked with yellow circles. P values were calculated by two-sided likelihood ratio test and adjusted by Benjamini & Hochberg method; n = 4 (2 conditions x 2 biological replicates) c, Cumulative distribution log2FoldChange of translational efficiency between WT and Ythdf1−/− GMDCs. P values were calculated by two-sided Kolmogorov-Smirnov test; n = 2 independent biological replicates. Box-plot elements: centre line, median; box limits, upper and lower quartiles; whiskers, 1–99%. d, Pie charts presenting the distribution of YTHDF1-binding sites in transcripts. e, Metagene-plot depicting nearly unchanged m6A peaks distribution and similar consensus motifs in WT and Ythdf1−/− GMDCs. P values of consensus motifs were generated by HOMER with one-sided binomial test. f, KEGG and GO enrichment analysis of YTHDF1 target genes revealed enrichment of biological functions related to innate immune system, lysosome and phagosome (n = 79). One-tail hypergeometric test was used to determine statistical significance of enrichment. g, Heatmap showing translational efficiency of cathepsin genes in GMDCs and Flt3L-DCs. n, numbers of genes or m6A peaks.
Extended Data Fig. 8 |
Extended Data Fig. 8 |. Antigen degradation is reduced in Ythdf1−/− mice and inhibition of protease cathepsins enhanced the cross-priming of WT DCs.
a, GMDCs were co-cultured with necrotic B16-OVA cells overnight. Immunoblot analysis of proteases Cathespins B/D/L (CTSB, CTSD and CTSL) in GMDCs. b, WT and Ythdf1−/− DCs were treated with Actinomycin D, RNAs collected at different time points after treatment, and mRNA levels were measured using RT-qPCR and represented as mRNA remaining after transcription inhibition (TI). ns not significant. c, GMDCs were co-cultured with necrotic B16-OVA cells overnight and OVA degradation in BMDCs was measure by Immunoblot. d, Ex vivo purified wild-type cDCs were pre-treated with 0.04 μM cathepsin inhibitor E64 and pulsed with OVA protein for 4 h. The cross-priming capacity of DCs was compared by co-culturing DCs with cell trace violet (CTV) labeled OTI-T cells. The proliferation was measured by the dilution of CTV. e, GMDCs were pre-treated with 0.2–2 μM cathepsin inhibitor E64 and co-cultured with B16-OVA cells. The cross-priming capacity of DC was compared by co-culturing DCs with isolated CD8+ T cells from naive OTI mice and analyzed by IFN-γ cytometric bead array. f, Flt3L-DCs were pre-treated with cathepsin inhibitor CA-074 or/and cathepsin L inhibitor III (CASIII), followed by co-culturing with necrotic B16-OVA cells. Synergistic inhibition effects were observed. The cross-priming capacity of DC was determined. g, data points for Fig. 4b. n = 3 independent experiments with similar results (a, c); n = 2 independent experiments (b). n, numbers of sample size. Data are mean ± s.e.m. and were analyzed by two-tailed unpaired Student’s t-test (e) or one-tailed unpaired Student’s t-test (f).
Extended Data Fig. 9 |
Extended Data Fig. 9 |. IFNγ within tumor tissues is responsible for the upregulation of PD-L1 in Ythdf1−/− mice.
Tumor-bearing mice were treated with 50 μg anti-IFNγ m6Ab intratumorally (i.t.) and PD-L1 expression on tumor cells is shown. n, numbers of mice. Data are mean ± s.e.m. and were analyzed by two-tailed unpaired Student’s t-test.
Figure 1 |
Figure 1 |. Ythdf1−/− mice shows effective tumor control dependent on CD8+ T cells.
a, WT or Ythdf1−/− mice were injected s.c. with 106 B16-OVA cells. Tumor growth were monitored. One of three representative experiments is shown. b, WT or Ythdf1−/− mice were injected s.c. with 106 MC38 cells. Tumor growth was monitored. One of three representative experiments is shown. c, Percentage of tumor-infiltrating T cells and NK cells at day 12 post tumor inoculation. d, WT or Ythdf1−/− mice were injected s.c. with 106 B16-OVA cells. 200 μg of CD8- or NK-depleting antibody were administered twice a week starting on day 0. Tumor size was monitored overtime. n, numbers of mice. Data are mean ± s.e.m. and were analyzed by two-tailed unpaired Student’s t-test.
Figure 2 |
Figure 2 |. Cross-priming capacity of DC is enhanced in Ythdf1−/− mice.
a-c, WT or Ythdf1−/− mice were injected s.c. with 106 B16-OVA cells. The frequency of tumor-infiltrating OVA-Specific CD8+ T cells was assessed 12 days post tumor inoculation (a-b). Six days post tumor inoculation, lymphocytes from DLN were isolated and stimulated with 10 μg/ml OTI peptide. IFN-γ–producing cells were enumerated by ELISPOT assay (c). d, WT or Ythdf1−/− mice were injected s.c. with 106 MC38 cells. Six days post tumor inoculation, lymphocytes from DLN were isolated and stimulated with irradiated MC38 cells for 48 hours. e, Flt3L-DCs were co-cultured with necrotic B16-OVA overnight, and B220 CD11c+ cells were purified and co-cultured with OT-I T cells. IFN-γ production was assessed by IFN-γ cytometric bead array. Data are representative of six biological replicates. f, 6 days after tumor inoculation, CD8+ or CD11b+ DCs were sorted from draining LNs. DCs were co-cultured with isolated OT-I cells for 3 days and analyzed by IFN-γ CBA. g-h, Formation of H-2Kb-SIINFEKL on tumor-infiltrating DCs from B16-OVA tumor-bearing WT and Ythdf1−/− mice (g). Mean fluoresce intensity (MFI) is shown (h). i, WT mice were transferred with WT or Ythdf1−/− bone marrow cells (BMCs) mixed with Zbtb46-DTR BMCs in 1:1 ratio. Six weeks after bone marrow chimera reconstitution, mice were injected s.c. with 1×10⁶ B16-OVA cells. 400 ng DT was administrated on the same day (+ DT). Tumor size was monitored over time. n, numbers of mice. Data are mean ± s.e.m. and were analyzed by two-tailed unpaired Student’s t-test. Data are representative of two independent experiments (a, g).
Figure 3 |
Figure 3 |. Transcriptome-wide identification and analysis of the YTHDF1-binding sites.
a, Volcano plots of genes with differential translational efficiency in WT and Ythdf1−/− Flt3L-DCs. Transcripts with significant YTHDF1 binding sites in 3’ UTR were marked with yellow circles. P values were calculated by two-sided likelihood ratio test and adjusted by Benjamini & Hochberg method; n = 4 (2 conditions x 2 biological replicates). b, Cumulative distribution log2FoldChange of translational efficiency between WT and Ythdf1−/− Flt3L-DCs. P values were calculated by two-sided Kolmogorov-Smirnov test; n = 2 independent biological replicates. Box-plot elements: centre line, median; box limits, upper and lower quartiles; whiskers, 1–99%. c, Metagene-plot depicting nearly unchanged m6A peak distribution and similar consensus motifs in WT and Ythdf1−/− Flt3L-DCs. P values of consensus motifs were generated by HOMER with one-sided binomial test. d, KEGG enrichment analysis of genes with significant decreased translation efficiency and YTHDF1 binding sites in 3’UTR (n = 204). One-tail hypergeometric test was used to determine statistical significance of enrichment. e, Heatmap showing the translational efficiency of lysosome genes in WT and Ythdf1−/− Flt3L-DCs. n, numbers of genes or m6A peaks.
Figure 4 |
Figure 4 |. YTHDF1 promotes translation of proteases for excessive antigen degradation.
a, Representative histogram plots showing expressions of cathepsins on splenic CD8α+ and CD11b+ cDCs from WT and Ythdf1−/− mice. b, WT mice were injected s.c. with 106 B16-OVA cells. After 11 days, tumor-bearing mice were injected with DMSO as vehicle control (CTR) or E64 intratumorally (5 μM or 50 μM). Tumor growth was monitored over time. c, WT or Ythdf1−/− mice were injected s.c. with 106 B16-zsGreen-OT1 cells. The PDL1 expression on zsGreen+ tumor cells is shown. d, WT or Ythdf1−/− mice (n = 5/group) were injected s.c. with 106 B16-OVA cells. 200 μg of anti-PDL1 antibody were administered on day 8 and day 15. Percentage of mice with tumor regression were monitored over time and represented as percent tumor-free survival. (e-f) Tissue sections were characterized by immunohistochemical staining for CD8 and YTHDF1. Dash line delineates the edge of tumor area. Asterisk marks the stroma tissues. Representative YTHDF1 low (Patient 1) and YTHDF1 high (Patient 5) specimens are shown (e). Scale bars, 100 μm. f, Correlations between YTHDF1 in stroma area and CD8+ infiltrates are shown (n = 22 patients). Data are representative of two independent experiments with similar results (a, c); one of three representative images per tumor was shown (e). n, numbers of mice. Data are mean ± s.e.m. and were analyzed by two-tailed unpaired Student’s t-test (b, f) or two-tailed log-rank (Mantel-Cox) test (d).

Comment in

References

    1. Schumacher TN & Schreiber RD Neoantigens in cancer immunotherapy. Science 348, 69–74 (2015). - PubMed
    1. Ott PA et al. An immunogenic personal neoantigen vaccine for patients with melanoma. Nature 547, 217–221 (2017). - PMC - PubMed
    1. Yarchoan M, Johnson BA 3rd, Lutz ER, Laheru DA & Jaffee EM Targeting neoantigens to augment antitumour immunity. Nat. Rev. Cancer 17, 209–222 (2017). - PMC - PubMed
    1. Sahin U et al. Personalized RNA mutanome vaccines mobilize poly-specific therapeutic immunity against cancer. Nature 547, 222–226 (2017). - PubMed
    1. Wang X et al. N6-methyladenosine modulates messenger RNA translation efficiency. Cell 161, 1388–1399 (2015). - PMC - PubMed

Publication types

MeSH terms