. 2019 Feb;566(7742):73-78.
doi: 10.1038/s41586-018-0784-9. Epub 2019 Feb 6.

L1 drives IFN in senescent cells and promotes age-associated inflammation

Affiliations

L1 drives IFN in senescent cells and promotes age-associated inflammation

Marco De Cecco et al. Nature. 2019 Feb.

Erratum in

Abstract

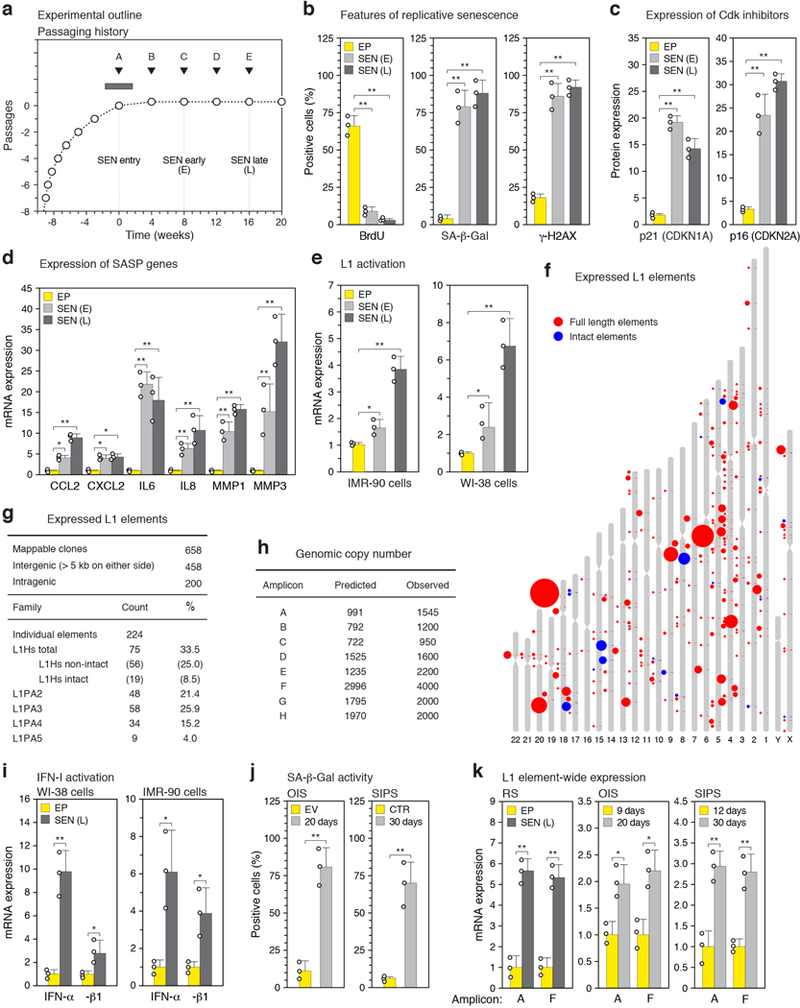
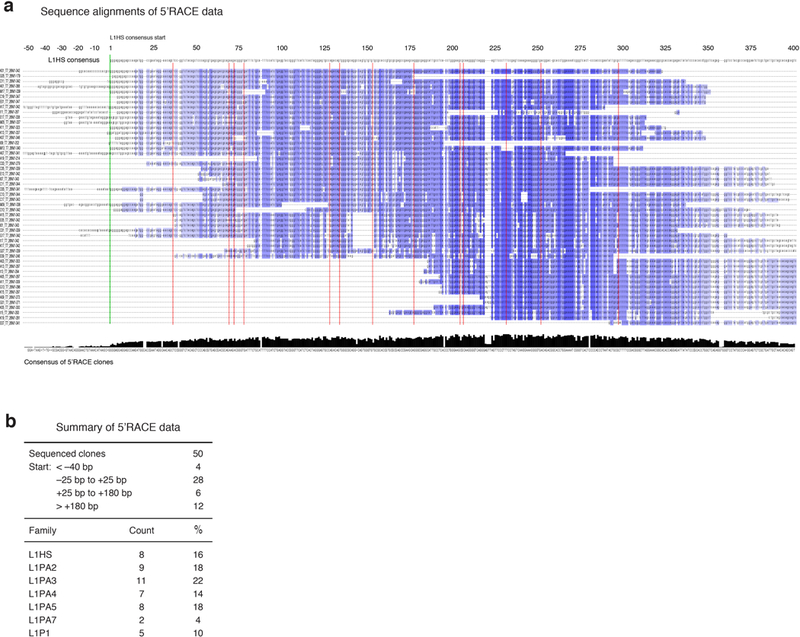
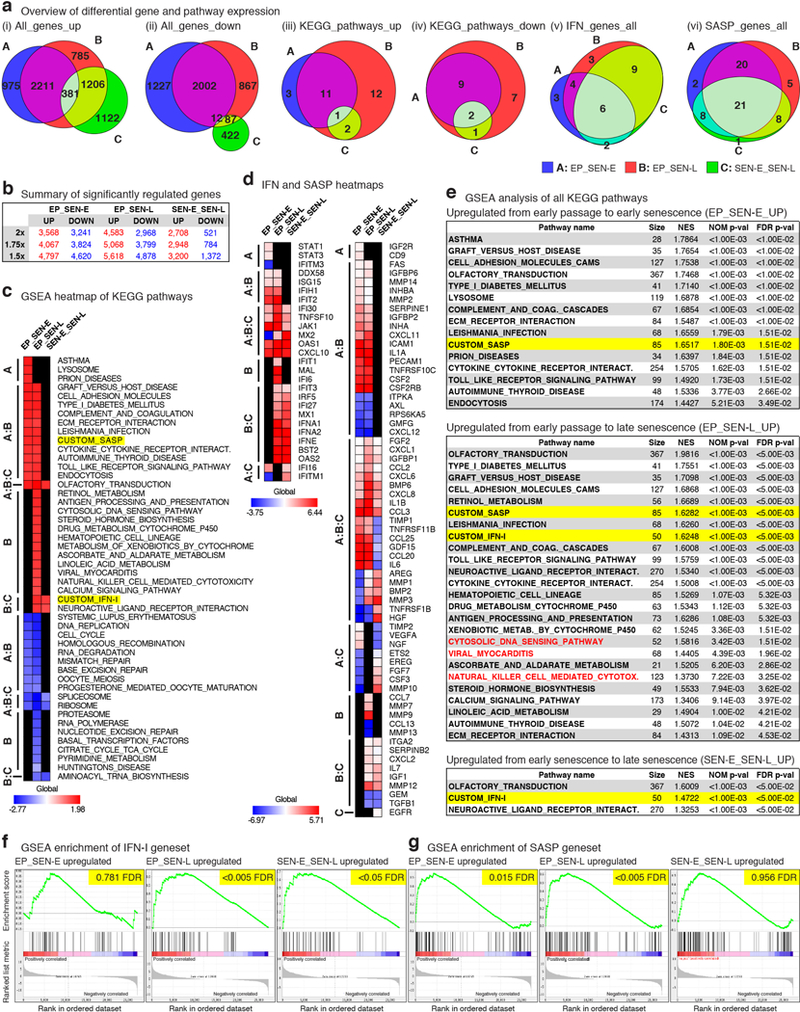
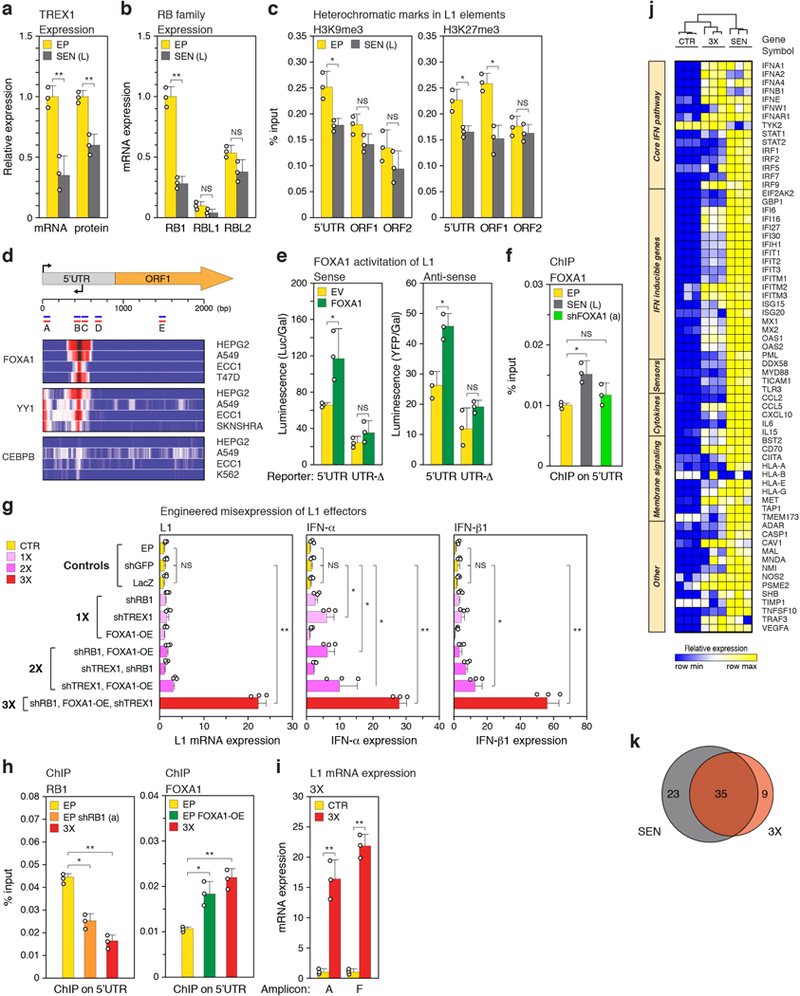
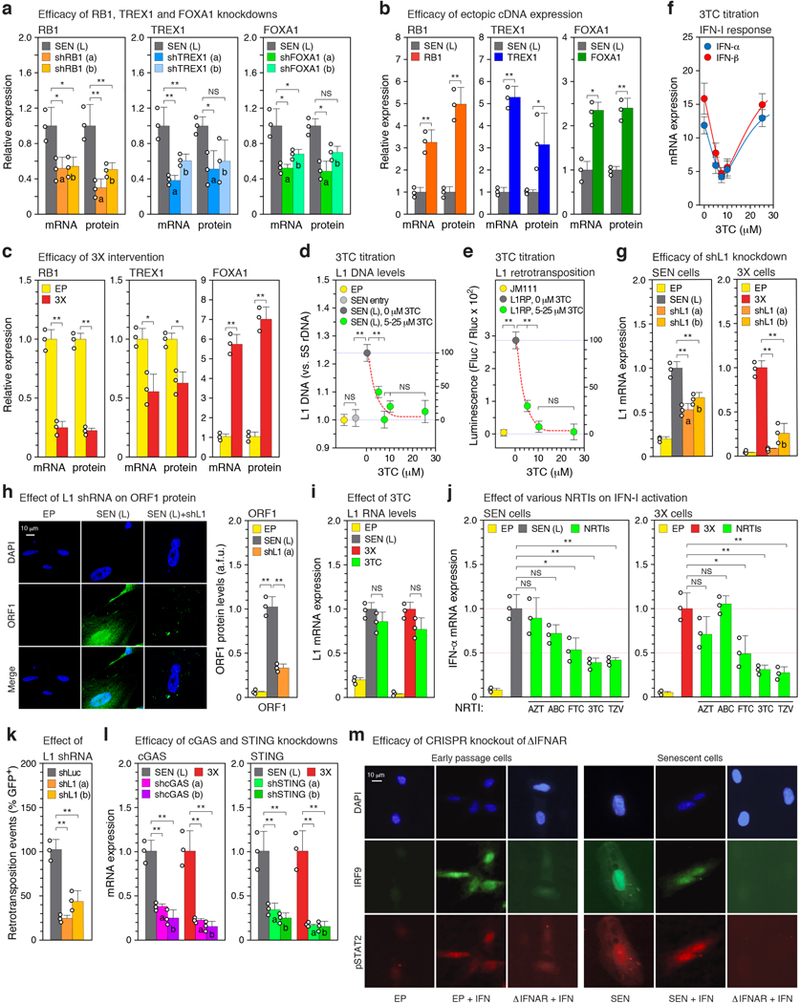
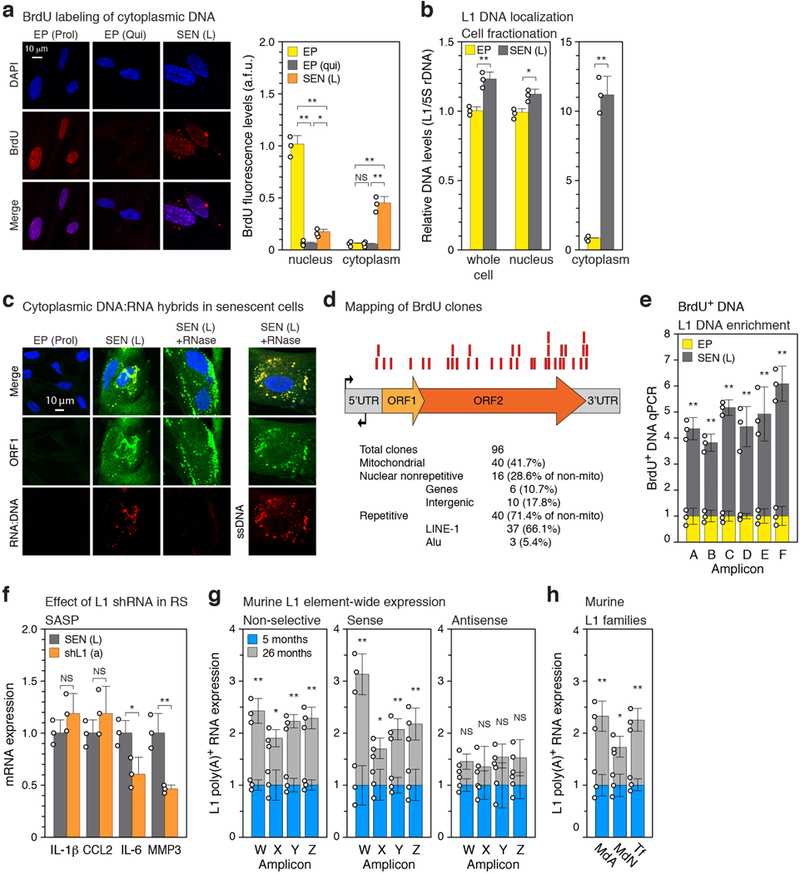
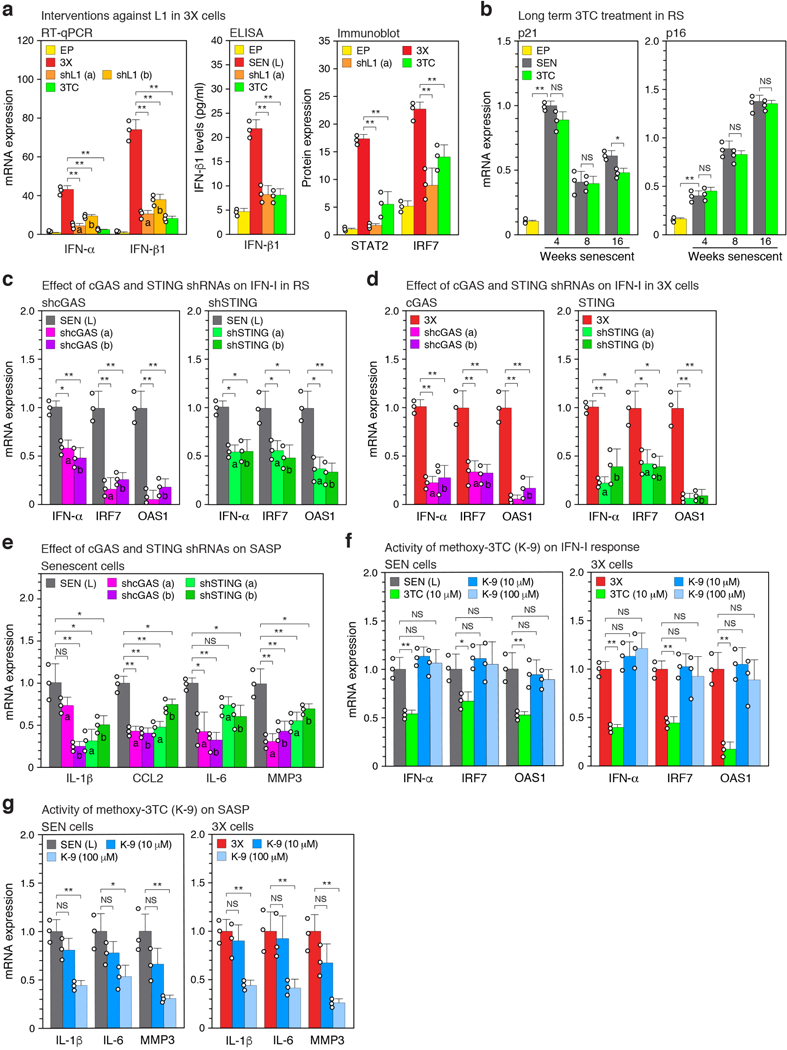
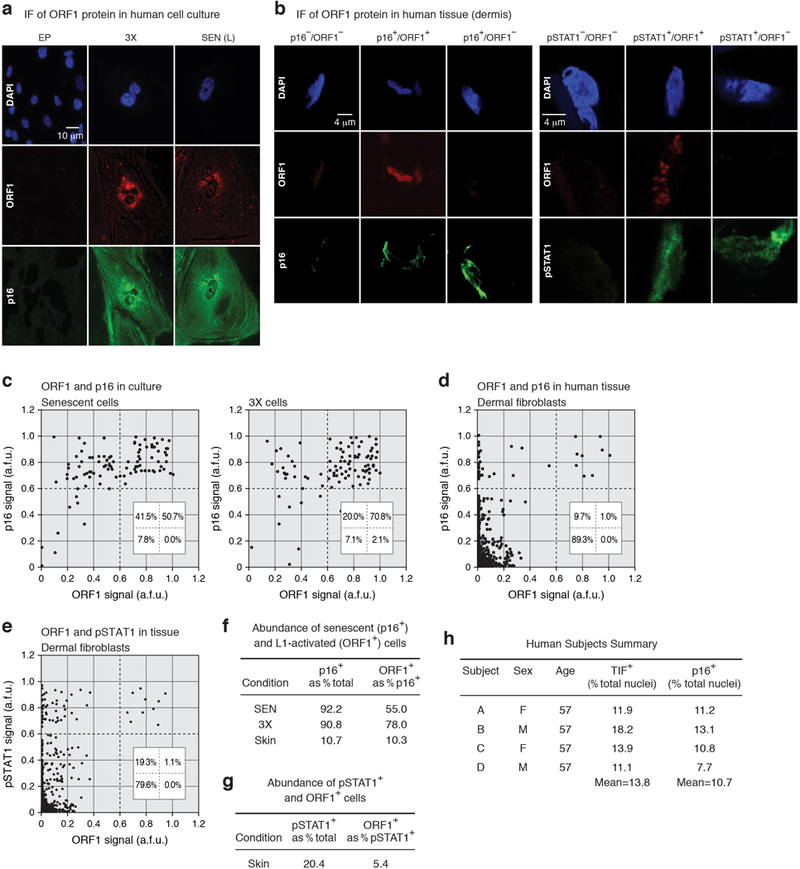
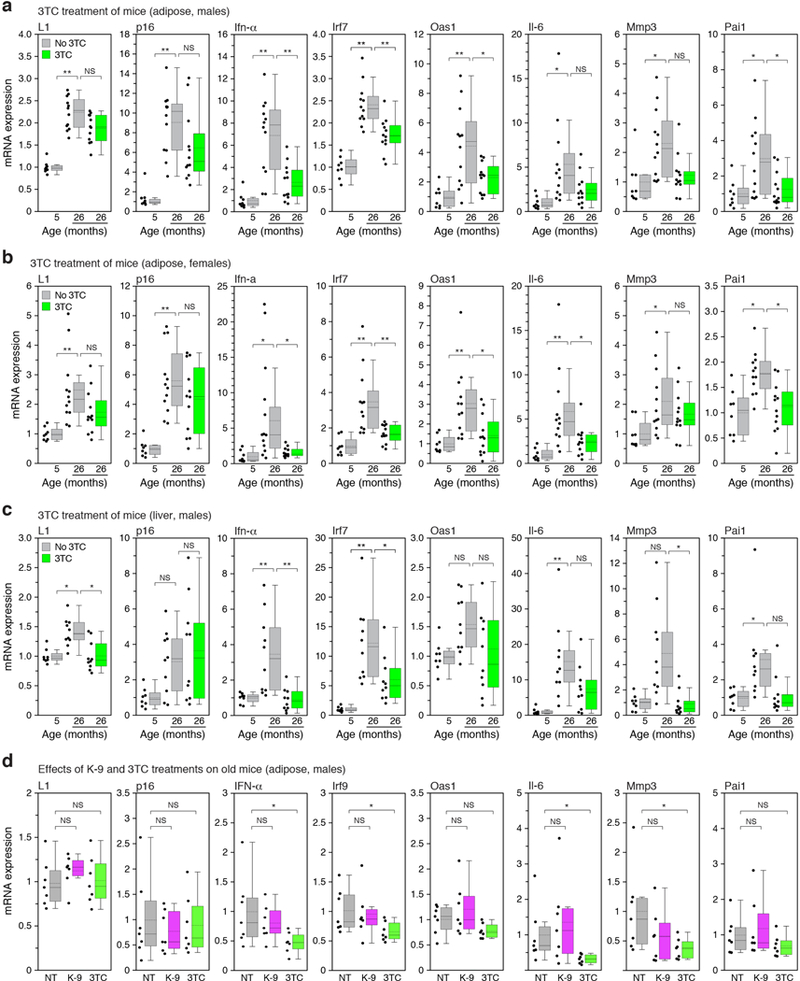
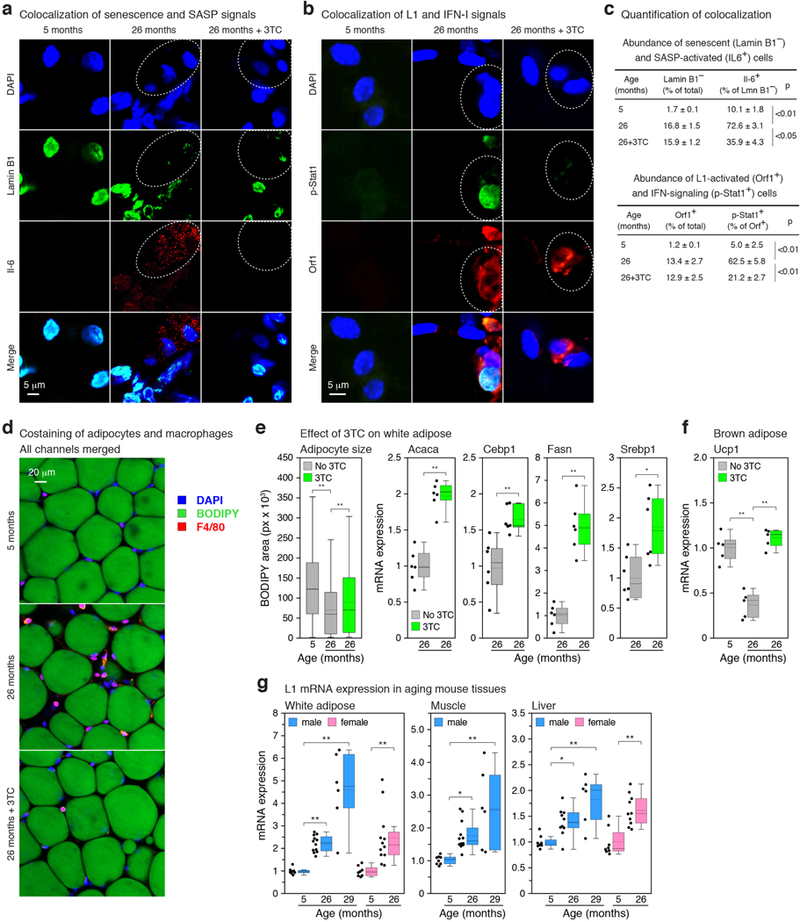
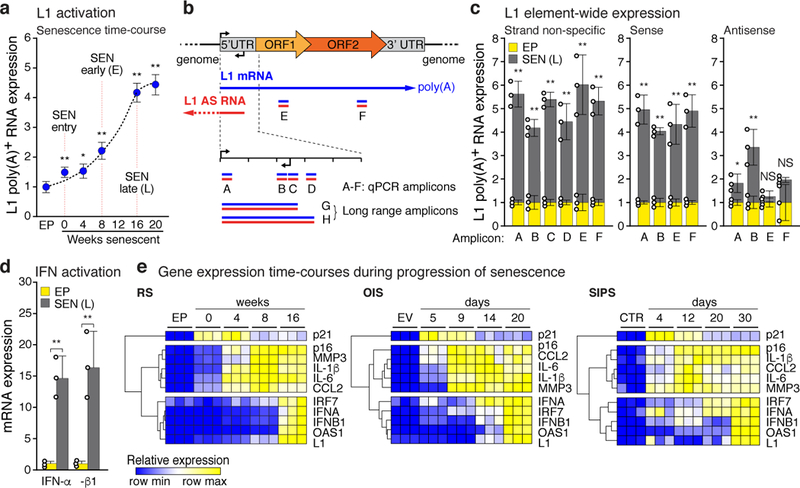
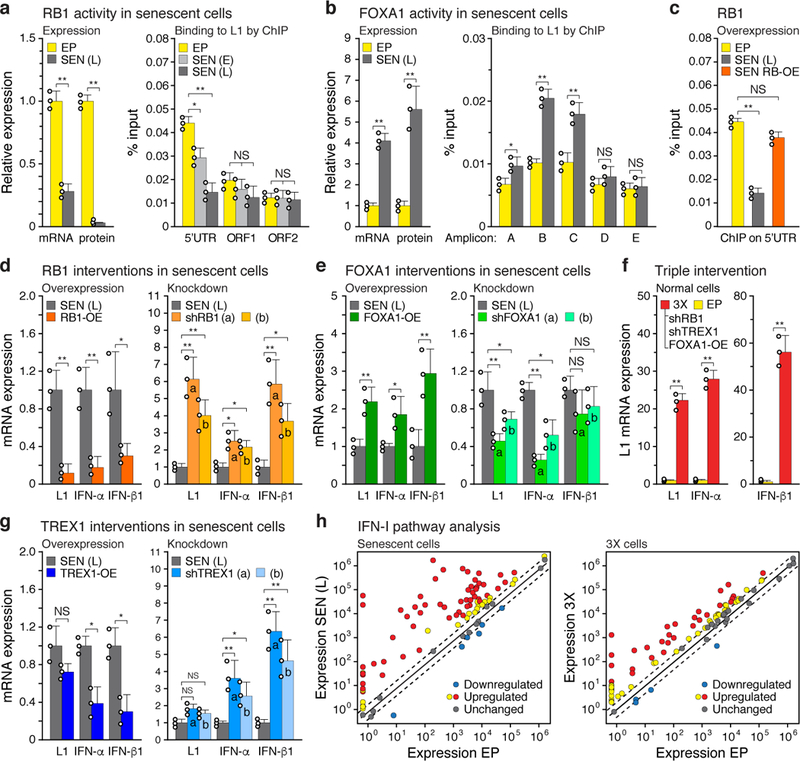
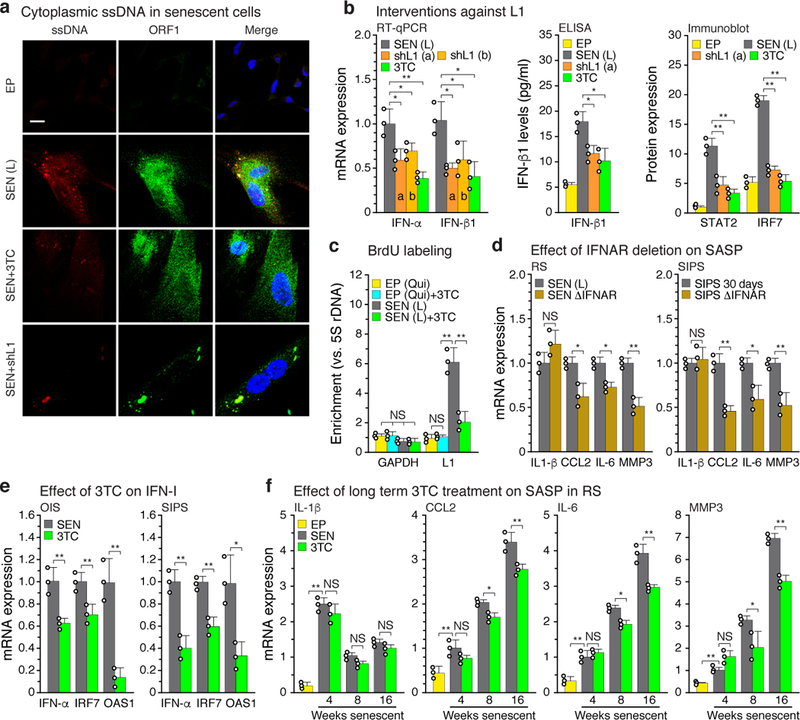
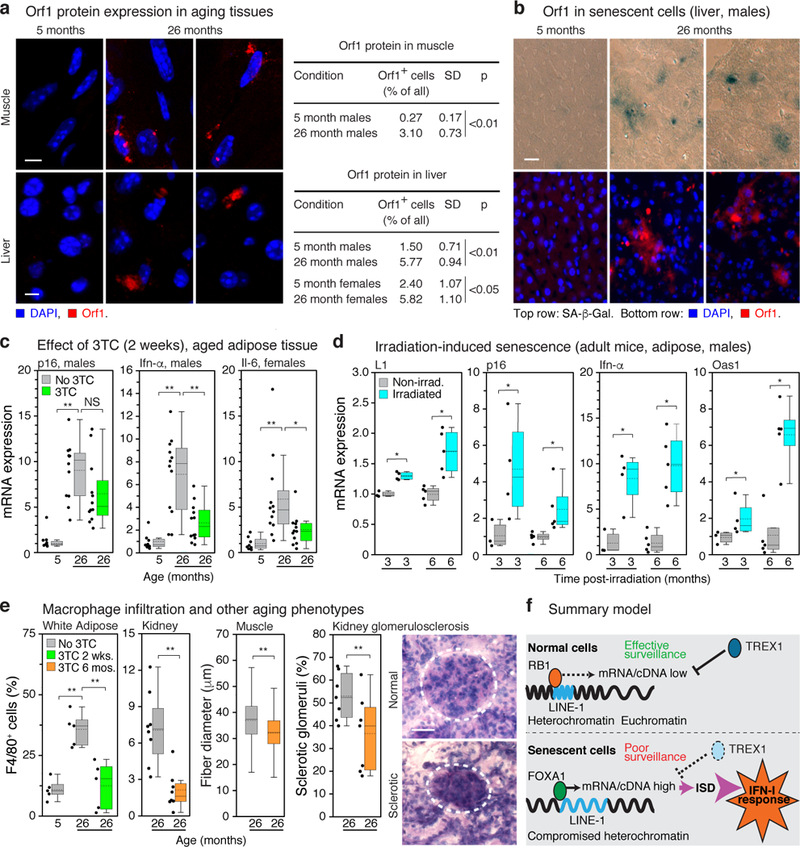
Retrotransposable elements are deleterious at many levels, and the failure of host surveillance systems for these elements can thus have negative consequences. However, the contribution of retrotransposon activity to ageing and age-associated diseases is not known. Here we show that during cellular senescence, L1 (also known as LINE-1) retrotransposable elements become transcriptionally derepressed and activate a type-I interferon (IFN-I) response. The IFN-I response is a phenotype of late senescence and contributes to the maintenance of the senescence-associated secretory phenotype. The IFN-I response is triggered by cytoplasmic L1 cDNA, and is antagonized by inhibitors of the L1 reverse transcriptase. Treatment of aged mice with the nucleoside reverse transcriptase inhibitor lamivudine downregulated IFN-I activation and age-associated inflammation (inflammaging) in several tissues. We propose that the activation of retrotransposons is an important component of sterile inflammation that is a hallmark of ageing, and that L1 reverse transcriptase is a relevant target for the treatment of age-associated disorders.


Figures

Extended Data Figure 1. |
Extended Data Figure 1. |. Establishment of senescent cultures and analysis of L1 and IFN-I activation.
a, Passaging regimen to obtain long-term replicatively senescent cells (details in Methods). Point A was designated as zero for time in senescence. b-d, Confirmation of the senescent status of cultures. A representative experiment is shown; other experiments were monitored in the same manner and generated data that met these benchmarks. EP, early passage control; SEN (E), early senescence (8 weeks); SEN (L), late senescence (16 weeks). b, Cells were labeled with BrdU for 6 hours. BrdU incorporation and senescence-associated β-galactosidase (SA-β-Gal) activity were determined as indicated. DNA damage foci were visualized using γ-H2AX antibodies and immunofluorescence microscopy (IF). c, Expression of p21 (CDKN1A) and p16 (CDKN2A) proteins was determined by immunoblotting. GAPDH was the loading control. For gel source data see Supplementary Fig. 1. d, Expression of genes characteristic of the SASP was determined by RT-qPCR. e, L1 activation during senescence of IMR-90 and WI-38 strains of fibroblasts was assessed by RT-qPCR using poly(A) purified RNA and primers for amplicon F (Fig. 1b). f, Long-range RT-PCR was performed with primers A-forward and C-reverse (amplicon G) and primers A-forward and D-reverse (amplicon H) (Fig. 1b, Supplementary Table 1) and the cDNAs were cloned and sequenced. Several attempts using the same protocol on early passage proliferating cells did not yield any L1 clones. Sequences were mapped to the unmasked reference genome demanding 100% identify. 658 clones could be thus mapped, 51 additional clones contained at least 1 mismatch and thus likely represent elements that are polymorphic in the cell line, and 58 were cloning artifacts. Among the 658 mappable clones 224 unique elements were represented (Supplementary Table 3). Intact elements are the subset of full length elements annotated with no ORF inactivating mutations. Size of the features corresponds to the number of times the element was represented among the 658 clones. g, Summary of long-range PCR data presented in (f) and Supplementary Table 3. h, Apparent genomic copy numbers of elements detected with our amplicons (see Fig. 1b for locations of amplicons and Methods for primer design strategy). Predicted: in silico PCR (Methods). Observed: qPCR was performed on 1 ng of genomic DNA and normalized to a known single copy locus. i, Activation of IFN-α and IFN-β1 genes during senescence of WI-38 and IMR-90 cells was determined by RT-qPCR. j, Confirmation of the senescent status of cells in OIS (20 days, Fig. 1e) and SIPS (30 days, Fig. 1e) by SA-β-Gal activity. EV, empty vector control; CTR, non-irradiated cells. k, Confirmation of full length L1 mRNA expression in all forms of senescence using RT-qPCR with primers for amplicons A and F on poly(A)-purified RNA. Late onset activation is shown by comparing days 9 and 20 for OIS and days 12 and 30 for SIPS. (b-e, i-k), n = 3 independent biological samples, repeated in 2 independent experiments. Data are mean ±s.d. *P ≤ 0.05, **P ≤ 0.01, unpaired two-sided t-tests. Exact P values can be found in the accompanying Source Data.
Extended Data Figure 2. |
Extended Data Figure 2. |. Mapping transcriptional start sites in L1 elements activated during cellular senescence.
5’RACE was performed with primers C and D (Fig. 1a, Supplementary Table 1) on late senescent cells (16 weeks, point D in Extended Data Fig. 1a), the products were cloned, and individual clones were Sanger sequenced (Methods). a, A multiple sequence alignment of the 50 mappable clones against the L1HS consensus was generated with MAFFT software. The L1HS consensus is shown on top. Blue color shading of the aligned clones shows their degree of identity with the consensus. The green vertical line marks the start (position 1) of the L1HS consensus. Red vertical lines mark short gaps (1–4 nucleotides) opened in the L1HS consensus by individual clones. The consensus of the 50 clones is shown at the bottom and was generated with Jalview. The initiation of L1 transcription is known to be imprecise, with the majority of start sites occurring +/−50 bp of the consensus start site, and a subset as far down as +180 bp. b, Summary of the mapping data and classification of clones to families of L1 elements. The relative start sites were calculated relative to the L1HS consensus start site. RepEnrich software was used to assign the clones to L1 families.
Extended Data Figure 3. |
Extended Data Figure 3. |. Evolution of transcriptomic changes during progression of cellular senescence.
RNA-seq was performed on early proliferating LF1 cells (EP) and cultures at 8 weeks (SEN-E) and 16 weeks (SEN-L) in senescence (points C and D, respectively, in Extended Data Fig. 1a). Data were analyzed using a 3-way comparison: EP versus SEN-E, EP versus SEN-L and SEN-E versus SEN-L (see Methods for details). a, Area-proportional generalized Venn diagrams depicting the intersections of the three comparisons for the following datasets. i-ii, significantly upregulated and downregulated genes (row 2x in panel b). iii-iv, significant KEGG pathways identified by GSEA. Note the considerable evolution the transcriptome in late senescence, exemplified by large changes (especially upregulated) in differentially expressed genes as well as pathways. v-vi, significantly changing genes in the IFN-I and SASP gene sets (see Supplementary Table 4 for annotation of gene sets). Note that the majority of changes in SASP genes occur early, whereas a large component of IFN-I changes is specific for late senescence. b, Summary of significantly changing genes using a fixed FDR (<0.05) and variable fold-change cutoffs (2x, 1.75x and 1.5x). c, GSEA analysis of KEGG pathways. Heatmap representation shows significantly upregulated pathways in red (also see panel e) and downregulated pathways in blue. Non-significant comparisons are shown in black; vertical annotations refer to Venn diagrams in (a, iii-iv). Note that the SASP gene set is upregulated early whereas the IFN-I gene set is upregulated late. d, Heatmaps of significantly changing genes in the IFN-I and SASP gene sets. Vertical annotations refer to Venn diagrams in (a, v-vi). e, List of significantly upregulated KEGG pathways identified using GSEA (see Supplementary Table 5 for a list of all pathways). NES, normalized enrichment scores. IFN-I and SASP genesets are highlighted in yellow. Note the significant upregulation of IFN-I between early and late senescence. Red type identifies KEGG pathways indicative of cytosolic DNA sensing and a type I interferon response at late times. f-g, GSEA profiles of the IFN-I and SASP genesets for all comparisons; FDR is highlighted in yellow. Note that the upregulation of IFN-I is significant for EP_SEN-L and SEN-E_SEN-L but not for EP_SEN-E, and that the upregulation of SASP is significant for EP_SEN-E and EP_SEN-L but not SEN-E_SEN-L. n = 3 independent biological samples. Differential expression data were analyzed for significance using the GSEA GenePattern interface and the outputs were corrected for multiple comparisons by adjusting the nominal p values using the Benjamini-Hochberg method (see Methods for details).
Extended Data Figure 4. |
Extended Data Figure 4. |. Characterization of L1 effectors and the IFN-I response.
a, Expression of TREX1 was determined by RT-qPCR and immunoblotting. For gel source data see Supplementary Fig. 1. b, Expression of RB family genes was compared by RT-qPCR. Primer pairs for all genes were verified to be of equivalent efficiency. c, Enrichment of H3K9me3 and H3K27me3 on L1 elements was examined by ChIP-qPCR (PCR primers illustrated in Fig. 1b were used: 5’UTR, amplicon A; ORF1, amplicon E; ORF2, amplicon F). d, ChIP-seq data from ENCODE were investigated for transcription factors that bind to the L1 consensus sequence. The log2 fold change enrichment relative to input controls is shown for the indicated cell-lines. The binding of YY1 to the L1 promoter has been documented and was used as a positive control. CEBPB was used as a negative control. A schematic illustrating L1 coordinates and relevant features is shown above. Amplicons A-E are the same as shown in Fig. 1b. e, Transcriptional activity of the intact L1 5’UTR or a UTR lacking the FOXA1 binding site (UTR-Δ) was determined using sense and antisense reporters cotransfected into early passage LF1 cells either with a FOXA1 expression plasmid or empty vector (EV). f, FOXA1 was knocked down in senescent cells with shFOXA1 (a) (see also Fig. 2e and Extended Data Fig. 5a) and binding to the L1 5’UTR (amplicon B) was determined by ChIP-qPCR. g, Knockdown of RB1, TREX1 and ectopic expression of FOXA1 were performed in early passage cells in all single (1X), double (2X) and triple (3X) combinations and assessed by RT-qPCR using poly(A)-purified RNA for activation of L1, IFN-α and IFN-β1 expression (primers for amplicon F). Three controls are shown: cells infected with irrelevant shRNA (shGFP), expression construct (LacZ), or uninfected early passage cells (EP). h, L1 5’UTR occupancy of RB1 and FOXA1 in 3X cells was determined by ChIP-qPCR performed as in Fig. 2a, b. Primers for amplicons A and B were used for RB1 and FOXA1, respectively. For comparison, single interventions in early passage cells with shRB1 (a) or FOXA1 cDNA expression (EP FOXA1-OE) are also shown. i, Confirmation of full length L1 mRNA expression in 3X cells using RT-qPCR with primers for amplicons A and F on poly(A)-purified RNA. CTR, cells infected with irrelevant shRNA (shGFP). j, Heat map representation showing all biological replicates for the 67 genes significantly changing expression in SEN and/or 3X cells (Fig. 2h, Supplementary Table 6). Column clustering was calculated as 1-Pearson correlation. Rows have been grouped into functional subsets of the IFN-I response. k, Venn diagram showing the overlap between the 67 significantly changing genes. (a-f, h) n = 3 independent biological samples, repeated in 2 independent experiments. (g, i), n = 3 independent experiments. (a-i) Data are mean ±s.d. *P ≤ 0.05, **P ≤ 0.01, unpaired two-sided t-tests. Exact P values can be found in the accompanying Source Data.
Extended Data Figure 5. |
Extended Data Figure 5. |. Efficacy of genetic and pharmacological interventions.
a, Knockdowns with two distinct shRNAs (a, b) or b, ectopic cDNA expression were performed in senescent cells as described in Fig. 2d, e, g (also see Methods). The effectiveness of these manipulations on their targets was assessed by RT-qPCR and immunoblotting. For gel source data see Supplementary Fig. 1. c, RB1, TREX1 and FOXA1 mRNA and protein expression after the triple (3X) intervention (Fig. 2f). d, The effect of 3TC treatment on the relative abundance of L1HS sequences in senescent cells was determined by multiplex TaqMan qPCR on total DNA (primer set 6, Supplementary Table 1). SEN entry, 0 weeks in senescence (Fig. 1a; point A in Extended Data Fig. 1a). 3TC was administered continuously from SEN entry until harvest 16 weeks later. e, The dual luciferase L1 reporter system was used to determine the effect of 3TC dosing on retrotransposition. L1 reporters were introduced into early passage cells using lentivirus vectors (Methods) and cells were treated with 3TC for 4 days prior to harvest and assay. JM111, a defective reporter carrying mutations in ORF1 (absence of 3TC); L1RP, a retrotransposition competent reporter. f, The effect of 3TC dosing on the IFN-I response. The experiment above (d) was processed by RT-qPCR to determine the expression of IFN-α and IFN-β1. g, Knockdowns of L1 were performed with two distinct shRNAs (a, b) in senescent cells (as in Fig. 2d, e, g) or 3X cells (as in Fig. 2g). The effectiveness on L1 expression was assessed by RT-qPCR using poly(A)-purified RNA and primers F. h, Cells in the experiment in (g) were examined for levels of ORF1 protein by immunofluorescence (IF). Image analysis was performed with CellProfiler software (Methods). >200 cells were examined for each condition (a.f.u., arbitrary fluorescence units). i, The L1 shRNA treatment in the experiment in (g) was substituted with 3TC treatment (10 μM) for the same period of time. j, Five different NRTIs (or combinations) were tested for effects on the IFN-I response. AZT (Zidovudine, 15 μM), ABC (Abacavir, 15 μM), FTC (Emtricitabine, 10 μM), 3TC, (Lamivudine, 10 μM), TZV (Trizivir, a combination of 15 μM AZT, 15 μM ABC and 7.5 μM 3TC). Cells were treated for 4 weeks between 12 and 16 weeks in senescence (Fig. 1a; points D and E in Extended Data Fig. 1a). 3X cells (Fig. 2f) were treated with 3TC for 48 hours after the completion of the last drug selection. Interferon α expression was determined by RT-qPCR. k, A native L1 reporter (pLD143) was co-transfected with shRNA plasmid vectors into HeLa cells (Methods). Retrotransposition was scored as GFP-positive cells, and shL1 knockdowns were normalized to a shLuc negative control. The absolute average retrotransposition frequency (percentage of GFP-positive cells) was 4.1, which matches the published values for the reporter used (pLD143). l, Knockdowns of cGAS and STING were performed in senescent or 3X cells as with the other shRNAs (Fig. 2d, e, g and a, g above). m, Downregulation of interferon signaling after CRISPR-mediated inactivation of IFNAR1 and IFNAR2 genes was verified by the absence of IRF9 nuclear translocation and STAT2 phosphorylation in response to interferon stimulation. Cells were infected with lentivirus vectors expressing Cas9 and gRNAs to both IFNAR1 and IFNAR2 (ΔIFNAR, Methods). After the infection cells were re-seeded on coverslips, treated with interferon for 2 hours, and examined by IF microscopy. The experiment was repeated 3 times with similar results. (a-i, l) n = 3 independent experiments. (k) n = 3 independent biological samples, repeated in 2 independent experiments. (a-l) Data are mean ±s.d. *P ≤ 0.05, **P ≤ 0.01, unpaired two-sided t-tests. Exact P values can be found in the accompanying Source Data.
Extended Data Figure 6. |
Extended Data Figure 6. |. Characterization of cytoplasmic DNA in senescent cells.
a, Quiescent and senescent cells were treated with BrdU as in Fig. 3a and the cellular localization of BrdU incorporation was visualized by IF microscopy. Proliferating cells, EP(Prol), are shown as a positive control for nuclear BrdU incorporation. The signals were quantified using CellProfiler software (right panel, Methods). >200 cells were examined for each condition (a.f.u., arbitrary fluorescence units). b, Senescent (and EP control) cells (neither labeled with BrdU) were fractionated into nuclear and cytoplasmic fractions, and the representation of L1 sequences in these compartments (as well as whole cells) was assessed with qPCR as in Fig. 3a (TaqMan multiplex qPCR assay, amplicon F, Fig. 1b). Note that the Y axis units differ by 10-fold between the left and right panels. c, Cells were examined by IF microscopy for the presence of ORF1 protein, RNA-DNA hybrids, and single-stranded DNA (ssDNA). See Methods and Supplementary Table 2 for antibodies. The RNA-DNA signal in senescent cells largely colocalized with the ORF1 signal and was lost after RNase A treatment. The ssDNA signal also colocalized with the ORF1 signal and was exposed by RNase treatment. The experiment was repeated 3 times with similar results. d, The pulled-down BrdU-containing DNA (Fig. 3c, panel (a) above, Methods) was cloned and Sanger sequenced. Of the 96 total clones examined 37 mapped to L1. Red boxes represent the relative positions of these clones on the L1 consensus sequence. e, Senescent cells labeled with BrdU (Fig. 3c, panel (a) above) were immunoprecipitated with anti-BrdU antibodies, and the representation of L1 sequences in the pulled-down DNA was assessed using qPCR with primers spanning the entirety of L1 elements (Fig. 1b, c). f, Senescent cells were treated with L1 shRNA (using lentiviral vectors as described in Extended Data Fig. 5g) between 12 and 16 weeks of senescence, and expression of SASP genes was determined. g, Transcription throughout murine L1 elements was assessed in a strand-specific manner using the same strategy as was applied to human L1 elements (Fig. 1b, c). The amplicons (designated W-Z to distinguish them from the human-specific primers) correspond to the 5’UTR (W), Orf1 (X), Orf2 (Y) and 3’UTR (Z). Also see Methods and Supplementary Table 1 for primer sequences (primer sets 37, 48–50). Poly(A) RNA was prepared from male white adipose tissue. A total of 12 animals were assessed (3 pools of 4 animals each) in 3 independent experiments. h, Expression of the three currently active families of murine L1 elements. Primers were designed to distinguishing 5’UTR polymorphisms of the MdA, MdN and Tf families (Methods, Supplementary Table 1 primer sets 51–53). RT-qPCR was performed as in (f) above (non strand-specific). (a, b, e) n = 3 independent biological samples, repeated in 2 independent experiments. (f), n = 3 independent experiments. (a, e-h) Data are mean ±s.d. *P ≤ 0.05, **P ≤ 0.01. (a) 1-way ANOVA with Tukey’s multiple comparisons test, (b, e-h) unpaired two-sided t-tests, Exact P values can be found in the accompanying Source Data.
Extended Data Figure 7. |
Extended Data Figure 7. |. Effects of ablating L1 activation, the cytoplasmic DNA sensing pathway, or interferon signaling on expression of the IFN-I and SASP responses.
a, 3X cells were treated with L1 shRNA or with 3TC for 48 hours as described in Extended Data Fig. 5g,i. Effects on the IFN-I response were determined by RT-qPCR, ELISA or immunoblotting. For gel source data see Supplementary Fig. 1. b, Cells were serially passaged into replicative senescence (RS) with 3TC (10 μM) present throughout as in Fig. 3f, and expression of Cdk inhibitors p21 and p16 was assessed by RT-qPCR. c, Senescent cells were treated with shRNAs against cGAS or STING between 12 and 16 weeks of senescence (as described in Extended Data Fig. 5l), and expression of IFN-I response genes (IFN-α, IRF7, OAS1) was determined. d, cGAS and STING knockdowns were performed with shRNAs in 3X cells (as in panel (c) above), and expression of IFN-I genes was examined by RT-qPCR. e, cGAS and STING were knocked down in senescent cells with shRNAs (as in panel (c) above) and expression of SASP response genes (IL-1β, CCL2, IL-6, MMP3) was assayed by RT-qPCR. f, g, The activity of K-9 was compared with 3TC in senescent and 3X cells. Senescent cultures were treated between 12 and 16 weeks (as in Fig. 3b) and 3X cultures for 48 hrs. (as in panel (a) above). Effects on the expression of IFN-I genes (IFN-α, IRF7, OAS1) and SASP genes (IL-1β, IL-6, MMP3) was assessed by RT-qPCR. (a-g), n = 3 independent experiments. (a-g) Data are mean ±s.d. *P ≤ 0.05, **P ≤ 0.01, unpaired two-sided t-tests. Exact P values can be found in the accompanying Source Data.
Extended Data Figure 8. |
Extended Data Figure 8. |. Assessment of p16, L1 ORF1 and pSTAT1 expression in senescent cells and skin specimens from aged humans.
a, Immunofluorescence (IF) detection of p16 and ORF1 in early passage, 3X and senescent cells. b, Representative images of combinatorial ORF1 and p16 or ORF1p and pSTAT1 staining in human dermis. The experiments shown in panels (a, b) was repeated 3 times independently with similar results. c, Cells were plated on cover slips, stained and quantified as described in the Methods. 200 cells in multiple fields were scored for each condition. a.f.u., arbitrary fluorescence units. Insets show the % of cells found in each quadrant. d, e, Abundance of ORF1 and p16 or pSTAT1 cells in human skin. Skin biopsies were cryosectioned and stained as described in the Methods. 200 dermal fibroblast cells in multiple fields were scored for each subject. Aggregated data for 4 subjects (800 cells) are shown. f, Data in (c) and (d) were recalculated to show the relative abundance of p16+ cells among all cells, and ORF1+ cells in the p16+ pool of cells. g, Data in (e) were recalculated as in (f). h, Characteristics of the human subjects used in the analysis of dermal fibroblasts. These specimens were collected as part of the ongoing Leiden Longevity Study. The specimens used here were chosen randomly from left over material. The TIF assay relies on a two-parameter (color) visualization of telomeres (using a FISH probe) and immunofluorescent detection of DNA damage foci (using antibody to 53BP1). Because of limiting material it was not possible to combine detection of p16 with TIFs in a 3 color experiment.
Extended Data Figure 9. |
Extended Data Figure 9. |. Effects of 3TC or K-9 treatment on L1, p16, IFN-I and SASP gene expression in mouse tissues.
a-c, Mice at the indicated ages were treated with 3TC continuously for two weeks (see also Fig. 4c, e, Extended Data Fig. 10d-f, and Methods). For all conditions the expression of L1 mRNA, p16, three representative IFN-I response genes (Ifn-α, Irf7, Oas1) and three representative SASP genes (Il-6, Mmp3, Pai1) were assessed by RT-qPCR. In no instance was expression at 5 months + 3TC significantly different from the no drug control, therefore these data are not shown in the figure (for all collected data see Supplementary Table 7). The box plots show the range of the data (whiskers), 25th and 75 percentiles (box), means (dashed line), and medians (solid line). Each point represents one animal. a, Visceral white adipose, male mice. 5 months, n=8 animals; 26 months, n=12 animals; 26 months + 3TC, n=12 animals. b, Visceral white adipose, female mice. 5 months, n=8 animals; 26 months, n=12 animals; 26 months + 3TC, n=12 animals. c, Liver, male mice. 5 months, n=8 animals; 26 months, n=10 animals; 26 months + 3TC, n=10 animals. d, Mice at the age of 26 months were treated with K-9 or 3TC in drinking water for two weeks and analyzed by RT-qPCR as above. NT, not treated. Visceral white adipose, male mice, n=7 animals for each group. Data are mean ±s.d. *P ≤ 0.05, **P ≤ 0.01, 1-way ANOVA with Tukey’s multiple comparisons test. Exact P values can be found in the accompanying Source Data.
Extended Data Figure 10. |
Extended Data Figure 10. |. Combinatorial assessment of senescence, IFN-I, SASP and L1 markers and effects of 3TC on age-associated phenotypes in mouse tissues.
a, b, Whole-mount IF was performed on white adipose of 5 months and 26 months old (with and without 2 weeks of 3TC treatment) male mice. In (a) loss of Lamin B1 (senescence marker) was colocalized with IL-6 (SASP marker). In (b) pStat1 (IFN-I marker) was colocalized with Orf1 (L1 marker). c, Quantification of the experiments shown in (a) and (b). 4 animals and at least 200 cells per animal were scored for each condition. d, Neutral lipids were stained with BODIPY to visualize mature adipocytes in whole-mount preparations, and macrophages were detected by IF using the F4/80 antibody. e, The effects of 2 weeks of 3TC treatment on adipogenesis were assessed by measuring mean adipocyte size (left panel), and by RT-qPCR to determine the expression of key adipogenic genes (right panels; Acaca, acetyl-CoA carboxylase 1; Cebp1, CCAAT/enhancer-binding protein alpha; Fasn, fatty acid synthase; Srebp1, sterol regulatory element-binding protein 1). The box plots show the range of the data (whiskers), 25th and 75 percentiles (box), means (dashed line), and medians (solid line). Adipocyte size (BODIPY-stained area) was calculated using CellProfiler; aggregated data for 5 animals and 500 total cells are shown. For RT-qPCR data each point represents one animal; n = 6 animals. f, Expression of the Ucp1 gene (thermogenin) in brown adipose tissue was determined by RT-qPCR and is represented as in (e). n = 5 animals. g, Expression of L1 mRNA was determined by RT-qPCR and is represented as in (e). 5 months, n=8 animals; 26 months, n=12 animals; 29 months, n=6 animals. (e-g) Data are mean ±s.d. *P ≤ 0.05, **P ≤ 0.01. (c, e left panel, f, g) 1-way ANOVA with Tukey’s multiple comparisons test, (e right panels) unpaired two-sided t-tests. Exact P values can be found in the accompanying Source Data.
Figure 1 |
Figure 1 |. Activation of L1, IFN-I and SASP in senescent cells.
Gene expression was assessed by RT-qPCR. Poly(A)-purified RNA was used in all L1 assays. a, Time course of L1 activation. P values were calculated relative to EP, early passage control. b, Schematic of L1 RT-PCR strategy. Blue, sense; red, antisense (AS). For primer specificity see Extended Data Fig. 1f-h; primer design see Methods. Primers for amplicon F were used in (a) and (e). c, Strand-specific L1 transcription was assessed using amplicons A-F. Transcription from the 5’UTR antisense promoter was also detected. SEN (L), late senescence (16 weeks). d, Induction of IFN-α and IFN-β1 mRNA levels. e, The temporal induction of genes associated with DNA damage (p21), SASP (IL-1β, CCL2, IL-6, MMP3), and the IFN-I response (IRF7, IFN-α, IFN-β1, OAS1). Row clustering was calculated as 1-Pearson correlation. RS, replicative senescence; OIS, oncogene induced senescence (elicited by Ha-RAS infection); SIPS, stress induced premature senescence (gamma irradiation). Controls: EP, early passage; EV, empty vector infected; CTR, non-irradiated. (a, c-e), n = 3 independent biological samples, repeated in 2 independent experiments. (a, c, d) Data are mean ±s.d. *P ≤ 0.05, **P ≤ 0.01, unpaired two-sided t-tests. Exact P values can be found in the accompanying Source Data.
Figure 2 |
Figure 2 |. Regulation of L1 activation and IFN-I induction.
a, Expression and ChIP of RB1 and b, FOXA1. Expression was measured by RT-qPCR and immunoblotting (left panels). Binding to L1 elements was assessed with ChIP-qPCR (right panels). For primer locations see Fig. 1b. RB1: 5’UTR, ORF1 and ORF2, primers for amplicons A, E and F, respectively. FOXA1: primers for amplicons A-E. qPCR was normalized to input chromatin. SEN (E), early senescence (8 weeks). For gel source data see Supplementary Fig. 1. c-e, RB1, FOXA1 or TREX1 were overexpressed (OE) or ablated with shRNAs and the effects on expression of L1, IFN-α and IFN-β1were determined by RT-qPCR of poly(A)-purified RNA. In all cases lentiviral vectors were used to deliver the interventions directly into senescent cells at 12 weeks (point D, Extended Data Fig. 1a), and cells were harvested for analysis 4 weeks later (point E, 16 weeks). Controls were uninfected senescent cells harvested at the same time (point E, 16 weeks). Two distinct shRNAs (a, b) were used for each gene. Primers for amplicon F were used for L1. f, RB1 was overexpressed as above and its binding to the 5’UTR was assessed by ChIP-qPCR (amplicon A). g, Activation of L1, IFN-α and IFN-β1 expression after the triple (3X) intervention using shRB1 (a), shTREX1 (a) and FOXA1-OE in early passage cells. Lentiviral infections were performed sequentially with drug selections at each step (shRB1, puromycin –> shTREX1, hygromycin –> FOXA1-OE, blasticidin). h, Expression of IFN-I pathway genes was determined with the RT Profiler PCR array (Qiagen). Normalized mean expression is shown for all 84 genes in the array. Red symbols: significantly upregulated genes. Dashed lines demarcate the ±2-fold range. (a, b, h), n = 3 independent biological samples, repeated in 2 independent experiments. (c-g), n = 3 independent experiments. (a-g) Data are mean ±s.d. *P ≤ 0.05, **P ≤ 0.01, unpaired two-sided t-tests. Exact P values can be found in the accompanying Source Data.
Figure 3 |
Figure 3 |. Ablation of L1 relieves IFN-I activation and blunts the SASP response.
a, Cells were examined by immunofluorescence (IF) microscopy using antibodies to single-stranded DNA (ssDNA) or L1 ORF1 protein. Note the bright ssDNA puncta in senescent cells that colocalized with prominent puncta of ORF1. The experiment was independently repeated 3 times with similar results. Scale bar = 10 μm. b, Senescent cells were treated with L1 shRNAs (using lentiviral vectors as described in Fig. 2c, e, f) or with 3TC (7.5 μM) between 12 and 16 weeks of senescence. Effects on the IFN-I response were determined by RT-qPCR, ELISA or immunoblotting. For gel source data see Supplementary Fig. 1. c, Cells were labeled with BrdU for 2 weeks (with or without 7.5 μM 3TC), labeled DNA was immunoprecipitated, and its L1 sequence content was quantified using a TaqMan multiplex qPCR assay (Fig. 1b, amplicon F). EP (qui), early passage quiescent cells. d, Left panel, RS cells: IFNAR1 and IFNAR2 genes were mutagenized using the CRISPR/Cas9 system delivered with lentivirus vectors directly into senescent cells. As with shRNA interventions, cells were infected at 12 weeks and harvested at 16 weeks of senescence (Fig. 1d-f, Methods). Right panel, SIPS cells: CRISPR/Cas9 intervention was performed in early passage cells and a validated clone was irradiated to induce SIPS. e, OIS and SIPS were induced as in Fig. 1d and cells were harvested 20 days (OIS) or 30 days (SIPS) later. 3TC (7.5 μM) was present throughout. IFN-I gene expression (IFN-α, IRF7, OAS1) was measured by RT-qPCR. f, Cells were serially passaged into replicative senescence (RS) with 3TC (10 μM) present throughout, and the temporal induction of SASP response genes (IL-1β, CCL2, IL-6, MMP3) was assessed. (b-d, f), n = 3 independent experiments. (e) n = 3 independent biological samples, repeated in 2 independent experiments. (b-f) Data are mean ±s.d. *P ≤ 0.05, **P ≤ 0.01. (b, d-f) unpaired two-sided t-tests, (c) 1-way ANOVA with Tukey’s multiple comparisons test. Exact P values can be found in the accompanying Source Data.
Figure 4 |
Figure 4 |. L1s are activated with age in murine tissues and the IFN-I proinflammatory response is relieved by NRTI treatment.
a, Presence of L1 Orf1 protein in tissues was examined by IF microscopy. Quantification of ORF1 expressing cells is shown in the right panel; 3 animals and at least 200 cells per animal were scored for each condition. Scale bar = 4 μm. b, Activation of L1 in senescent cells was examined by co-staining for SA-β-Gal activity and Orf1 protein by IF (male liver, 5 and 26 months). Scale bar = 4 μm. The experiment was repeated 3 times independently with similar results. c, Mice were administered 3TC (2 mg/ml) in drinking water at the indicated ages for two weeks and sacrificed after treatment. Expression of p16, an IFN-I response gene (Ifn-α), and a marker of a proinflammatory state (Il-6) were assessed by RT-qPCR. See Extended Data Fig. 9 for additional tissues and genes. The box plots show the range of the data (whiskers), 25th and 75 percentiles (box), means (dashed line), and medians (solid line). Each point represents one animal. 5 months, n = 8; 26 months, n = 12; 29 months, n = 6. d, Six month old mice were non-lethally irradiated and expression of L1, p16 and representative IFN-I response genes (Ifn-α, Oas1) were assessed by RT-qPCR at the indicated times post-irradiation. Graphical presentation is as in (c); non-irradiated, n = 3 animals at 3 months, n = 5 animals at 6 months; irradiated, n = 4 animals at 3 months, n = 5 animals at 6 months. e, Macrophage infiltration into white adipose tissue and kidney was scored as F4/80 positive cells (% of total nuclei). n = 5 animals group (adipose); n = 8 (kidney). Skeletal muscle fiber diameter was measured (Methods) and plotted as an aggregate box plot. n = 5 animals per group, 500 fibers total. Glomerulosclerosis was scored in periodic acid-Shiff (PAS)-stained sections (Methods) as the sum of all glomeruli with a score of 3 or 4 divided by the total. n = 7 animals per group, 40 glomeruli per animal. Graphical presentation is as in (c). 3TC treatment was 2 weeks for white adipose and 6 months (20–26 months) for other tissues. Dashed circle demarcates a single glomerulus. Scale bar = 50 μm. g, Breakdown of L1 surveillance mechanisms leads to chronic activation of the IFN-I response. ISD: interferon-stimulatory DNA pathway. (a, d, e) unpaired two-sided t-tests. (c, e white adipose) 1-way ANOVA with Tukey’s multiple comparisons test. Exact P values can be found in the accompanying Source Data.

Comment in

  • Inhibition of 'jumping genes' promotes healthy ageing.
    Childs B, van Deursen J. Childs B, et al. Nature. 2019 Feb;566(7742):46-48. doi: 10.1038/d41586-018-07553-0. Nature. 2019. PMID: 30728507 Free PMC article.
  • The unusual SASPects.
    Strzyz P. Strzyz P. Nat Rev Mol Cell Biol. 2019 Apr;20(4):195. doi: 10.1038/s41580-019-0111-9. Nat Rev Mol Cell Biol. 2019. PMID: 30770903 No abstract available.

References

    1. Huang CR, Burns KH & Boeke JD Active transposition in genomes. Annu. Rev. Genet. 46, 651–75 (2012). - PMC - PubMed
    1. de Koning AP et al. Repetitive elements may comprise over two-thirds of the human genome. PLoS Genet. 7, e1002384 (2011). - PMC - PubMed
    1. Hancks DC & Kazazian HH Jr Active human retrotransposons: variation and disease. Curr. Opin. Genet. Dev. 22, 191–203 (2012). - PMC - PubMed
    1. Rodic N et al. Long interspersed element-1 protein expression is a hallmark of many human cancers. Am. J. Pathol. 184, 1280–6 (2014). - PMC - PubMed
    1. Erwin JA, Marchetto MC & Gage FH Mobile DNA elements in the generation of diversity and complexity in the brain. Nat. Rev. Neurosci. 15, 497–506 (2014). - PMC - PubMed

Publication types

MeSH terms