Review
. 2018 Dec;35(5):384-392.
doi: 10.1055/s-0038-1676328. Epub 2019 Feb 5.

Noninvasive Arterial Testing: What and When to Use

Affiliations
Review

Noninvasive Arterial Testing: What and When to Use

Derek Mittleider. Semin Intervent Radiol. 2018 Dec.

Abstract

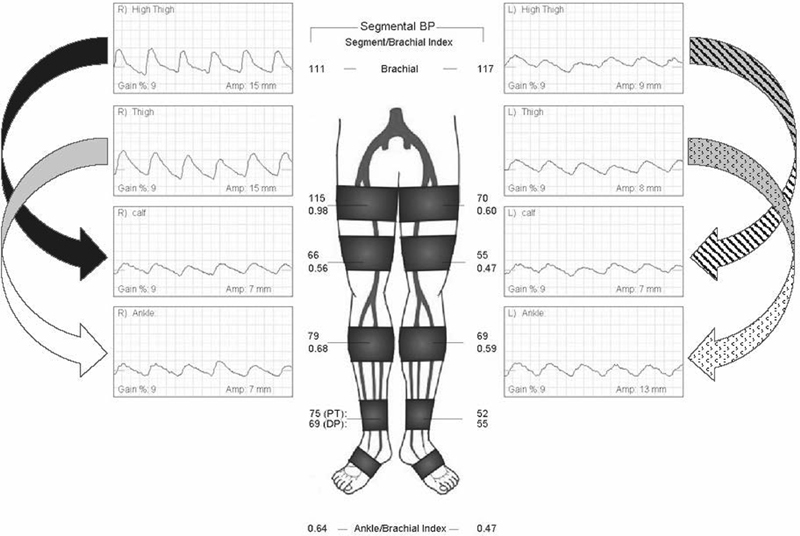
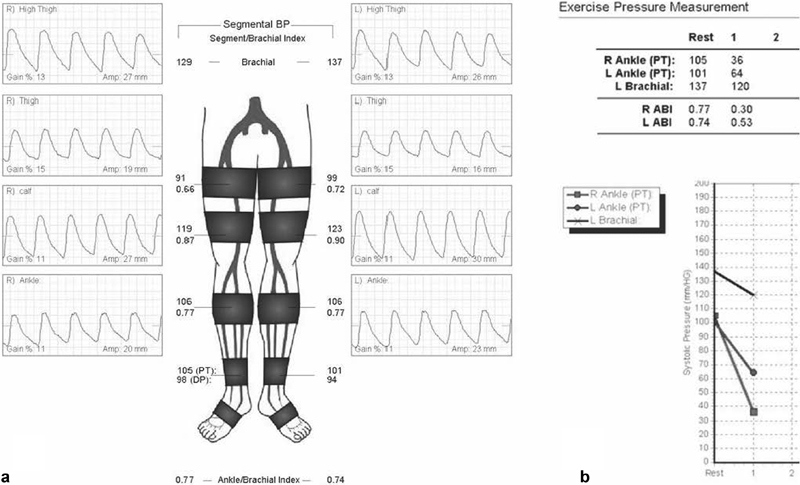
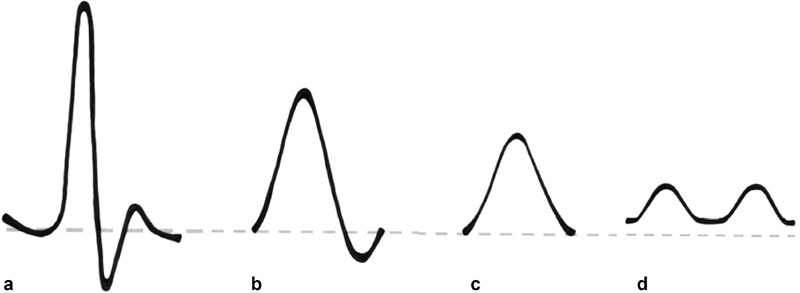
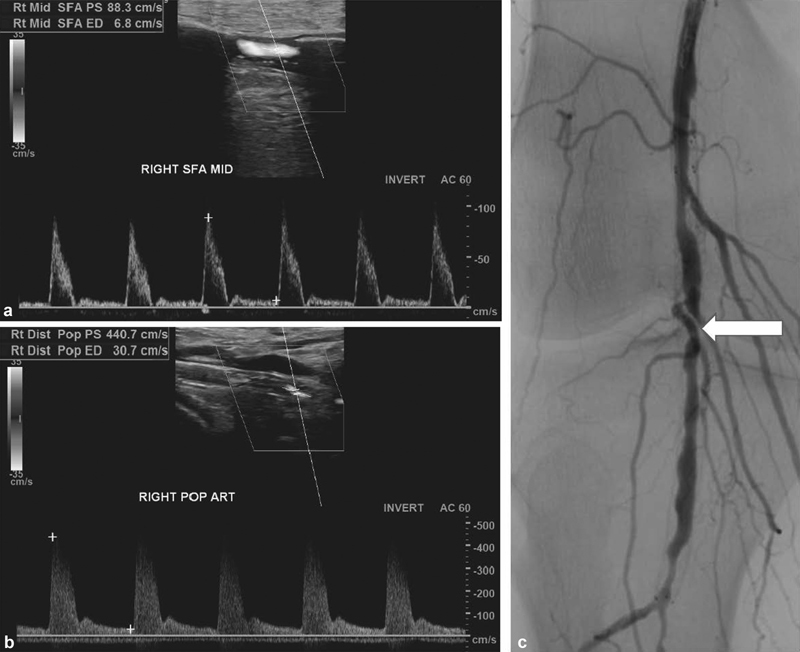
Peripheral arterial disease (PAD) represents a growing public health issue that continues to be underdiagnosed. In its most severe form, critical limb ischemia, it contributes to expanding morbidity with minor and major limb amputations. PAD is strongly associated with increased mortality, as it is known to be concomitant with coronary and cerebrovascular disease. Diagnosis of PAD relies on noninvasive arterial testing, a class of tests that can provide physiologic or morphologic information. Physiologic tests such as ankle-brachial index, toe-brachial index, pulse volume recordings, and arterial duplex evaluation are the mainstay of gateway evaluation and surveillance. Morphologic exams such as computer tomographic angiography and magnetic resonance angiography are appropriate for preprocedural anatomic evaluation in patients with established vascular disease. This review focuses on physiologic exams.

Keywords: ankle-brachial index; interventional radiology; noninvasive arterial testing; physiologic arterial test; pulse volume recordings.


Figures

Fig. 1
Fig. 1
Normal waveform morphology in a pulse volume recording. Classically, a normal waveform is described as having a dicrotic notch ( a , black arrow ). A common manifestation of a normal waveform has a clearly defined inflection point rather than a dicrotic notch ( b , dashed arrow ).
Fig. 2
Fig. 2
Normal ( a ), mildly abnormal ( b ), moderately abnormal ( c ), and severely abnormal ( d ) pulse volume recordings. As the waveform degrades, the inflection point disappears first, followed by diminished waveform amplitude and increased upstroke time.
Fig. 3
Fig. 3
Segmental pressures and pulse volume recordings in a normal exam. Exam demonstrates normal waveform morphology and ratios. There is appropriate augmentation at the calf ( black arrow ) and maintained amplitude at the ankle ( white arrow ).
Fig. 4
Fig. 4
Isolated unilateral iliac occlusive disease. PVRs on the right demonstrate waveform degradation and diminished amplitudes at the high thigh consistent with significant iliac disease. Augmentation is maintained at the calf ( black arrow ), and amplitude is maintained at the ankle ( white arrow ). PVRs on the left are normal.
Fig. 5
Fig. 5
Multilevel disease bilateral lower extremities. On the right, the high thigh waveform is normal. The calf waveform is degraded with loss of amplitude indicating occlusive fem-pop disease ( black arrow ). There is diminished amplitude at the ankle relative to the low thigh indicating tibial disease ( white arrow ). On the left, the high thigh waveforms and amplitudes are abnormal consistent with occlusive iliac disease. There is no augmentation at the calf consistent with concomitant fem-pop disease ( dashed arrow ). There is maintained amplitude at the ankle consistent with no significant tibial disease ( dotted arrow ).
Fig. 6
Fig. 6
PVRs and ABIS pre- and postexercise in a patient with aortoiliac occlusive disease. There is subtle abnormality of the PVR waveforms at all levels with no discrete inflection point. Lack of augmentation is due to gain adjustment by the sonographer ( a ). Following exercise, ABIs drop markedly and symmetrically ( b ).
Fig. 7
Fig. 7
( a ) Normal Doppler waveform. ( b ) Biphasic waveform. ( c ) Monophasic high-resistance waveform. ( d ) Monophasic low-resistance waveform with persistent antegrade diastolic flow.
Fig. 8
Fig. 8
Duplex image with arterial velocity measurement immediately proximal to the stent within the P2 and P3 segments of the popliteal artery ( a ). Duplex image of peak systolic velocity within the stented segment ( b ). PSVR is 5, consistent with a high-grade stenosis. Angiogram of the stented segment with the point of maximal stenosis obscured by a large crossing collateral ( white arrow ).

References

    1. Nehler M R, Duval S, Diao L et al.Epidemiology of peripheral arterial disease and critical limb ischemia in an insured national population. J Vasc Surg. 2014;60(03):686–9500. - PubMed
    1. Fowkes F G, Rudan D, Rudan Iet al.Comparison of global estimates of prevalence and risk factors for peripheral artery disease in 2000 and 2010: a systematic review and analysis Lancet 2013382(9901):1329–1340. - PubMed
    1. Cooke J P, Chen Z. A compendium on peripheral arterial disease. Circ Res. 2015;116(09):1505–1508. - PMC - PubMed
    1. McCann T E, Scoutt L M, Gunabushanam G. A practical approach to interpreting lower extremity noninvasive physiologic studies. Radiol Clin North Am. 2014;52(06):1343–1357. - PubMed
    1. Del Conde I, Benenati J F. Noninvasive testing in peripheral arterial disease. Interv Cardiol Clin. 2014;3(04):469–478. - PubMed