

Optimal targeting of BCL-family proteins in head and neck squamous cell carcinoma requires inhibition of both BCL-xL and MCL-1
- PMID: 30728900
- PMCID: PMC6355180
- DOI: 10.18632/oncotarget.26563
Optimal targeting of BCL-family proteins in head and neck squamous cell carcinoma requires inhibition of both BCL-xL and MCL-1
Abstract
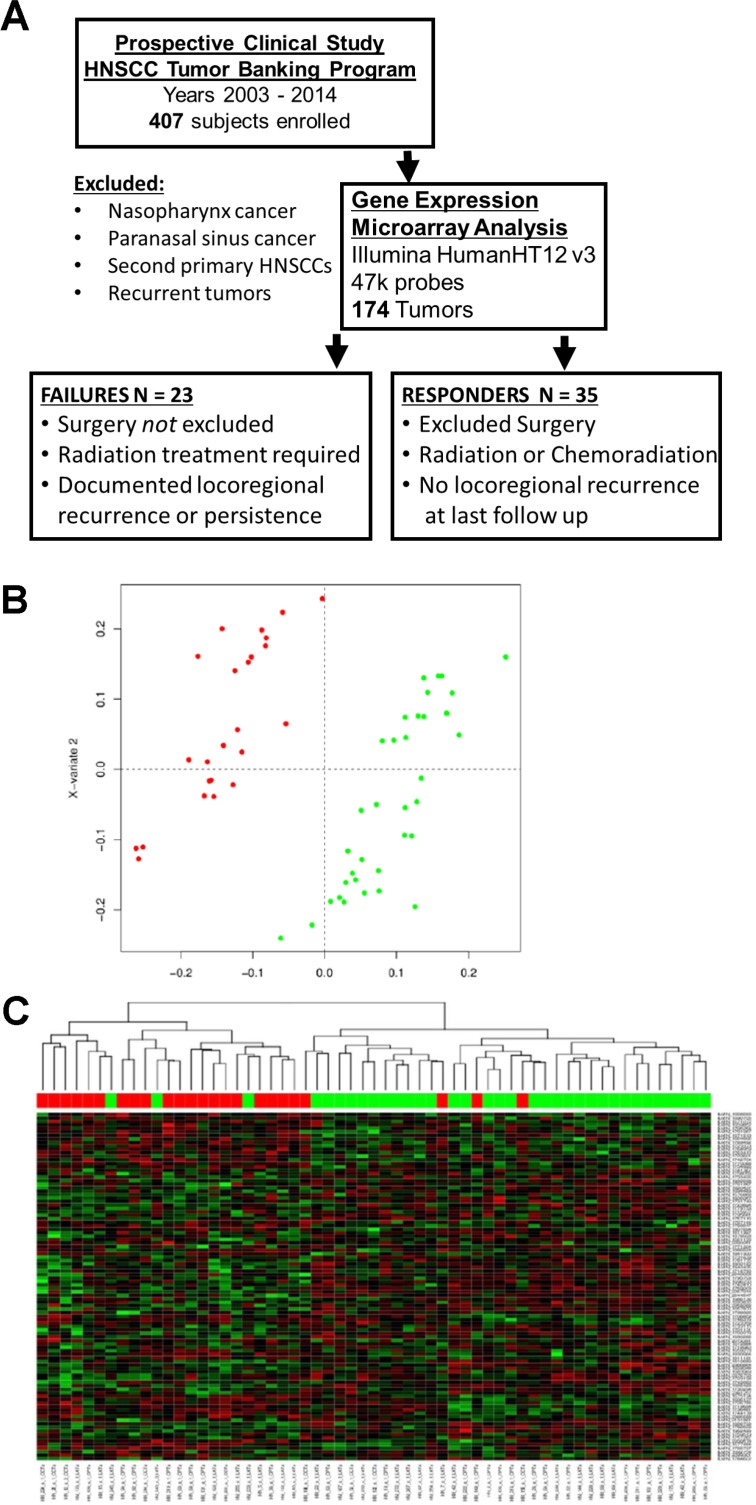
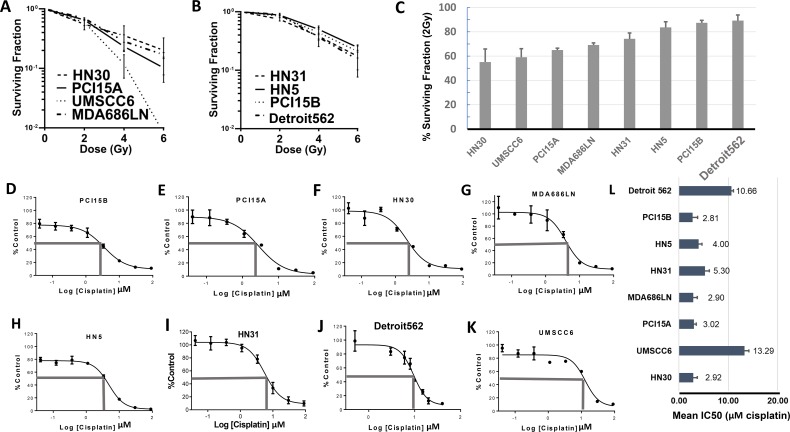
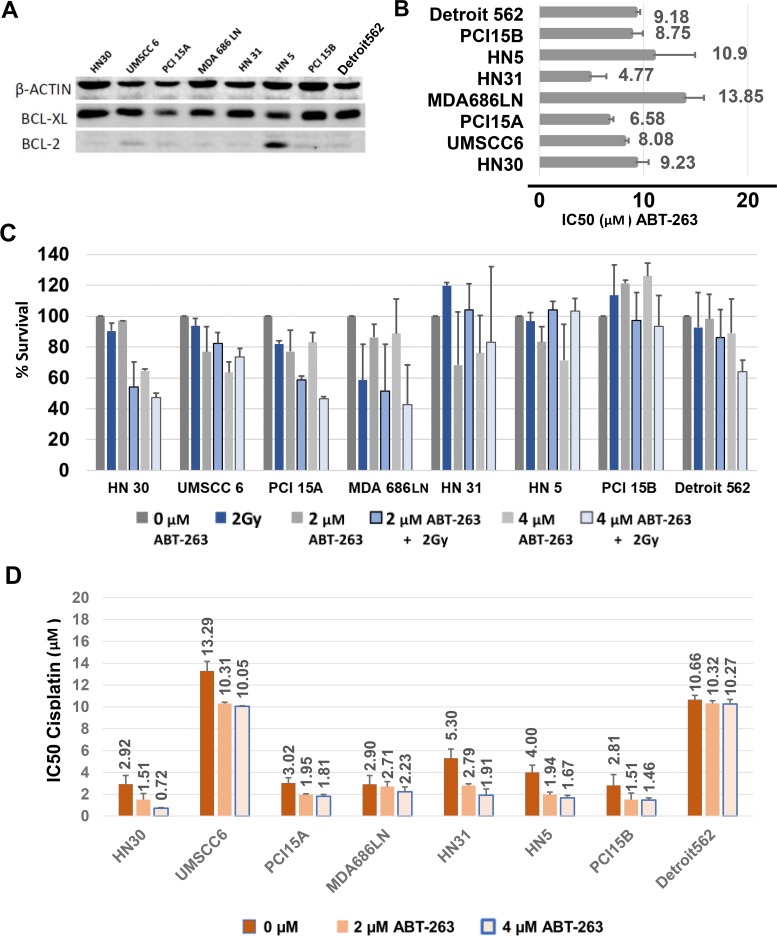
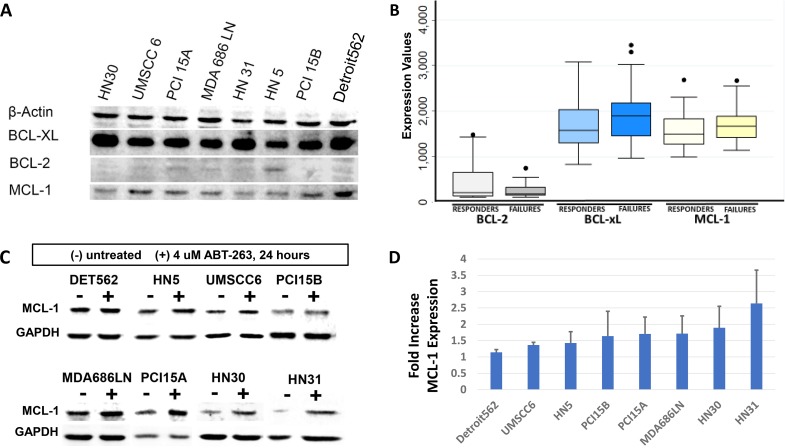
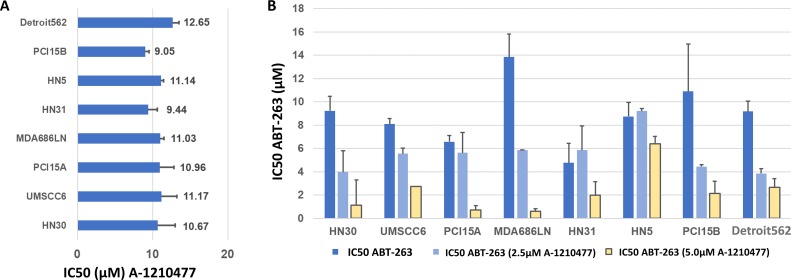
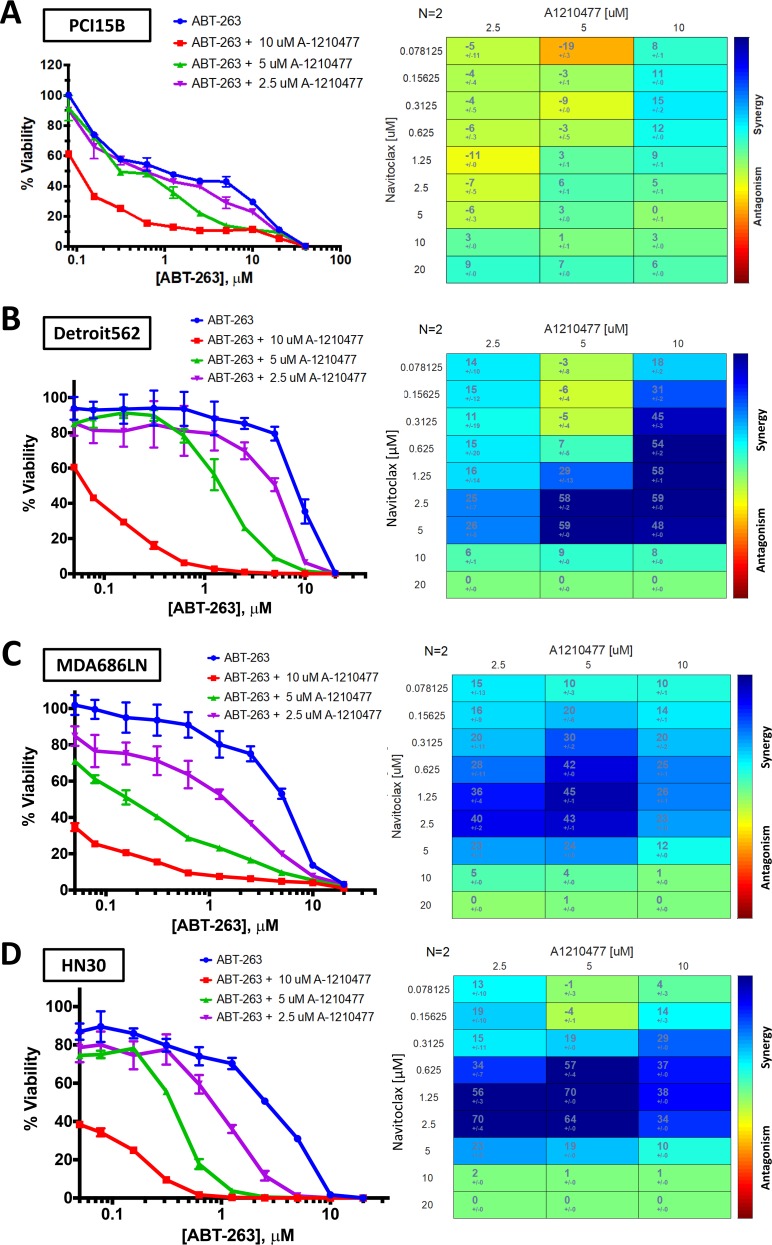
Mechanisms of treatment resistance in head and neck squamous cell carcinoma (HNSCC) are not well characterized. In this study, HNSCC tumors from a cohort of prospectively enrolled subjects on an ongoing tissue banking study were divided into those that persisted or recurred locoregionally (n=23) and those that responded without recurrence (n=35). Gene expression was evaluated using llumina HumanHT-12-v3 Expression BeadChip microarrays. Sparse Partial Least Squares - Discriminant Analysis (sPLS-DA) identified 135 genes discriminating treatment-resistant from treatment-sensitive tumors. BCL-xL was identified among 23% of canonical pathways derived from this set of genes using Ingenuity Pathway analysis. The BCL-xL protein was expressed in 8 HNSCC cell lines examined. Cells were treated with the BCL-xL inhibitor, ABT-263 (navitoclax): the average half maximal inhibitory concentration (IC50) was 8.9μM (range 6.6μM - 13.9μM). Combining ABT-263 did not significantly increase responses to 2 Gy radiation or cisplatin in the majority of cell lines. MCL-1, a potential mediator of resistance to ABT-263, was expressed in all cell lines and HNSCC patient tumors, in addition to BCL-xL. Treatment with the MCL-1 inhibitor, A-1210477, in HNSCC cell lines showed an average IC50 of 10.7μM (range, 8.8μM to 12.7μM). Adding A-1210477 to ABT-263 (navitoclax) treatment resulted in an average 7-fold reduction in the required lethal dose of ABT-263 (navitoclax) when measured across all 8 cell lines. Synergistic activity was confirmed in PCI15B, Detroit 562, MDA686LN, and HN30 based on Bliss Independence analysis. This study demonstrates that targeting both BCL-xL and MCL-1 is required to optimally inhibit BCL-family pro-survival molecules in HNSCC, and co-inhibition is synergistic in HNSCC cancer cells.
Keywords: A-1210477; BCL-xL; MCL-1; head and neck squamous carcinoma; navitoclax.
Conflict of interest statement
CONFLICTS OF INTEREST The authors declare no potential conflicts of interest.
Figures
Similar articles
-
Apoptosis signaling molecules as treatment targets in head and neck squamous cell carcinoma.Laryngoscope. 2020 Nov;130(11):2643-2649. doi: 10.1002/lary.28441. Epub 2020 Jan 2. Laryngoscope. 2020. PMID: 31894587 Free PMC article.
-
Comprehensive functional evaluation of head and neck squamous cell carcinoma with BH3-profiling demonstrates apoptotic competency and therapeutic efficacy of BH3-mimetics.Oral Oncol. 2024 Dec;159:107069. doi: 10.1016/j.oraloncology.2024.107069. Epub 2024 Oct 17. Oral Oncol. 2024. PMID: 39423550
-
Palbociclib Renders Human Papilloma Virus-Negative Head and Neck Squamous Cell Carcinoma Vulnerable to the Senolytic Agent Navitoclax.Mol Cancer Res. 2021 May;19(5):862-873. doi: 10.1158/1541-7786.MCR-20-0915. Epub 2021 Jan 25. Mol Cancer Res. 2021. PMID: 33495400 Free PMC article.
-
Over-expression of BAG-1 in head and neck squamous cell carcinomas (HNSCC) is associated with cisplatin-resistance.J Transl Med. 2017 Sep 6;15(1):189. doi: 10.1186/s12967-017-1289-2. J Transl Med. 2017. PMID: 28877725 Free PMC article.
-
Combination Therapy of Navitoclax with Chemotherapeutic Agents in Solid Tumors and Blood Cancer: A Review of Current Evidence.Pharmaceutics. 2021 Aug 28;13(9):1353. doi: 10.3390/pharmaceutics13091353. Pharmaceutics. 2021. PMID: 34575429 Free PMC article. Review.
Cited by
-
Overcoming Resistance to Standard-of-Care Therapies for Head and Neck Squamous Cell Carcinomas.Cells. 2024 Jun 11;13(12):1018. doi: 10.3390/cells13121018. Cells. 2024. PMID: 38920648 Free PMC article. Review.
-
Apoptosis signaling molecules as treatment targets in head and neck squamous cell carcinoma.Laryngoscope. 2020 Nov;130(11):2643-2649. doi: 10.1002/lary.28441. Epub 2020 Jan 2. Laryngoscope. 2020. PMID: 31894587 Free PMC article.
-
Specific Targeting of Antiapoptotic Bcl-2 Proteins as a Radiosensitizing Approach in Solid Tumors.Int J Mol Sci. 2022 Jul 16;23(14):7850. doi: 10.3390/ijms23147850. Int J Mol Sci. 2022. PMID: 35887198 Free PMC article.
-
Combination Therapy as a Promising Way to Fight Oral Cancer.Pharmaceutics. 2023 Jun 4;15(6):1653. doi: 10.3390/pharmaceutics15061653. Pharmaceutics. 2023. PMID: 37376101 Free PMC article. Review.
-
A-1210477, a selective MCL-1 inhibitor, overcomes ABT-737 resistance in AML.Oncol Lett. 2019 Nov;18(5):5481-5489. doi: 10.3892/ol.2019.10891. Epub 2019 Sep 19. Oncol Lett. 2019. PMID: 31612056 Free PMC article.
References
Grants and funding
LinkOut - more resources
Full Text Sources
Research Materials
