. 2019 Jan 15;10(5):573-583.
doi: 10.18632/oncotarget.26542.

Increased PD-L1 expression in radioresistant HNSCC cell lines after irradiation affects cell proliferation due to inactivation of GSK-3beta

Affiliations

Increased PD-L1 expression in radioresistant HNSCC cell lines after irradiation affects cell proliferation due to inactivation of GSK-3beta

Daniela Schulz et al. Oncotarget. .

Abstract

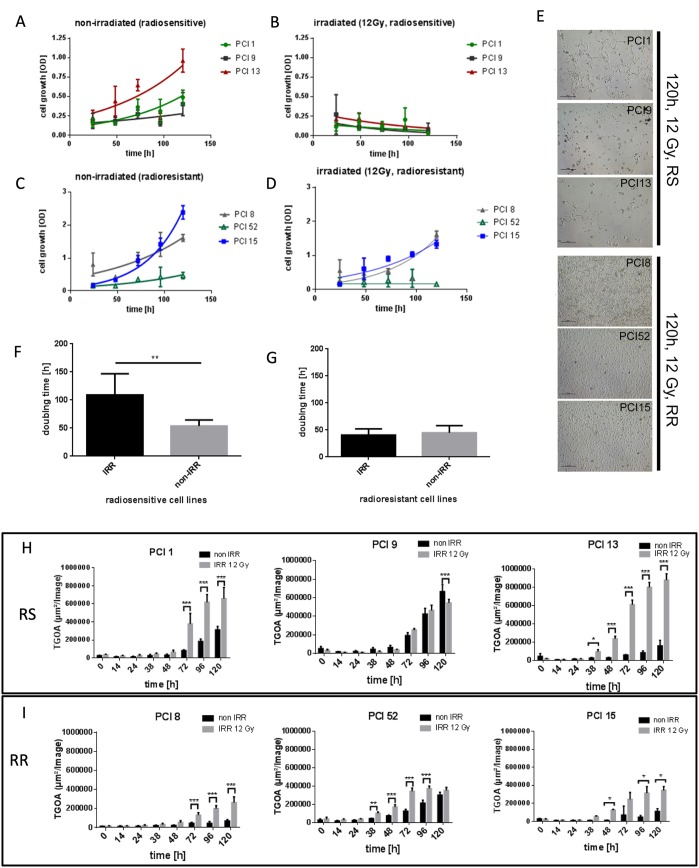
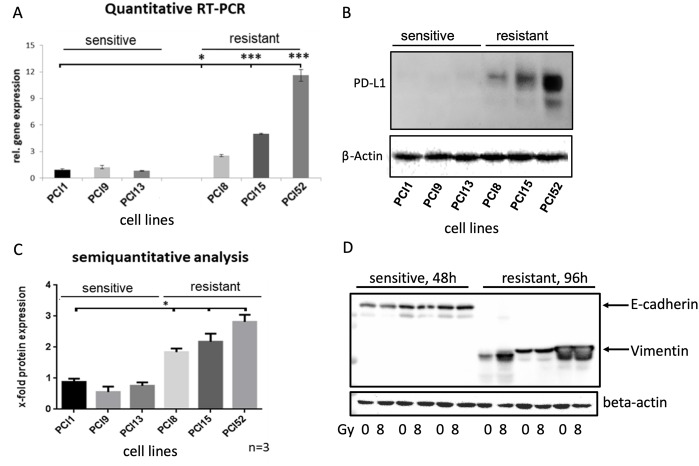
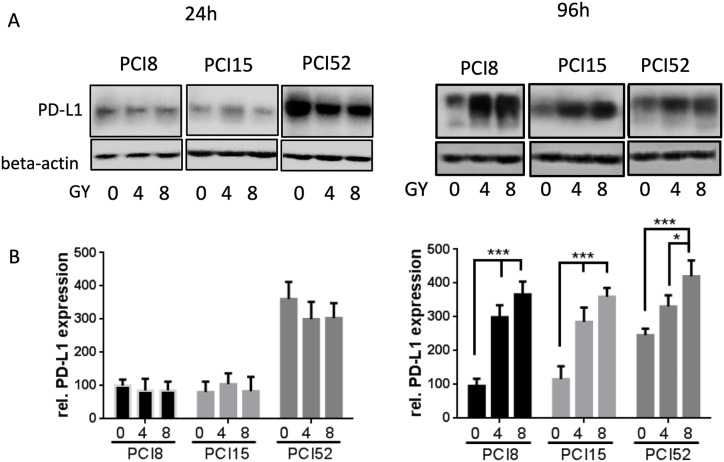
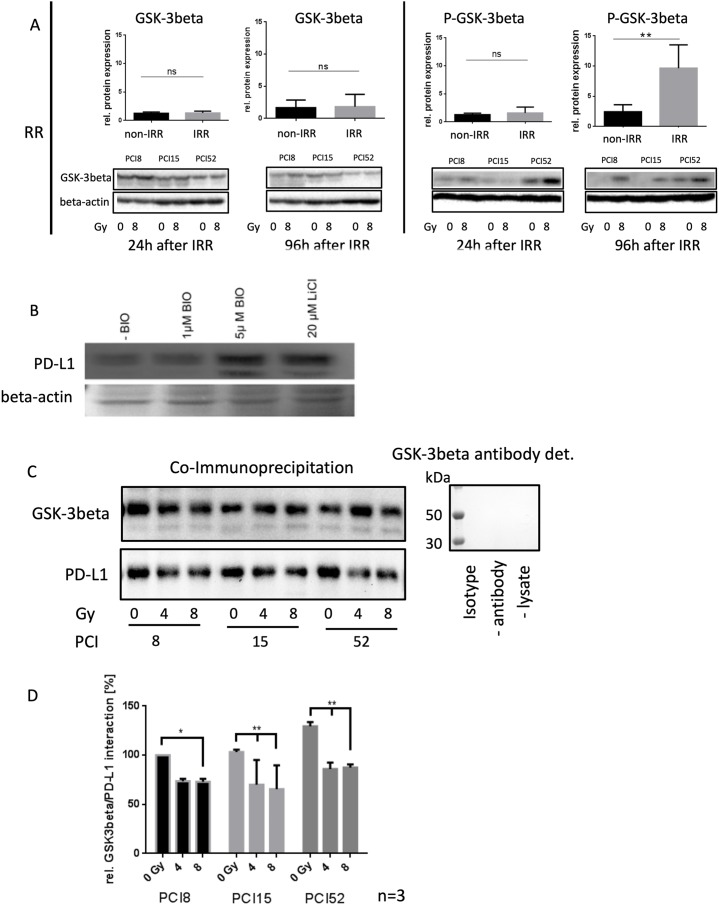
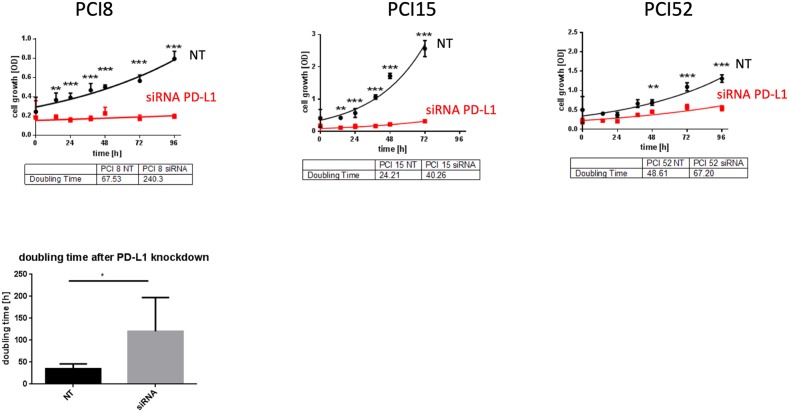
At present, targeting PD-1/PD-L1 axis for immune checkpoint inhibition has improved treatment of various tumor entities, including head and neck squamous cell carcinoma (HNSCC). However, one part of the patient cohort still shows little improvement or even hyperprogression. We established three radioresistant (RR) and three radiosensitive (RS) HNSCC cell lines. RR cells showed prolonged survival as well as delayed and diminished apoptosis after irradiation with vimentin expression but no E-cadherin expression, whereas RS cell lines died early and exhibited early apoptosis after irradiation and high vimentin expression. Here, we present results demonstrating differential basal PD-L1 gene and protein expression in RR and RS HNSCC cell lines. Moreover, we observed a radiation dose dependent increase of total PD-L1 protein expression in RR cell lines up to 96h after irradiation compared to non-irradiated (non-IRR) cells. We found a significant GSK-3beta phosphorylation, resulting in an inactivation, after irradiation of RR cell lines. Co-immunoprecipitation experiments revealed decreased interaction of GSK-3beta with PD-L1 in non-IRR compared to irradiated (IRR) RR cells leading to PD-L1 stabilization in RR cells. PD-L1 knockdown in RR cells showed a strong decrease in cell survival. In summary, our results suggest an irradiation dependent increase in basal PD-L1 expression in RR HNSCC cell lines via GSK-3beta inactivation.

Keywords: GSK-3beta; PD-L1; head and neck cancer; immune checkpoint; irradiation.


Conflict of interest statement

CONFLICTS OF INTEREST The authors declare no conflicts of interest.

Figures

Figure 1
Figure 1. Characterization of radiosensitivity in six HNSCC cell lines via WST-1 viability assay
(A, B) Viability of RS cell lines 24h – 120h after irradiation with 12Gy. Non-irradiated (non-IRR) cells served as control for unaffected proliferation. Non-IRR controls show constant proliferation during 120h of observation. (C, D) Viability of RR cell lines 24h–120h after irradiation. RR cells show proliferation and survival 120h after irradiation. (E) Representative images of RS cell lines PCI1, 9, 13 and RR cell lines PCI8, 52, 15, 120h after irradiation. 5 days after irradiation images were taken with 4-fold magnification. RS cell lines were strongly diminished 120h after irradiation, whereas RR cell lines reached confluence of 70% to 100%. (F, G) Doubling time of RS and RR cell lines. IRR RS cell lines reacted with extensively prolonged doubling time whereas doubling time of RR cells was unaffected by irradiation. (H) Characterization of radiosensitivity via live cell imaging. Each diagram represents the apoptosis rate of a single cell line as total green object area [μm2/Image] at depicted time points after irradiation with 12Gy. RS cell lines PCI1, 9, 13 show stronger overall induction of apoptosis compared to RR cell lines PCI8, 15, 52 (I). Black bars represent non-IRR controls (non-IRR). Gray bars represent IRR cells (IRR 12Gy). n=4, Two-Way ANOVA * = p < 0,05, ** = p < 0,01, *** p= < 0,001.
Figure 2
Figure 2. Differential PD-L1 protein expression in HNSCC cell lines with different radiosensitivity
(A) Quantitative Taqman RT-qPCR showing basal gene expression of PD-L1. No significant difference in PD-L1 gene expression in RS cell lines PCI1, 9, 13, whereas all RR cell lines PCI8, 15, 52 showed significantly higher gene expression of PD-L1 one compared to RS reference PCI1. (B) Representative western blot showing basal protein expression of PD-L1. All RR HNSCC cell lines PCI8, 15, 52 show a markedly higher protein expression of PD-L1 than RS cell lines PCI1, 9, 13. (C) Semiquantitative analysis of western blot shows a consistent low protein expression of PD-L1 in RS cell lines. No significant difference observable in RS cell lines PCI1, 9, 13, whereas each RR cell lines PCI8, 15, 52 prove a significantly higher protein expression of PD-L1 in comparison to RS reference PCI1. (D) Western blot analysis of E-cadherin and Vimentin expression in RS and RR HNSCC cell lines. RS cell lines express E-cadherin but no Vimentin. RR cell lines express Vimentin but no E-cadherin. Lysates from RS cell were taken 48h after irradiation. For quantification the samples derive from the same experiment and blots were processed in parallel. The results are expressed as means ± SD * = p < 0,05, ** = p< 0,01, *** p= < 0.001 when compared to reference control PCI1. n=3, two-tailed Student’s t-Test. (* = p < 0,05).
Figure 3
Figure 3. (A) PD-L1 protein expression after irradiation
Cells were irradiated with 4Gy and 8Gy. Non-IRR cells served as control (0Gy). 24h and 96h after irradiation cells were lysed in RIPA buffer. Each diagram represents the PD-L1 protein expression of a single cell line. (B) Semiquantitative analysis of western blots. 24h after irradiation PD-L1 protein expression hardly changed with increasing radiation. After 96h PD-L1 expression significantly increased dose-dependently. For quantification the samples derive from 3 separate blots where quantifications of the 3 cell lines were processed in parallel. 30µg protein lysate was loaded. n=3, 2-way ANOVA ** = p < 0,01, *** p= < 0,001, samples were normalized with beta-Actin loading control, Non-IRR 0Gy value of PCI8 was used for baseline definition.
Figure 4
Figure 4. Regulation of PD-L1 protein expression
(A) Western blot and semiquanititative analysis of GSK-3beta and its inactivated state represented as phosphorylated-GSK-3beta (P-GSK-3beta) at Ser09 24h and 96h after irradiation with 8Gy. Non-IRR cells (0Gy) were used as controls. RR HNSCC cell lines did not show any significant change in GSK-3beta expression (lower left panel). However, inactivation of GSK-3beta occured 96h after irradiation. Phosphorylation at Ser09 was on average 10x higher compared to the level of non-IRR cells. Beta-Actin was used as loading control. n=3, Student’s t-Test ** = p < 0,01, ns=not significant (B) PD-L1 expression is dependent on GSK-3beta activation. Western blot analysis of PD-L1 expression after inhibition of GSK-3beta with 20μM LiCl and specific inhibition with 1μM and 5μM BIO. Exemplified GSK-3b dependent PD-L1 expression with HNSCC cell line PCI52. n=3. Ponceau staining was used as loading control. (C) Co-immunoprecipitation for identification of an interaction between PD-L1 and GSK-3beta without (0Gy) and after 96h of irradiation with 4 and 8Gy. GSK-3beta, including its attached binding partners, was precipitated with a specific antibody. Presence of PD-L1, necessarily interacting with GSK-3beta, was proven via western blot analysis. All RR cell lines PCI8, 15, 52 showed a decrease of PD-L1 interaction after irradiation. GSK-3beta detection served as loading control. Either a polyclonal rabbit IgG Isotype antibody, immunoprecipitation without antibody or without lysate was used as negative control. Undetectable GSK-3beta indicates no unspecific binding. (D) Semiquantitative analysis of western blot indicating relative interaction of GSK-3beta with PD-L1 in percent. After irradiation with 8Gy all RR cell lines PCI8, 15, 52 showed less interaction between GSK-3beta and PD-L1. PCI15 and PCI 52 also showed a significantly reduced interaction of GSK-3beta with PD-L1 after irradiation with 4Gy. Samples were normalized with GSK-3beta. Non-IRR 0Gy value of PCI8 was used for baseline definition. n=3, 2-way ANOVA * = p < 0,05, ** p= < 0,01.
Figure 5
Figure 5. PD-L1 function in RR cell lines
(A) WST-1 viability assay after siRNA knockdown of PD-L1 in RR HNSCC cell lines. All cell lines with PD-L1 knockdown showed a substantial decrease of proliferation compared to cells transfected with scrambled siRNA (NT) as control during the course of 96h. (B) The average doubling time of PD-L1 knockdown cells was 115,9h compared to NT control cells with 46,8h. NT= non-targeting, scrambled non-specific siRNA. Two-way ANOVA * = p < 0,05, ** = p < 0,01, *** = p < 0,001.

References

    1. Ferlay J, Shin HR, Bray F, Forman D, Mathers C, Parkin DM. Estimates of worldwide burden of cancer in 2008: GLOBOCAN 2008. Int J Cancer. 2010;127:2893–917. doi: 10.1002/ijc.25516. - DOI - PubMed
    1. Argiris A, Karamouzis MV, Raben D, Ferris RL. Head and neck cancer. Lancet. 2008;371:1695–709. doi: 10.1016/S0140-6736(08)60728-X. - DOI - PMC - PubMed
    1. Keir ME, Butte MJ, Freeman GJ, Sharpe AH. PD-1 and its ligands in tolerance and immunity. Annu Rev Immunol. 2008;26:677–704. doi: 10.1146/annurev.immunol.26.021607.090331. - DOI - PMC - PubMed
    1. Gevensleben H, Dietrich D, Golletz C, Steiner S, Jung M, Thiesler T, Majores M, Stein J, Uhl B, Muller S, Ellinger J, Stephan C, Jung K, et al. The Immune Checkpoint Regulator PD-L1 Is Highly Expressed in Aggressive Primary Prostate Cancer. Clinical Cancer Research. 2016;22:1969–77. doi: 10.1158/1078-0432.CCR-15-2042. - DOI - PubMed
    1. Lin YM, Sung WW, Hsieh MJ, Tsai SC, Lai HW, Yang SM, Shen KH, Chen MK, Lee H, Yeh KT, Chen CJ. High PD-L1 Expression Correlates with Metastasis and Poor Prognosis in Oral Squamous Cell Carcinoma. PLoS One. 2015;10:e0142656. doi: 10.1371/journal.pone.0142656. - DOI - PMC - PubMed