

A study of within-subject reliability of the brain's default-mode network
- PMID: 30730023
- PMCID: PMC6525123
- DOI: 10.1007/s10334-018-00732-0
A study of within-subject reliability of the brain's default-mode network
Abstract
Objective: Resting-state functional magnetic resonance imaging (fMRI) is promising for Alzheimer's disease (AD). This study aimed to examine short-term reliability of the default-mode network (DMN), one of the main haemodynamic patterns of the brain.
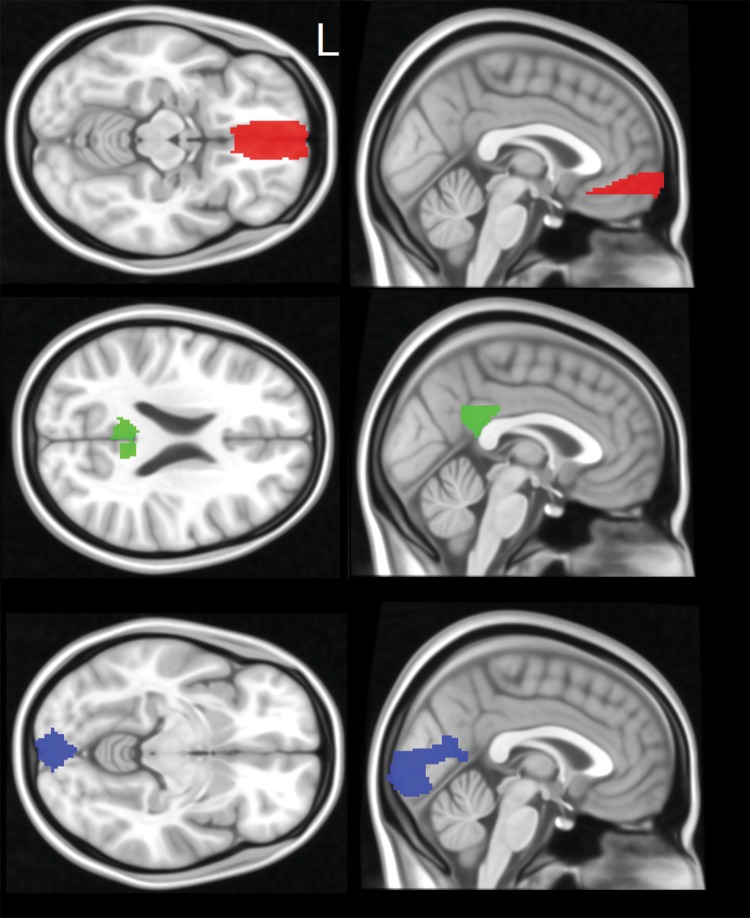
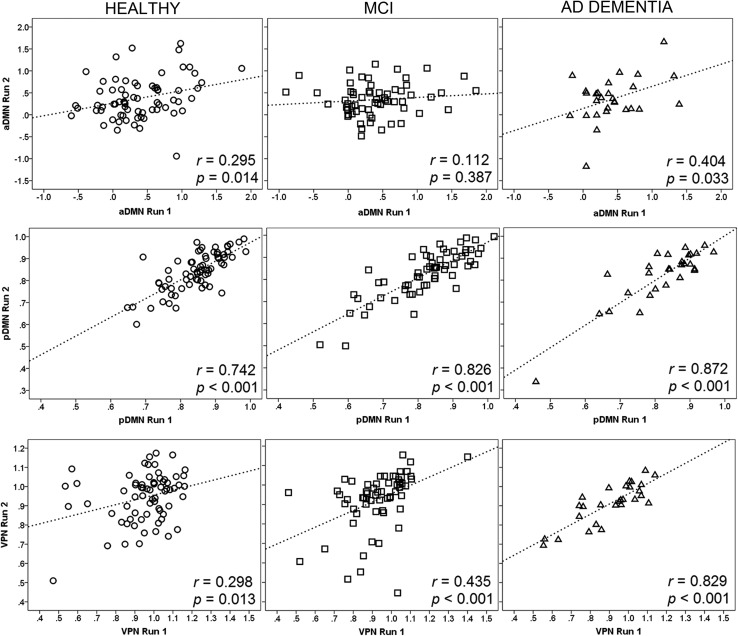
Materials and methods: Using a 1.5 T Philips Achieva scanner, two consecutive resting-state fMRI runs were acquired on 69 healthy adults, 62 patients with mild cognitive impairment (MCI) due to AD, and 28 patients with AD dementia. The anterior and posterior DMN and, as control, the visual-processing network (VPN) were computed using two different methodologies: connectivity of predetermined seeds (theory-driven) and dual regression (data-driven). Divergence and convergence in network strength and topography were calculated with paired t tests, global correlation coefficients, voxel-based correlation maps, and indices of reliability.
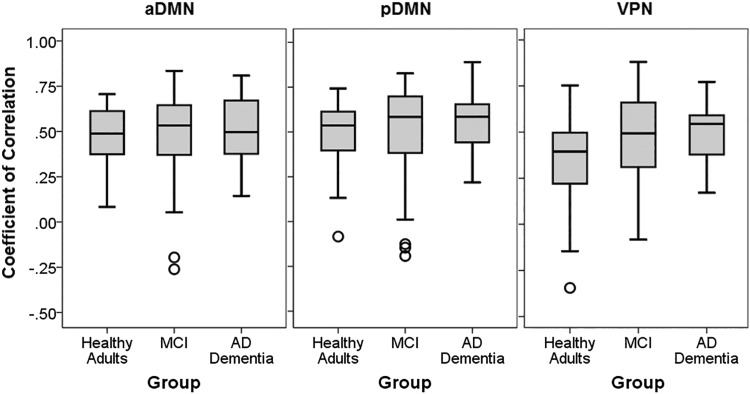
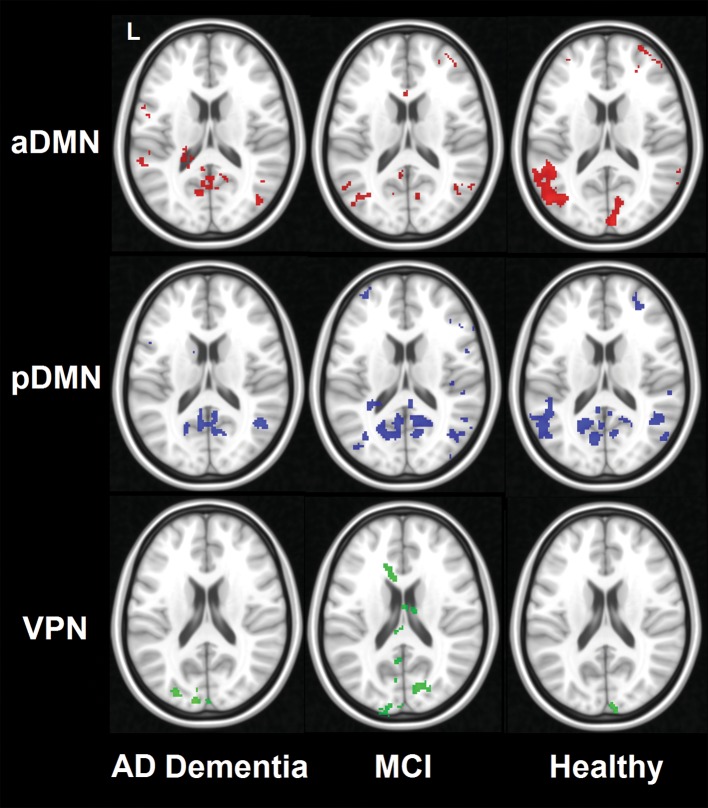
Results: No topographical differences were found in any of the networks. High correlations and reliability were found in the posterior DMN of healthy adults and MCI patients. Lower reliability was found in the anterior DMN and in the VPN, and in the posterior DMN of dementia patients.
Discussion: Strength and topography of the posterior DMN appear relatively stable and reliable over a short-term period of acquisition but with some degree of variability across clinical samples.
Keywords: Brain imaging; Hemodynamics; Reproducibility of results; fMRI.
Conflict of interest statement
The authors declare that they have no conflict of interest.
Figures


Similar articles
-
Does resting state functional connectivity differ between mild cognitive impairment and early Alzheimer's dementia?J Neurol Sci. 2020 Nov 15;418:117093. doi: 10.1016/j.jns.2020.117093. Epub 2020 Aug 13. J Neurol Sci. 2020. PMID: 32827882
-
Cerebrovascular disease influences functional and structural network connectivity in patients with amnestic mild cognitive impairment and Alzheimer's disease.Alzheimers Res Ther. 2018 Aug 18;10(1):82. doi: 10.1186/s13195-018-0413-8. Alzheimers Res Ther. 2018. PMID: 30121086 Free PMC article.
-
Changes of intranetwork and internetwork functional connectivity in Alzheimer's disease and mild cognitive impairment.J Neural Eng. 2016 Aug;13(4):046008. doi: 10.1088/1741-2560/13/4/046008. Epub 2016 Jun 1. J Neural Eng. 2016. PMID: 27247279
-
Imaging the default mode network in aging and dementia.Biochim Biophys Acta. 2012 Mar;1822(3):431-41. doi: 10.1016/j.bbadis.2011.07.008. Epub 2011 Jul 23. Biochim Biophys Acta. 2012. PMID: 21807094 Review.
-
Default Mode Network Connectivity in Alzheimers Disease.Turk Psikiyatri Derg. 2019 Winter;30(4):279-286. Turk Psikiyatri Derg. 2019. PMID: 32594490 Review. English, Turkish.
Cited by
-
Altered Interplay Among Large-Scale Brain Functional Networks Modulates Multi-Domain Anosognosia in Early Alzheimer's Disease.Front Aging Neurosci. 2022 Feb 3;13:781465. doi: 10.3389/fnagi.2021.781465. eCollection 2021. Front Aging Neurosci. 2022. PMID: 35185517 Free PMC article.
-
Alteration of a brain network with stable and strong functional connections in subjects with schizophrenia.Schizophrenia (Heidelb). 2022 Nov 4;8(1):91. doi: 10.1038/s41537-022-00305-0. Schizophrenia (Heidelb). 2022. PMID: 36333328 Free PMC article.
-
Exploring anterior thalamus functional connectivity with cortical regions in prospective memory with ultra-high-field functional MRI.Brain Commun. 2025 Apr 8;7(2):fcaf135. doi: 10.1093/braincomms/fcaf135. eCollection 2025. Brain Commun. 2025. PMID: 40276704 Free PMC article.
-
Large-Scale Functional Networks, Cognition and Brain Structures Supporting Social Cognition and Theory of Mind Performance in Prodromal to Mild Alzheimer's Disease.Front Aging Neurosci. 2021 Nov 17;13:766703. doi: 10.3389/fnagi.2021.766703. eCollection 2021. Front Aging Neurosci. 2021. PMID: 34867292 Free PMC article.
-
Altered Default Mode Network Connectivity in Mild Cognitive Impairment: Insights from Resting-State fMRI Studies.Curr Alzheimer Res. 2025;22(2):83-91. doi: 10.2174/0115672050352061250328055829. Curr Alzheimer Res. 2025. PMID: 40231538 Review.
References
MeSH terms
Grants and funding
LinkOut - more resources
Full Text Sources
Medical
