. 2019 Mar 21;4(6):e122686.
doi: 10.1172/jci.insight.122686.

Distinct pathological signatures in human cellular models of myotonic dystrophy subtypes

Affiliations

Distinct pathological signatures in human cellular models of myotonic dystrophy subtypes

Ellis Y Kim et al. JCI Insight. .

Abstract

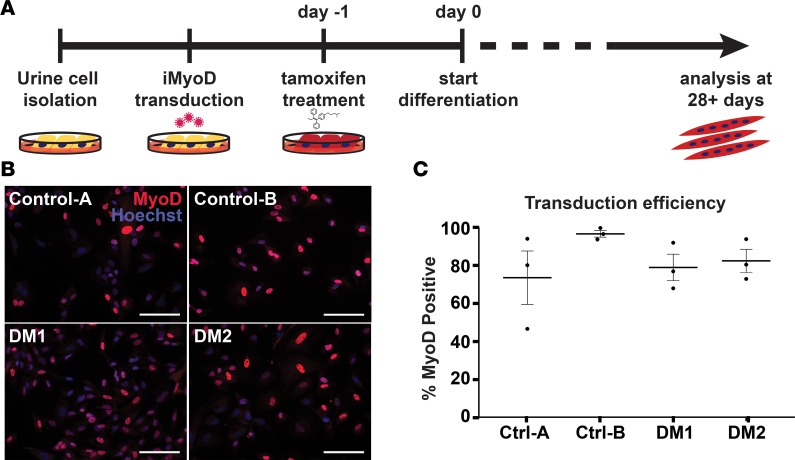
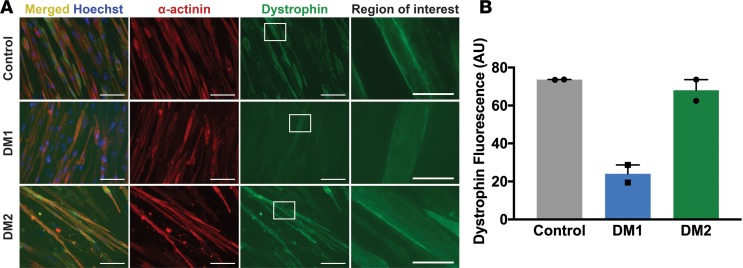
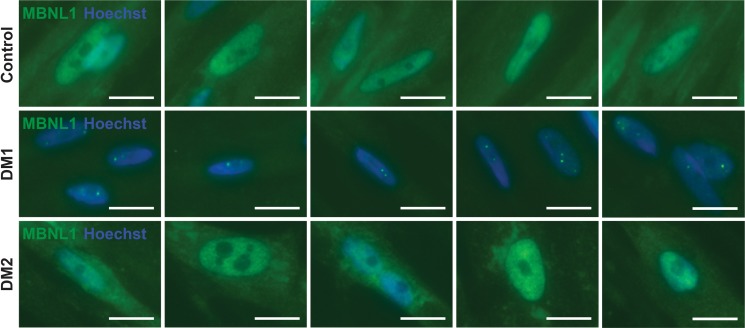
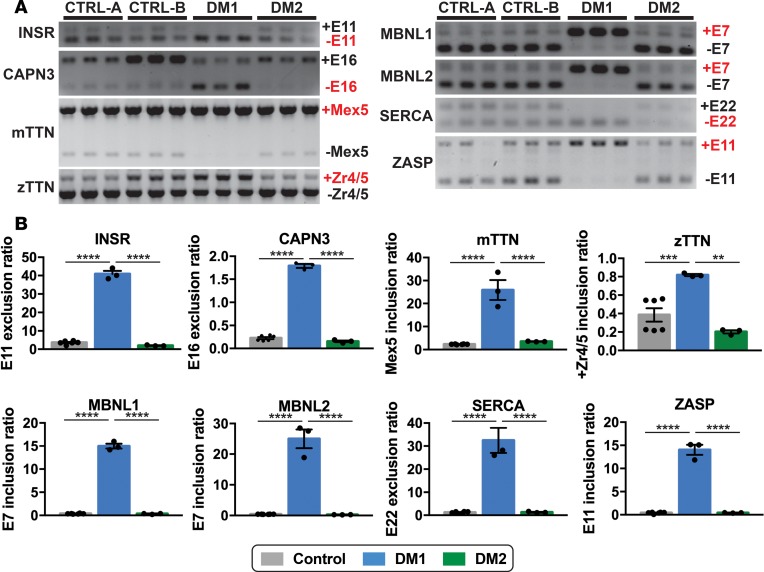
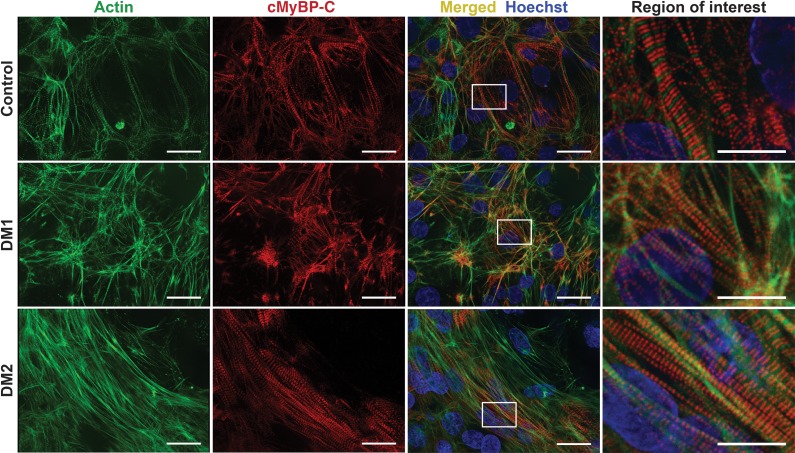
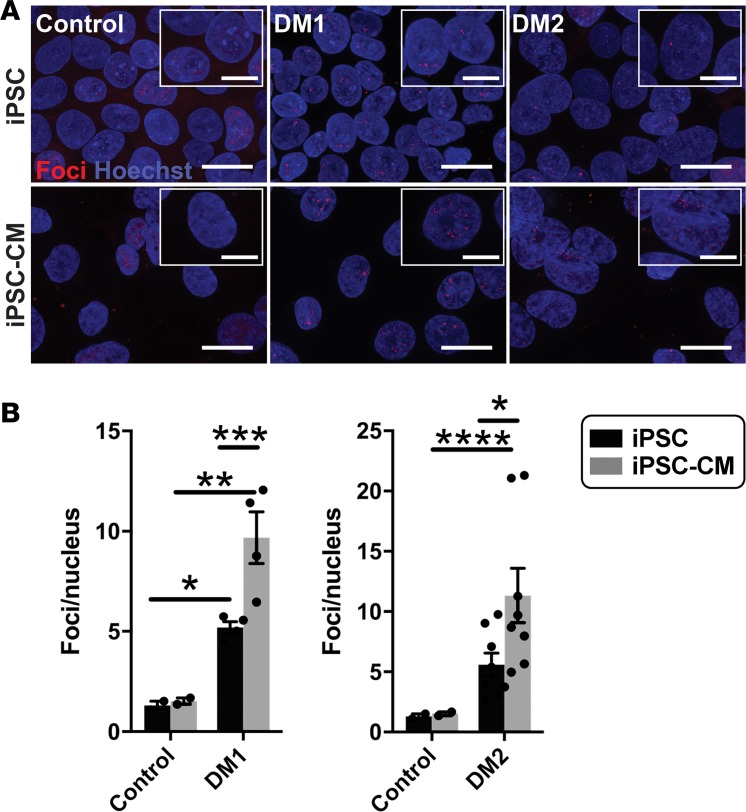
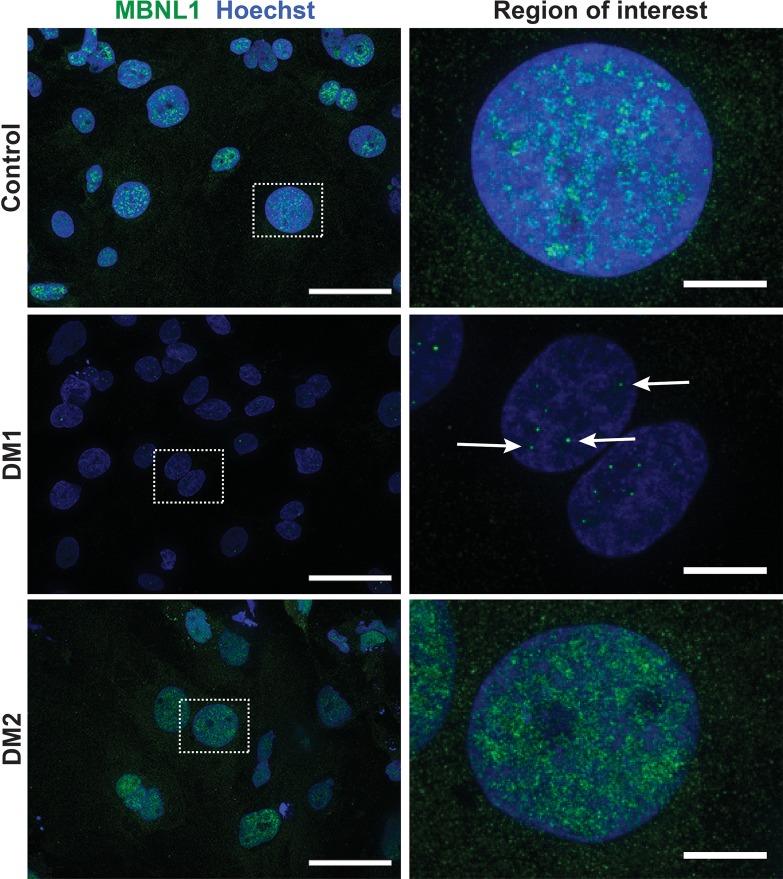
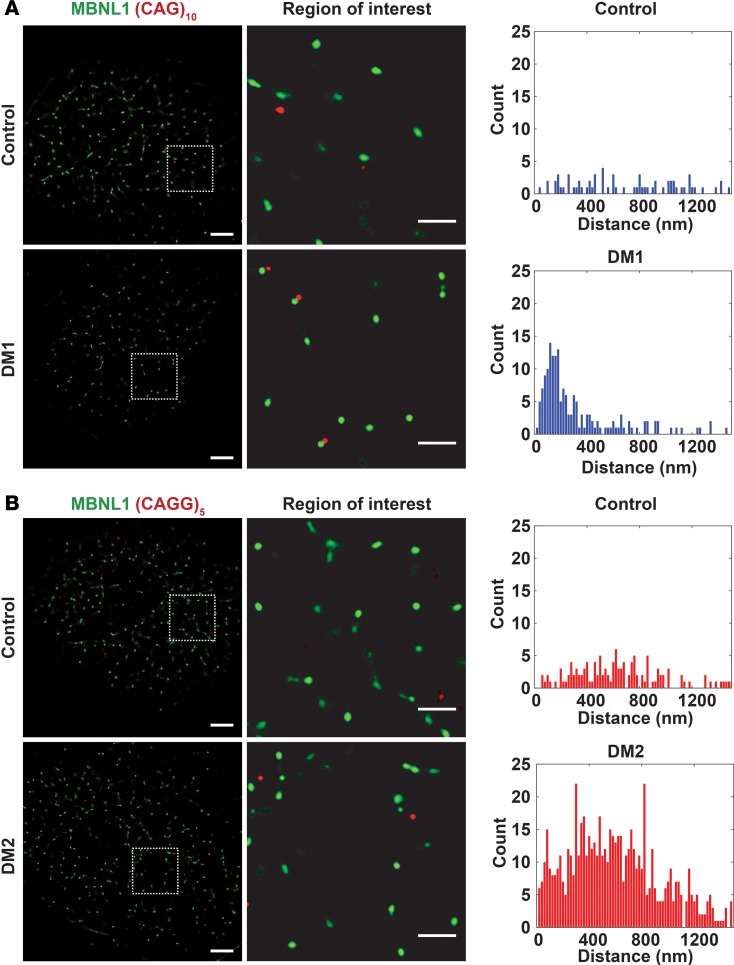
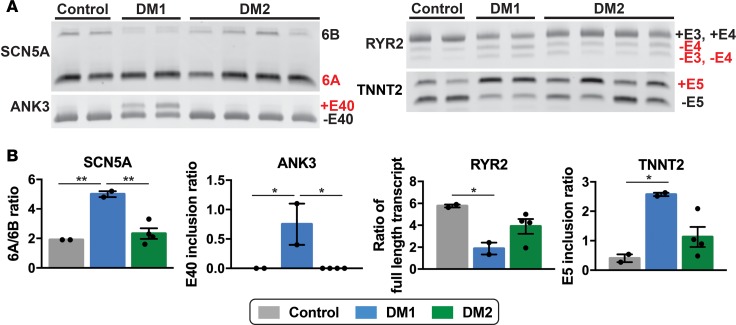
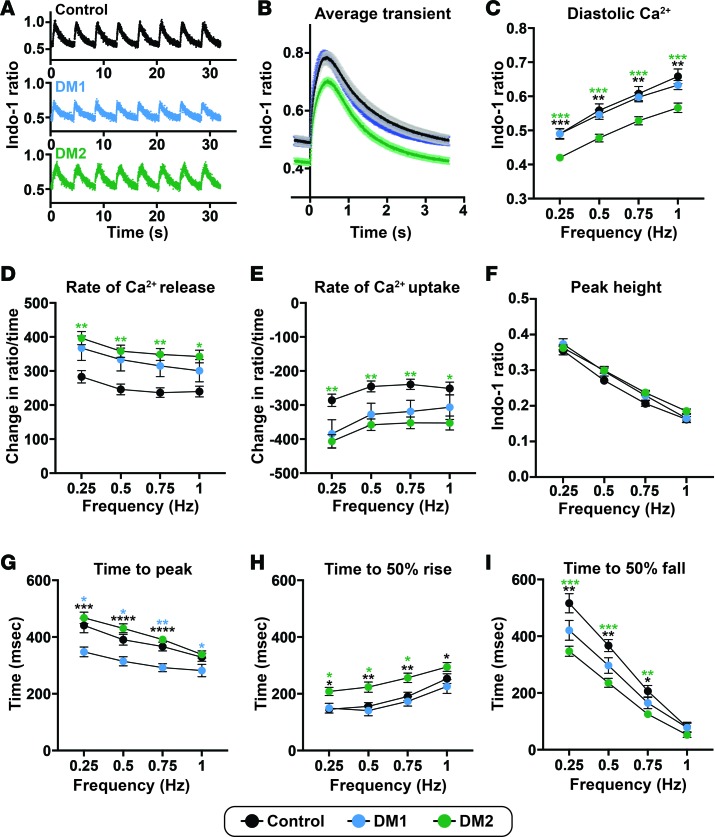
Myotonic dystrophy (DM) is the most common autosomal dominant muscular dystrophy and encompasses both skeletal muscle and cardiac complications. DM is nucleotide repeat expansion disorder in which type 1 (DM1) is due to a trinucleotide repeat expansion on chromosome 19 and type 2 (DM2) arises from a tetranucleotide repeat expansion on chromosome 3. Developing representative models of DM in animals has been challenging due to instability of nucleotide repeat expansions, especially for DM2, which is characterized by nucleotide repeat expansions often greater than 5,000 copies. To investigate mechanisms of human DM, we generated cellular models of DM1 and DM2. We used regulated MyoD expression to reprogram urine-derived cells into myotubes. In this myogenic cell model, we found impaired dystrophin expression, in the presence of muscleblind-like 1 (MBNL1) foci, and aberrant splicing in DM1 but not in DM2 cells. We generated induced pluripotent stem cells (iPSC) from healthy controls and DM1 and DM2 subjects, and we differentiated these into cardiomyocytes. DM1 and DM2 cells displayed an increase in RNA foci concomitant with cellular differentiation. iPSC-derived cardiomyocytes from DM1 but not DM2 had aberrant splicing of known target genes and MBNL sequestration. High-resolution imaging revealed tight association between MBNL clusters and RNA foci in DM1. Ca2+ transients differed between DM1- and DM2 iPSC-derived cardiomyocytes, and each differed from healthy control cells. RNA-sequencing from DM1- and DM2 iPSC-derived cardiomyocytes revealed distinct misregulation of gene expression, as well as differential aberrant splicing patterns. Together, these data support that DM1 and DM2, despite some shared clinical and molecular features, have distinct pathological signatures.

Keywords: Cardiology; Genetic variation; Muscle; Stem cells; iPS cells.


Conflict of interest statement

Conflict of interest: The authors declare no competing interests or conflicts of interest.

Figures

Figure 1
Figure 1. Generating human myotonic dystrophy (DM) myogenic cell lines using direct reprogramming of urine-derived cells with the transcription factor MyoD.
(A) Obtaining muscle biopsies requires an invasive muscle biopsy. In contrast, cells from urine can be obtained noninvasively, and following culturing, urine cells can be reprogrammed into cell types of interest (31). Urine cells were cultured from healthy controls and individuals with myotonic dystrophy type 1 (DM1) and DM2. Once cell cultures were established, cells were transduced with lentivirus expressing an inducible form of MyoD (iMyoD) in order to induce myogenic reprogramming. This lentivirus produces MyoD in the presence of tamoxifen. Tamoxifen was used to induce MyoD expression, which, in turn, stimulated multinucleated myotube formation in culture. Directly reprogrammed multinucleated myotubes were studied after 28 days in culture. (B) MyoD (red) protein expression was readily detected in the nucleus of tamoxifen-treated cells. Nuclei were labeled with Hoechst 33342 (blue). Scale bar: 100 μm. (C) With Hoechst costaining, the transduction efficiency of each transduction (example in B) could be estimated. Transduction efficiency with the iMyoD construct was similar among control, DM1, and DM2 cell lines and, in each case, averaged greater than 70%. Efficiencies are represented as percentages of MyoD positive nuclei relative to total number of nuclei.
Figure 2
Figure 2. Myotonic dystrophy type 1 (DM1) myogenic cells have reduced dystrophin expression compared with DM2 and control cells.
Direct reprogramming of urine cells was used to generate myotubes in culture from healthy control, DM1, and DM2 subjects. The clinical features of these human subjects are indicated in Table 1. (A) Myotubes were immunostained with α-actinin (red) and dystrophin (green) to assess myotube formation, sarcomere, and membrane protein content using markers of the Z disc (α-actinin) and the membrane-associated marker dystrophin. Nuclei were labeled with Hoechst (blue). The left column shows elongated myotubes and the merged α-actinin and dystrophin staining. Higher-magnification images of the white dotted box in column 3 are shown in the right column. Scale bar: 100 μm (images in columns 1, 2, and 3). Scale bar: 25 μm (right column). Reduced dystrophin staining was evident in DM1 myotubes. (B) DM1 myotubes had reduced dystrophin fluorescence (arbitrary units, AU) compared with control and DM2 myotubes. The reduced expression of dystrophin is viewed as a sign of impaired differentiation of DM1 myotubes, consistent with previous reports of cultured myoblasts from muscle (33, 34), and it indicates that reprogrammed urine cells can be used to model myotonic dystrophy in culture.
Figure 3
Figure 3. Muscleblind-like splicing regulator 1 (MBNL1) form intranuclear foci in Myotonic dystrophy type 1 (DM1) myotubes.
A hallmark of DM1 is the sequestration of the splicing factor MBNL1 into intranuclear protein aggregates (12). In DM1, MBNL1 foci associate with CUG repeat expansions expressed in RNA (12-15). To determine if urine-derived, reprogrammed myotubes reflected this same pattern, myotubes were immunostained with α-MBNL1 antibody (green), and nuclei were labeled with Hoechst (blue). In myogenic cells generated from healthy controls, the normal pattern of intranuclear MBNL1 protein was seen with its distribution throughout the nucleus in a diffuse pattern (control row). In DM1 myotubes, this diffuse MBNL pattern was lost and, instead, readily detectable MBNL1-positive intranuclear foci were apparent (DM1 row, green dots). In DM2 myogenic cells, the MBNL1 pattern resembled control cells with diffuse MBNL1 distribution throughout the nucleus, indicating that MBNL1 sequestration is more associated with DM1 compared with DM2. Scale bar: 2 μm.
Figure 4
Figure 4. MBNL1-dependent splicing events in DM1 myotubes but not DM2 myotubes.
Myotonic dystrophy is considered a splicing disorder (16, 17). (A and B) RT-PCR was used to monitor specific MBNL-linked splicing events in DM and control myotubes. Splicing events in the following genes are shown: INSR, CAPN3, mTTN, zTTN, MBNL1, MBNL2, SERCA, and ZASP. In each case, an increase in the embryonic transcripts was observed in DM1 myotubes compared with control and DM2 myotubes (****P < 0.0001, ***P = 0.0035, **P = 0.0009, 1-way ANOVA). The full gels are shown in A, and the quantitation of splice forms is shown in B. Each lane in A indicates technical replicate.
Figure 5
Figure 5. Generation of induced pluripotent stem cells and cardiomyocytes from myotonic dystrophy subjects.
The same urine cells isolated from healthy control, DM1, and DM2 subjects were reprogrammed to induced pluripotent stem cells (iPSCs) using episomal delivery of Yamanaka factors. iPSCs were then differentiated into cardiomyocytes (iPSC-CM). To monitor differentiation status, cells were immunostained with antibodies to actin (green) and cardiac myosin binding protein C (cMyBP-C) (red). Nuclei were labeled with Hoechst (blue). DM1, DM2, and control cells successfully differentiated into iPSC-CMs and the cardiac markers, actin and MYBPC3, demonstrated the expected sarcomeric pattern. Higher-magnification images of the white dotted boxes are shown on the right column. Scale bar: 25 μm (all panels except region of interest). Scale bar: 10 μm (region of interest).
Figure 6
Figure 6. Fluorescence in situ hybridization (FISH) detected an increase in RNA foci after cardiomyocyte differentiation.
FISH was used to detect RNA-encoded nucleotide repeat expansions using probes specific to the repeat expansions in DM1 or DM2. RNA probes for FISH included either (CAG)10 to detect DM1 or (CAGG)5 to detect the DM2 repeat expansion. Probes were labeled with Cy3 (red), FISH was conducted, and the number of foci was quantified and compared in undifferentiated iPSCs and iPSCs that had been differentiated to cardiomyocytes (iPSC-CM). (A) Example images of RNA foci (red) visualized using Cy3-labeled probes specific for the myotonic disease subtype. Nuclei were labeled with Hoechst (blue). Magnified images are shown in the insets. Scale bar: 20 μm; 10 μm (inset). (B) DM1 iPSCs and iPSC-CMs had an increased number of RNA foci compared with healthy control cells (*P = 0.04, **P = 0.0008, respectively). DM2 iPSC-CMs had an increased number of RNA foci compared with healthy control cells (****P = 0.03), while iPSC cells trended toward significance when compared with control cells (P < 0.07). For both DM1 and DM2, differentiation of iPSCs into iPSC-CMs resulted in an increase number of RNA repeat foci in iPSC-CMs (***P = 0.008, *P = 0.04, respectively). The number of RNA foci did not change with differentiation in control cells (2-way ANOVA).
Figure 7
Figure 7. Myotonic dystrophy type 1 iPSC–derived cardiomyocytes are characterized by MBNL foci.
iPSC-derived cardiomyocytes were immunostained with an antibody to the splicing factor MBNL1 (green), and nuclei were labeled with Hoechst (blue). DM1 cardiomyocytes had readily detectable MBNL1-positive intranuclei foci (middle panel, white arrows) and reduced nucleoplasmic MBNL staining compared with control and DM2 cardiomyocytes. These findings support that MBNL1 sequestration characterizes DM1 but not DM2. Higher-magnification images of the white dotted boxes are shown on the right. Scale bar: 50 μm (left); 10 μm (right).
Figure 8
Figure 8. RNA foci tightly colocalized with MBNL1 clusters in DM1 cardiomyocytes.
(A and B) Using probes specific to the RNA repeat expansions, FISH was used to monitor RNA foci and their proximity to MBNL using total internal reflection fluorescence. The cells were colabeled with an antibody to MBNL1 (green). Control iPSC-CMs were labeled with a repeat probe for DM1 (CAG)5 in A and for DM2 (CAGG)10 in B. The distance between RNA foci and MBNL1 foci was quantified. Because MBNL1 foci were only readily detected in DM1 cardiomyocytes, the data from control and DM2 cells represent background signal. Thus, this method was used to measure the distance between RNA repeat expansions and MBNL1 in DM1. (A) RNA foci colocalized with MBNL1 foci in DM1 cardiomyocytes, and the distance between RNA foci and MBNL1 averaged 200 nm, consistent with a very close physical association between RNA repeat expansions and MBNL. Control cardiomyocytes displayed a random distribution of distances (top panel), reflecting the absence of RNA foci and MBNL foci. (B) In DM2 cardiomyocytes, there was no colocalization of RNA foci with MBNL foci, reflecting the absence of MBNL clusters and a pattern similar to cells from healthy controls. Correspondingly, the distances were randomly distributed, similar to control iPSC-CMs (similar distribution between top and bottom panels). Scale bar: 5 μm (left);1 μm (right).
Figure 9
Figure 9. RNA splicing profiles distinguish DM1- and DM2 iPSC–derived cardiomyocytes.
(A and B) RNA from iPSC-derived cardiomyocytes was isolated and used for RT-PCR to measure specific splicing events. The SCN5A and ANK3 transcripts revealed an increase in embryonic transcripts from DM1 cardiomyocytes compared with cardiomyocytes from healthy control and DM2 subjects. In DM1, specific splicing events in the RYR2 and TNNT2 transcripts were significantly different from healthy control cardiomyocytes, and variability was observed for DM2 cardiomyocytes. *P < 0.05, 1-way ANOVA. Each lane in A indicates a study subject. **P = 0.006.
Figure 10
Figure 10. Aberrant but distinct calcium transient patterns in DM1- and DM2 iPSC–derived cardiomyocytes.
iPSC-derived cardiomyocytes were labeled with Indo-1 and paced to monitor Ca2+ shifts within the cells. (A) Representative Ca2+ transient profiles from cardiomyocytes paced at 0.25 Hz derived from healthy control, DM1, and DM2 cardiomyocytes. (B) Average Ca2+ transients (paced at 0.25 Hz) from healthy control, DM1, and DM2 cardiomyocyte cell lines. (C) Diastolic Ca2+ was reduced in DM2 cardiomyocytes. (D) Peak Ca2+ transient amplitude, measured by the difference in peak and diastolic Ca2+, was not different across groups. (E and F) The peak rate of Ca2+ release (E) and the peak rate of Ca2+ reuptake (F) were significantly different in DM2 cardiomyocytes, consistent with altered release and reuptake kinetics compared with healthy control cardiomyocytes. (G–I) Times to peak Ca2+ (G), 50% Ca2+ release (H), and 50% Ca2+ reuptake (I) differed between DM subtypes and healthy control cardiomyocyte cells. Control, 2 cell lines, 33 cell patches; DM1, 2 cell lines, 40 cell patches; DM2, 4 cell lines, 78 cell patches. *P < 0.05, **P < 0.01, ***P < 0.001, ****P < 0.0001, 1-way ANOVA tested at each frequency.

References

    1. Thornton CA. Myotonic dystrophy. Neurol Clin. 2014;32(3):705–719. - PMC - PubMed
    1. Meola G, Cardani R. Myotonic dystrophy type 2 and modifier genes: an update on clinical and pathomolecular aspects. Neurol Sci. 2017;38(4):535–546. doi: 10.1007/s10072-016-2805-5. - DOI - PubMed
    1. Udd B, Krahe R. The myotonic dystrophies: molecular, clinical, and therapeutic challenges. Lancet Neurol. 2012;11(10):891–905. doi: 10.1016/S1474-4422(12)70204-1. - DOI - PubMed
    1. Brook JD, et al. Radiation-reduced hybrids for the myotonic dystrophy locus. Genomics. 1992;13(2):243–250. doi: 10.1016/0888-7543(92)90238-N. - DOI - PubMed
    1. Mahadevan M, et al. Myotonic dystrophy mutation: an unstable CTG repeat in the 3′ untranslated region of the gene. Science. 1992;255(5049):1253–1255. doi: 10.1126/science.1546325. - DOI - PubMed

Publication types

MeSH terms