. 2019 Feb 7;14(2):e0211119.
doi: 10.1371/journal.pone.0211119. eCollection 2019.

Faecal biomarkers can distinguish specific mammalian species in modern and past environments

Affiliations

Faecal biomarkers can distinguish specific mammalian species in modern and past environments

Loïc Harrault et al. PLoS One. .

Abstract

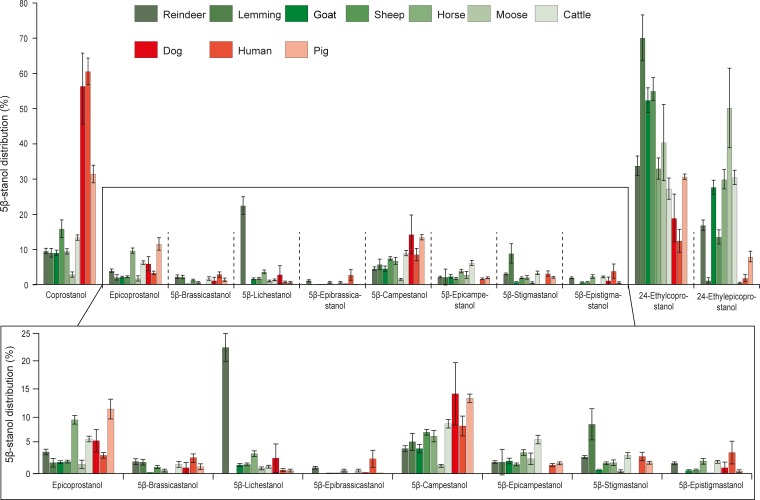
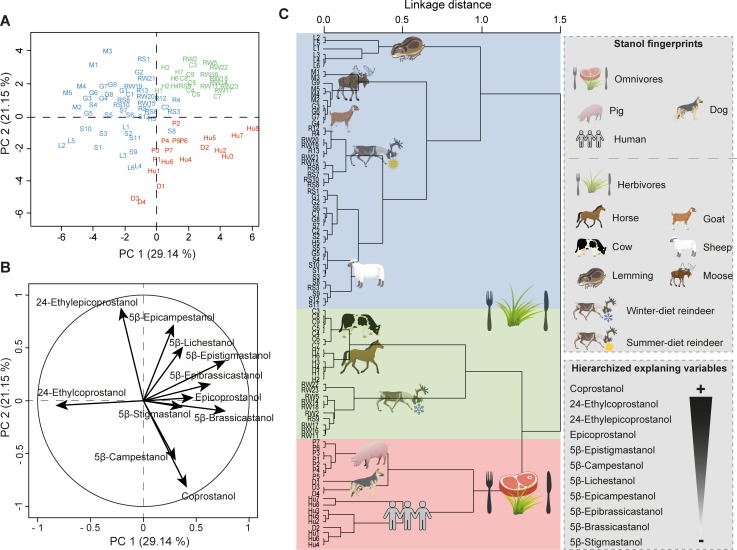
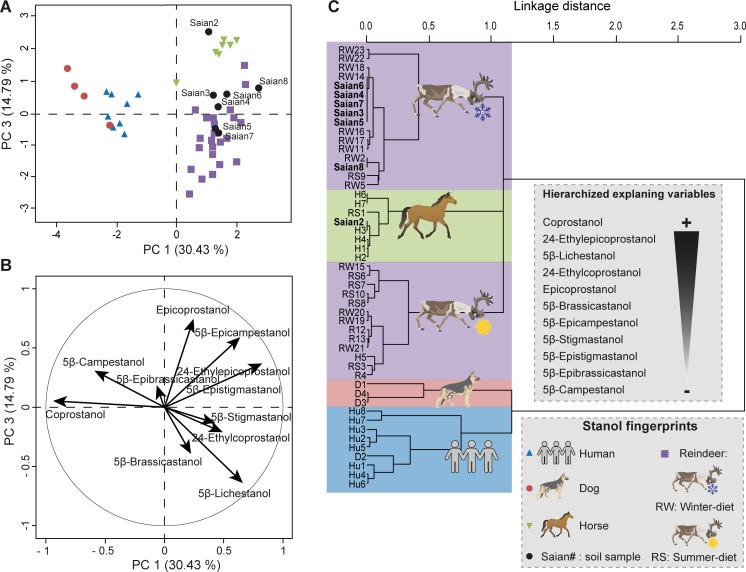
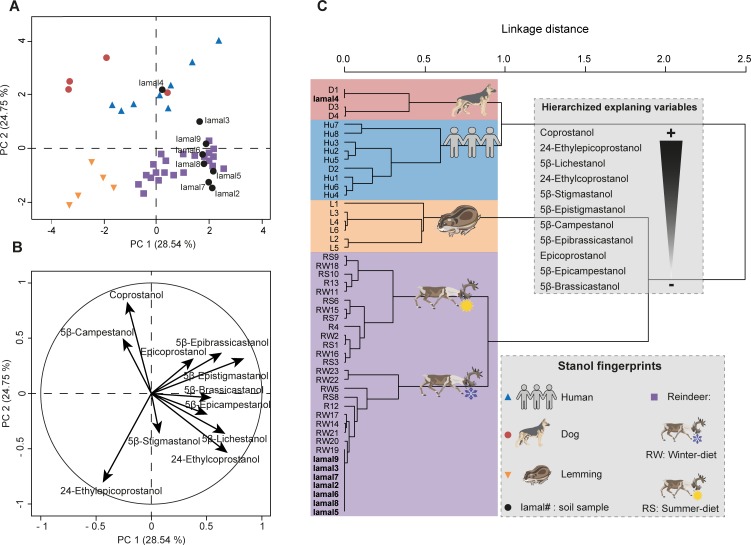
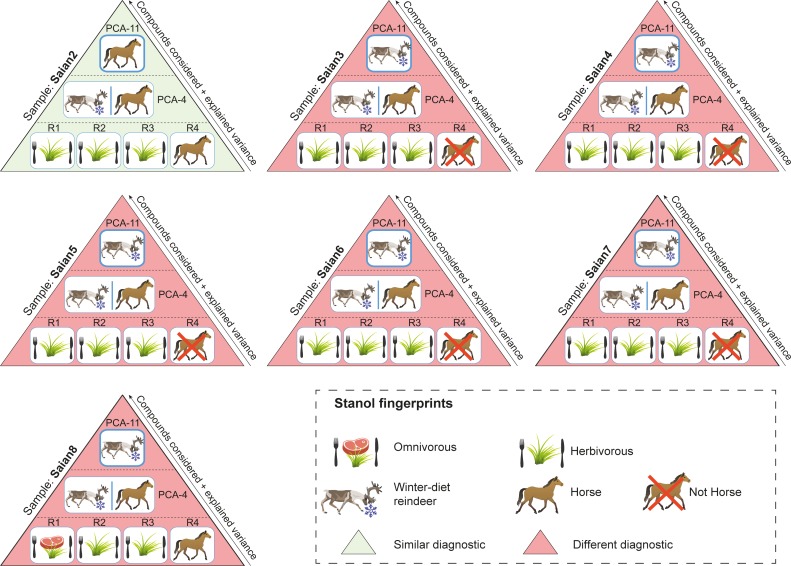
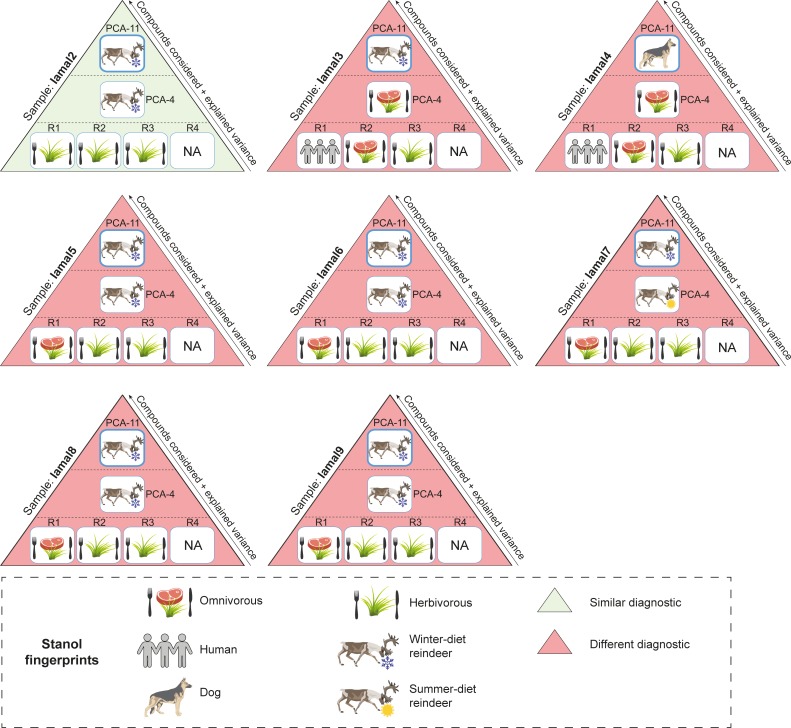
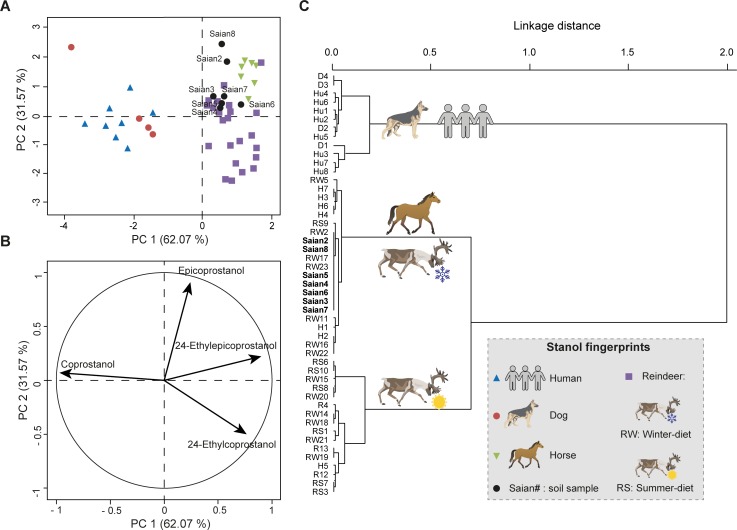
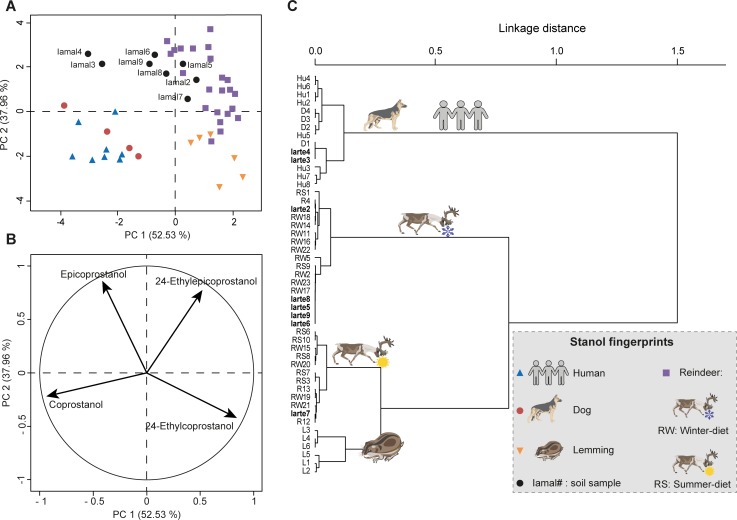
Identifying the presence of animals based on faecal deposits in modern and ancient environments is of primary importance to archaeologists, ecologists, forensic scientists, and watershed managers, but it has proven difficult to distinguish faecal material to the species level. Until now, four 5β-stanols have been deployed as faecal biomarkers to distinguish between omnivores and herbivores, but they cannot distinguish between species. Here we present a database of faecal signatures from ten omnivore and herbivore species based on eleven 5β-stanol compounds, which enables us to distinguish for the first time the faecal signatures of a wide range of animals. We validated this fingerprinting method by testing it on modern and ancient soil samples containing known faecal inputs and successfully distinguished the signatures of different omnivores and herbivores.


Conflict of interest statement

The authors have declared that no competing interests exist.

Figures

Fig 1
Fig 1. Distributions of 5β-stanols in herbivore and omnivore faecal material.
Compound information can be found in S1 Table and S2 Fig. Mean ± SE. Individuals: n(reindeer) = 23, n(lemming) = 6, n(goat) = 9, n(sheep) = 12, n(horse) = 7, n(moose) = 5, n(cattle) = 9, n(dog) = 4, n(human) = 8, n(pig) = 7. Individual sample information and 5β-stanol distributions can be found in S2 Table.
Fig 2
Fig 2. Mammal fingerprints.
(A) PCA score plot of 5β-stanol distributions in reindeer (R), lemming (L), goat (G), sheep (S), horse (H), moose (M), cattle (C), pig (P), dog (D) and human (Hu) faecal samples. Colours represent the main clusters obtained by HCPC (C). PC 1 and PC 2 represent respectively principal components 1 and 2; numbers in brackets show the variance explained by each PC. (B) PCA correlation circle. (C) HCPC dendrogram of all species fingerprints built on PCs from the PCA. The main variables/compounds responsible for the distinction between the main clusters are hierarchized (from the more important + to the less import -) according to S4 Table. More details of the PCA/HCPC models can be found in S4 Table and sample information is in S2 Table.
Fig 3
Fig 3. Identification of soil faecal fingerprints from the contemporary Tofa (Sai͡an Mountains) camp by multivariate analyses on eleven 5β-stanol distributions.
(A) PCA score plot of 5β-stanol distributions from the reference library of faeces of dogs, horses, humans and reindeer, together with soil samples from the site. PC 1 and PC 3 represent principal components 1 and 3 respectively. The numbers in brackets show the variance explained by each PC. (B) PCA correlation circle. (C) HCPC dendrogram of dog (D), horse (H), human (Hu), reindeer (R) and soil sample (Saian) fingerprints. The main variables/compounds responsible for the distinction between the main clusters are hierarchized (from the more important + to the less import -) according to S5 Table. More details of the PCA/HCPC models can be found in S5 Table and sample information is in S2 Table.
Fig 4
Fig 4. Identification of soil faecal fingerprints from the archaeological site of I͡Arte VI by multivariate analyses on eleven 5β-stanol distributions.
(A) PCA score plot of 5β-stanol distributions from the reference library of faeces of dogs, lemmings, humans and reindeer, together with the 5β-stanol distributions in the soil samples. PC1 and PC2 represent respectively principal components 1 and 2. The numbers in brackets show the variance explained by each PC. (B) PCA correlation circle. (C) HCPC dendrogram of dog (D), lemming (L), human (Hu), reindeer (R) and soil sample (Iamal) fingerprints. The main variables/compounds responsible for the distinction between the main clusters are hierarchized (from the more important + to the less import -) according to S6 Table. More details of the PCA/HCPC models can be found in S6 Table and sample information is in S2 Table.
Fig 5
Fig 5. Summary comparison of diet and species identification using ratios and multivariate analyses for soil samples taken from the Tofa site (Sai͡an Mountains).
More details are presented in S7 Table. R1 refers to the ratio of distributions of coprostanol/(coprostanol + 24-ethylcoprostanol) used to discriminate the herbivore fingerprint from human (herbivore = 0.38 < R1 < 0.73 = human, [20]). R2 refers to the ratio of distributions of (coprostanol + epicoprostanol)/(24-ethylcoprostanol + 24-ethylepicoprostanol) used to identify the omnivore fingerprint (R2 > 1, [7]). R3 refers to the ratio of distributions of epicoprostanol/(cholestanol + coprostanol) used to discriminate the herbivore fingerprint from human (human = 0.01 < R3 < 0.1 = cattle and horse, [21]). R4 refers to the ratio of distributions of (24-ethylepicoprostanol/24-ethylcoprostanol) + (epicoprostanol/coprostanol) used to discriminate the horse fingerprint from other herbivores (No horse = 0.8 < R4 < 1.2 = horse, [10]). PCA-4 refers to the predictive PCA and its corresponding HCPC built with the distribution of the four main 5β-stanols (coprostanol, epicoprostanol, 24-ethylcoprostanol and 24-ethylepicoprostanol) in the human, dog, horse and reindeer reference samples from our database. PCA-11 refers to the predictive PCA and its corresponding HCPC built with the distribution of eleven 5β-stanols in the human, dog, horse and reindeer reference samples from our database. Reindeer and horses are herbivores so diagnostics between ratios and multivariate analyses can be compared.
Fig 6
Fig 6. Summary comparison of diet and species identification using ratios and multivariate analyses for I͡Amal soil samples.
More details are presented in S7 Table. R1 refers to the ratio of distributions of coprostanol/(coprostanol + 24-ethylcoprostanol) used to discriminate the herbivore fingerprint from human (herbivore = 0.38 < R1 < 0.73 = human, [20]). R2 refers to the ratio of distributions of (coprostanol + epicoprostanol)/(24-ethylcoprostanol + 24-ethylepicoprostanol) used to identify the omnivore fingerprint (R2 > 1, [7]). R3 refers to the ratio of distributions of epicoprostanol/(cholestanol + coprostanol) used to discriminate the herbivore fingerprint from human (human = 0.01 < R3 < 0.1 = cattle and horse, [21]). R4, the diagnostic ratio for the horse fingerprint, is “not applicable” (NA) because no horses were present on this high Arctic site (see Text). PCA-4 refers to the predictive PCA and its corresponding HCPC built with the distribution of the four main 5β-stanols (coprostanol, epicoprostanol, 24-ethylcoprostanol and 24-ethylepicoprostanol) in the human, dog, lemming and reindeer reference samples from our database. PCA-11 refers to the predictive PCA and its corresponding HCPC built with the distribution of eleven 5β-stanols in the human, dog, lemming and reindeer reference samples from our database. Reindeer and horses are herbivores so diagnostics between ratios and multivariate analyses can be compared.
Fig 7
Fig 7. Multivariate analyses to identify the faecal fingerprints of soil samples from the Tofa site (Sai͡an Mountains) based on only the four compounds commonly used in the literature: coprostanol, epicoprostanol, 24-ethylcoprostanol and 24-ethylepicoprostanol.
PCA and HCPC of the four main 5β-stanols distribution (arcsine-root transformed) of reference faecal material from dog (D), horse (H), human (Hu) and reindeer (R) and soil samples (Saian). Reference and soil samples nomenclature can be found in S2 Table. (A) PCA score plot of PC1 and PC2. The high variance explained by the first two PCs is due to the low number of variables (four). (B) PCA correlation circle of PC1 and PC2. (C) Dendrogram obtained by HCPC from the first two PCs of the PCA.
Fig 8
Fig 8. Multivariate analyses to identify the faecal fingerprints of soil samples from the I͡Amal peninsula site based on only the four compounds commonly used in the literature: coprostanol, epicoprostanol, 24-ethylcoprostanol and 24-ethylepicoprostanol.
PCA and HCPC of the four main 5β-stanol distribution (arcsine-root transformed) of reference faecal material from dog (D), human (Hu), lemming (L) and reindeer (R) and soil samples. Reference and soil sample nomenclature can be found in S2 Table. (A) PCA score plot of PC1 and PC2. The high variance explained by the first two PCs is due to the low number of variables (four). (B) PCA correlation circle of PC1 and PC2. (C) Dendrogram obtained by HCPC calculated from the first two PCs of the PCA.

References

    1. Bethell PH, Goad LJ, Evershed RP, Ottaway J. The study of molecular markers of human activity: the use of coprostanol in the soil as an indicator of human faecal material. J Archaeol Sci. 1994;21: 619–632. 10.1006/jasc.1994.1061 - DOI
    1. Evershed RP, Bethell PH, Reynolds PJ, Walsh NJ. 5β-Stigmastanol and related 5β-stanols as biomarkers of manuring: analysis of modern experimental material and assessment of the archaeological potential. J Archaeol Sci. 1997;24: 485–495. 10.1006/jasc.1996.0132 - DOI
    1. Bull ID, Elhmmali MM, Roberts DJ, Evershed RP. The application of steroidal biomarkers to track the abandonment of a Roman wastewater course at the Agora (Athens, Greece). Archaeometry. 2003;45: 149–161. 10.1111/1475-4754.00101 - DOI
    1. Shah VG, Dunstan RH, Geary PM, Coombes P, Roberts TK, Von Nagy-Felsobuki E. Evaluating potential applications of faecal sterols in distinguishing sources of faecal contamination from mixed faecal samples. Water Res. 2007;41: 3691–700. 10.1016/j.watres.2007.04.006 - DOI - PubMed
    1. Evershed RP. Organic residue analysis in archaeology: the archaeological biomarker revolution. Archaeometry. 2008;50: 895–924. 10.1111/j.1475-4754.2008.00446.x - DOI

Publication types