. 2019 Mar 26;58(14):4659-4663.
doi: 10.1002/anie.201900850. Epub 2019 Feb 28.

Organelle-Targeted BODIPY Photocages: Visible-Light-Mediated Subcellular Photorelease

Affiliations

Organelle-Targeted BODIPY Photocages: Visible-Light-Mediated Subcellular Photorelease

Dnyaneshwar Kand et al. Angew Chem Int Ed Engl. .

Abstract

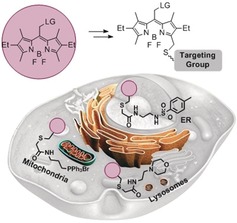
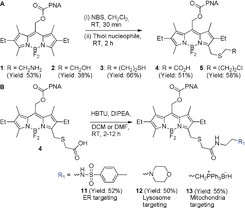
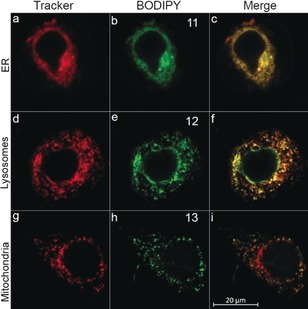
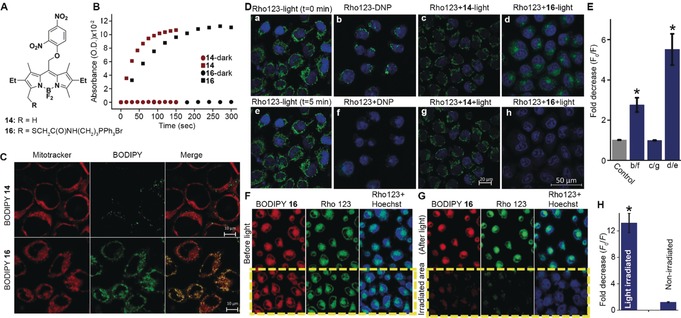
Photocaging facilitates non-invasive and precise spatio-temporal control over the release of biologically relevant small- and macro-molecules using light. However, sub-cellular organelles are dispersed in cells in a manner that renders selective light-irradiation of a complete organelle impractical. Organelle-specific photocages could provide a powerful method for releasing bioactive molecules in sub-cellular locations. Herein, we report a general post-synthetic method for the chemical functionalization and further conjugation of meso-methyl BODIPY photocages and the synthesis of endoplasmic reticulum (ER)-, lysosome-, and mitochondria-targeted derivatives. We also demonstrate that 2,4-dinitrophenol, a mitochondrial uncoupler, and puromycin, a protein biosynthesis inhibitor, can be selectively photoreleased in mitochondria and ER, respectively, in live cells by using visible light. Additionally, photocaging is shown to lead to higher efficacy of the released molecules, probably owing to a localized and abrupt release.

Keywords: BODIPY; mitochondria; organelles; photo-release; photocages.


Conflict of interest statement

The authors declare no conflict of interest.

Figures

Figure 1
Figure 1
Schematic of ER‐, lysosome‐, and mitochondria‐targeted BODIPY photocages.
Figure 2
Figure 2
A) Synthetic scheme of compounds 15. B) Synthetic scheme of organelle‐targeting compounds 1113.
Figure 3
Figure 3
Cellular distribution and co‐localization of compounds 1113. Confocal fluorescence images of live HeLa cells incubated with a–c) ER‐Tracker Blue (2 μm) and 11 (10 μm, 30 min), d–f) LysoTracker deep‐red (2 μm) and 12 (10 μm, 30 min), g–i) MitoTracker deep‐red (2 μm), and 13 (10 μm, 30 min). Co‐localization appears as yellow/orange (c), (f), (i).
Figure 4
Figure 4
A) Structures of compounds 14 and 16. B) Light‐mediated release of DNP from 14 and 16 (10 μm, ACN/water 7:3) following light irradiation (545/30 nm, 42 mW cm−2) for the indicated times. Absorbance at 367 nm (representing free DNP) vs. time was plotted. C) Distribution and co‐localization of 14 and 16. Confocal images of live HeLa cells treated with Hoechst 33342 (17 μm), MitoTracker deep‐red (2 μm) and 14 (upper) or 16 (lower) (10 μm, 30 min). Areas of co‐localization appear in yellow/orange in Merged. D) Photorelease of DNP in live cells leads to decrease in mitochondrial membrane potential. Confocal images of live HeLa cells stained with Hoechst 33342 (17 μm) and Rhod123 (26 μm, 15 min), a,e) in the absence of light at t=0 and 5 min; b,f)  before and after treatment with 200 μm DNP; c,g)  compound 14 (25 μm) with and without light (545/25 nm, 1.4 mW cm−2, 15 s); d,h)  compound 16 (25 μm) with and without light (545/25 nm, 1.4 mW cm−2, 15 s). E) Decrease in cells fluorescence intensity, where F 0 is fluorescence intensity before either light or DNP treatment and F is fluorescence intensity after either light or DNP treatment. F,G) Localized photoactivation of DNP in live cells. HeLa cells were incubated with Rho123 (26 μm), 16 (25 μm), and Hoechst 33342 (17 μm) for 15 min before (F) and after (G) light irradiation (545/25 nm, 1.4 mW cm−2, 15 s) of a selected region. H) Fold‐decrease in fluorescence intensity of cells in irradiated and non‐irradiated regions, where F 0 and F are defined as in (E). * Statistical significance (one‐way ANOVA with Tukey correction, p<0.05) from control (E) or non‐irradiated cells (H). Error bars show the standard error (SE).

References

    1. None
    1. Maly D. J., Papa F. R., Nat. Chem. Biol. 2014, 10, 892–901; - PMC - PubMed
    1. Piao S., Amaravadi R. K., Ann. N. Y. Acad. Sci. 2016, 1371, 45–54; - PMC - PubMed
    1. Sakhrani N. M., Padh H., Drug Des. Dev. Ther. 2013, 7, 585–599; - PMC - PubMed
    1. Weinberg S. E., Chandel N. S., Nat. Chem. Biol. 2015, 11, 9–15. - PMC - PubMed

Publication types

Substances

LinkOut - more resources