. 2019 May 1:191:49-67.
doi: 10.1016/j.neuroimage.2019.01.051. Epub 2019 Feb 5.

Performance of semi-automated hippocampal subfield segmentation methods across ages in a pediatric sample

Affiliations

Performance of semi-automated hippocampal subfield segmentation methods across ages in a pediatric sample

Margaret L Schlichting et al. Neuroimage. .

Abstract

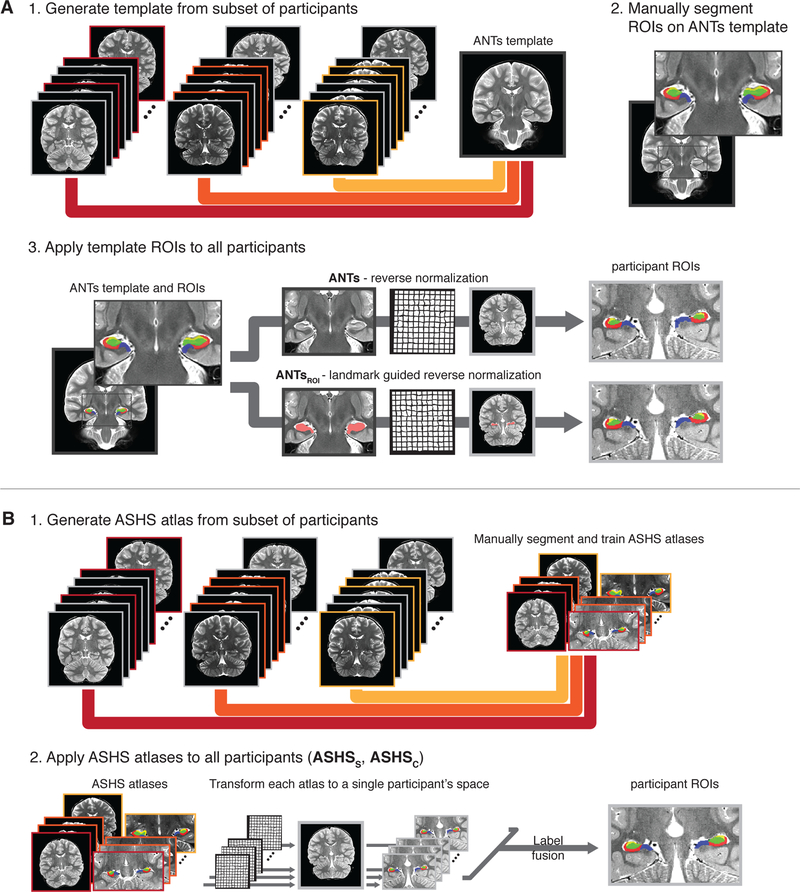
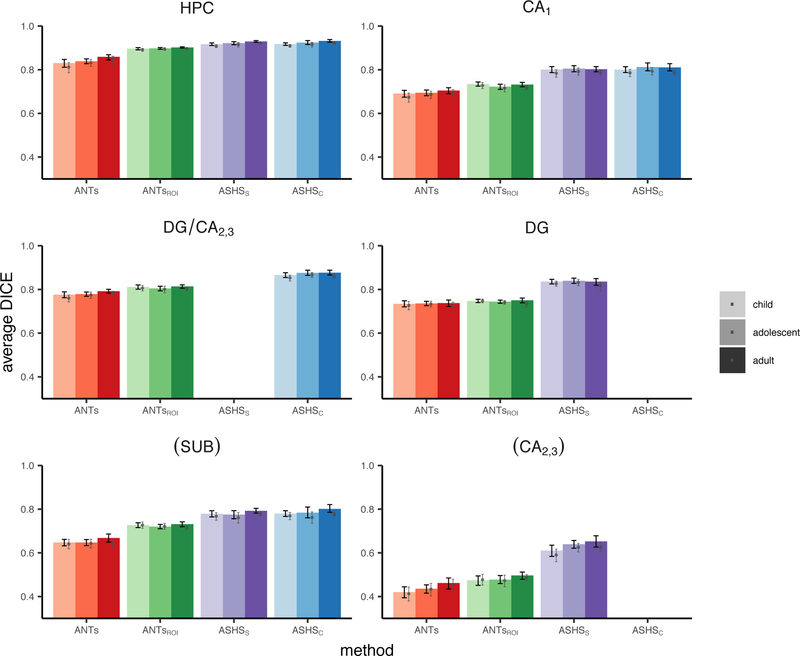
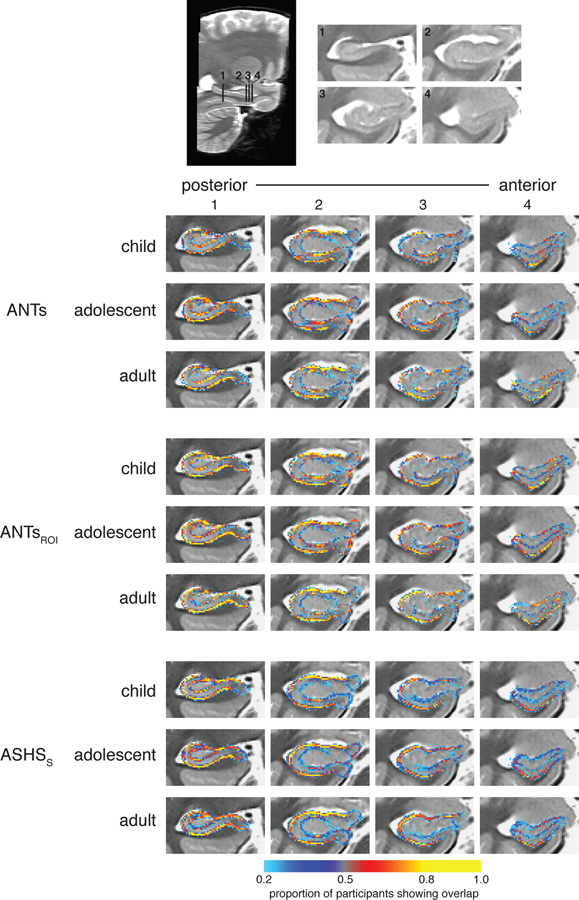
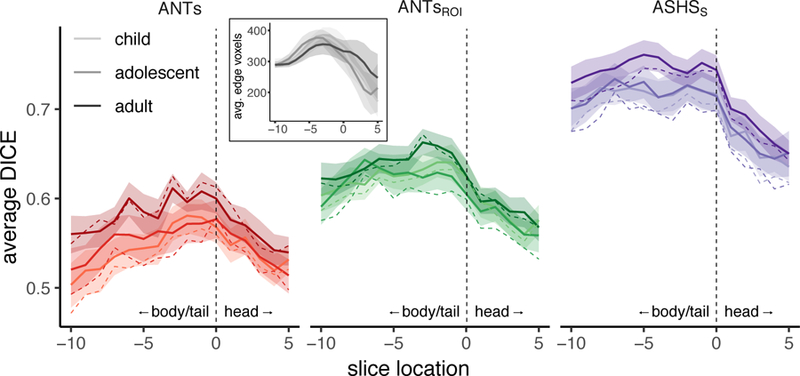
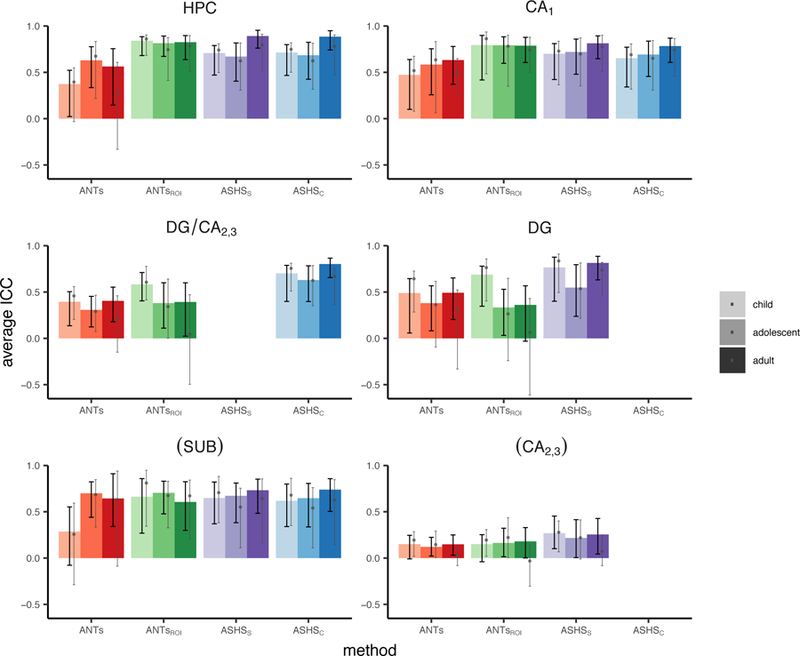
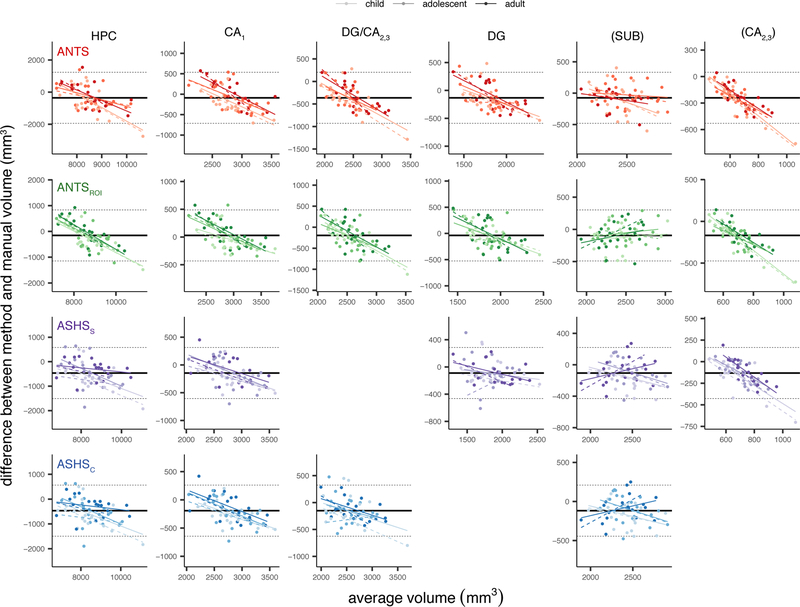
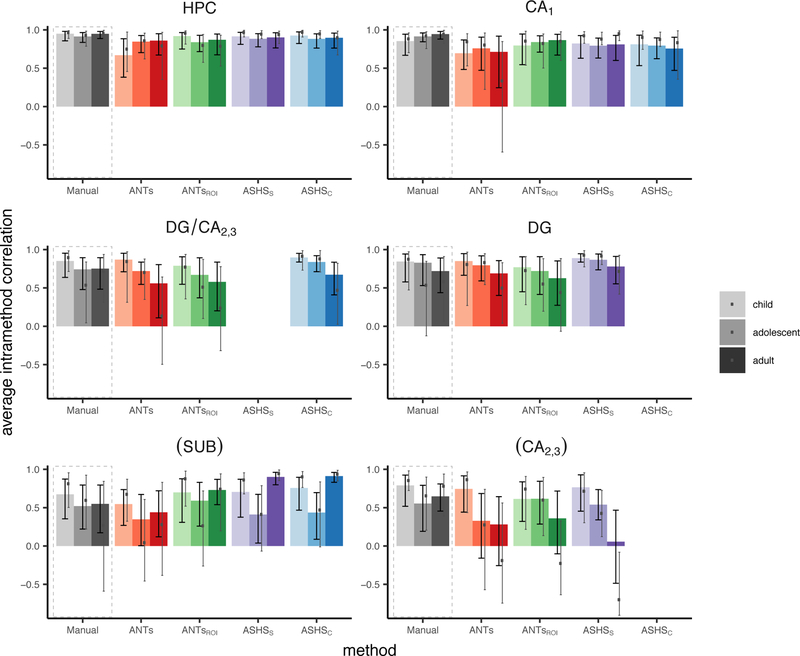
Episodic memory function has been shown to depend critically on the hippocampus. This region is made up of a number of subfields, which differ in both cytoarchitectural features and functional roles in the mature brain. Recent neuroimaging work in children and adolescents has suggested that these regions may undergo different developmental trajectories-a fact that has important implications for how we think about learning and memory processes in these populations. Despite the growing research interest in hippocampal structure and function at the subfield level in healthy young adults, comparatively fewer studies have been carried out looking at subfield development. One barrier to studying these questions has been that manual segmentation of hippocampal subfields-considered by many to be the best available approach for defining these regions-is laborious and can be infeasible for large cross-sectional or longitudinal studies of cognitive development. Moreover, manual segmentation requires some subjectivity and is not impervious to bias or error. In a developmental sample of individuals spanning 6-30 years, we assessed the degree to which two semi-automated segmentation approaches-one approach based on Automated Segmentation of Hippocampal Subfields (ASHS) and another utilizing Advanced Normalization Tools (ANTs)-approximated manual subfield delineation on each individual by a single expert rater. Our main question was whether performance varied as a function of age group. Across several quantitative metrics, we found negligible differences in subfield validity across the child, adolescent, and adult age groups, suggesting that these methods can be reliably applied to developmental studies. We conclude that ASHS outperforms ANTs overall and is thus preferable for analyses carried out in individual subject space. However, we underscore that ANTs is also acceptable and may be well-suited for analyses requiring normalization to a single group template (e.g., voxelwise analyses across a wide age range). Previous work has supported the use of such methods in healthy young adults, as well as several special populations such as older adults and those suffering from mild cognitive impairment. Our results extend these previous findings to show that ASHS and ANTs can also be used in pediatric populations as young as six.

Keywords: Development; High-resolution MRI; Reliability; Structural MRI; Volume.


Conflict of interest statement

The authors declare no competing financial interests.

Figures

Figure 1.
Figure 1.
Schematic depiction of methods compared. A) ANTs segmentation methods. 1. Subsets of participants were selected from the three age groups to generate a single ANTs template. 2. Then, hippocampal subfield ROIs were manually delineated on the ANTs template. 3. Finally, the ANTs template ROIs were reverse normalized to each participant’s native space. For the ANTs method (top path), a nonlinear warp was estimated based uniformly on the entire ANTs template and participant anatomical volumes. For the ANTsROI method (bottom path), the nonlinear warp was estimated through landmark matching of the whole hippocampus. For the main analysis, both ANTs-based methods were performed for all participants to create two sets of participant-specific subfield ROIs. B) ASHS segmentation methods. 1. Subsets of participants from the three age groups were selected for training custom ASHS atlases. The ASHS training procedure was run using the manually delineated subfield segmentations for the atlas participants. 2. Then, the ASHS atlases were applied to all participants. Briefly, the ROIs from each atlas participant were all nonlinearly warped to a single participant. Then, a label fusion procedure combined the transformed atlas segmentations to generate final, participant-specific ROIs. In the main analysis, atlas participants’ own segmentations were excluded from the label fusion procedure to reduce bias in their final segmentation. The whole procedure was performed twice: once with DG and CA2,3 separated (ASHSS), and once with them combined (ASHSC). Figure depicts the main analysis including all participants; we additionally performed follow-up analysis omitting participants who went into the generation of the ANTs template or ASHS atlas.
Figure 2.
Figure 2.
Spatial overlap of each method with Manual ROIs measured using DSC. Black error bars represent 95% confidence intervals on the main analysis. Grey dots and corresponding error bars represent means and 95% confidence intervals, respectively, for analysis omitting all N=27 participants who went into the generation of the ANTs template or ASHS atlases. Parentheses around SUB and CA2,3 indicate that these regions fell below our intra-rater reliability threshold (ICC(2,1)<0.80) and thus we do not consider them in the text. Data correspond with Table 1.
Figure 3.
Figure 3.
Voxelwise edge agreement displayed on a custom template separately for children, adolescents, and adults. Intensities represent the proportion of participants for which the method and Manual agreed that the voxel was a subfield boundary.
Figure 4.
Figure 4.
DSC edge overlap as a function of position along the anterior-posterior axis. Spatial overlap of edge maps for ANTs, ANTsROI, and ASHSS with Manual ROIs for each age group within left (top) and right (bottom) HPC. Lines represent group means; shaded regions represent 95% confidence intervals. Each participant’s hippocampus was centered on the slice dividing the head from the body, represented at zero with a dashed vertical line. Positive values along the x-axis (to the right of the dashed line) are in the HPC head; negative values (left) are in the remainder of HPC (a combined body/tail region). Overlap generally tracked with number of voxels going into the analysis (inset), which also varies as a function of anterior-posterior slice.
Figure 5.
Figure 5.
Volume correspondence of each method with Manual ROIs measured using ICC. Black error bars represent 95% confidence intervals on the main analysis. Grey dots and corresponding error bars represent means and 95% confidence intervals, respectively, for analysis omitting all N=27 participants who went into the generation of the ANTs template or ASHS atlases. Parentheses around SUB and CA2,3 indicate that these regions fell below our intra-rater reliability threshold (ICC(2,1)<0.80) and thus we do not consider them in the text. Data correspond with Table 2.
Figure 6.
Figure 6.
Bland-Altman plots comparing each automated method with Manual. Rows correspond with results from different automated methods, columns correspond with data from different ROIs. Within each plot, x-axis represents the mean regional volume across the two methods; y-axis represents the difference (method-Manual). Solid black line indicates the mean difference across all age groups; dashed lines are 2 standard deviations above and below the mean. Regression lines are displayed for each age group separately (dashed lines represent regression lines excluding atlas subjects). Parentheses around SUB and CA2,3 indicate that these regions fell below our intra-rater reliability threshold (ICC(2,1)<0.80) and thus we do not consider them in the text. ANCOVA statistics are provided in Table 3.
Figure 7.
Figure 7.
Within-method reliability assessed using IHC. Bar height represents the Pearson’s r value between the left and right hemisphere volumes for each group separately; black error bars represent 95% confidence intervals on the main analysis. Grey dots and corresponding error bars represent means and 95% confidence intervals, respectively, for analysis omitting all N=27 participants who went into the generation of the ANTs template or ASHS atlases. Parentheses around SUB and CA2,3 indicate that these regions fell below our intra-rater reliability threshold (ICC(2,1)<0.80) and thus we do not consider them in the text. Data correspond with Table 4.

Similar articles

Cited by

References

    1. Achenbach TM, 1991. Manual for the Child Behavior Checklist/4–18 and 1991 profile Department of Psychiatry, University of Vermont, Burlington, VT.
    1. Addis DR, Cheng T, Roberts RP, Schacter DL, 2011. Hippocampal contributions to the episodic simulation of specific and general future events. Hippocampus 21, 1045–52. 10.1002/hipo.20870 - DOI - PMC - PubMed
    1. Allen JS, Damasio H, Grabowski TJ, 2002. Normal neuroanatomical variation in the human brain: An MRI-volumetric study. Am. J. Phys. Anthropol 118, 341–358. 10.1002/ajpa.10092 - DOI - PubMed
    1. Avants BB, Tustison NJ, Song G, Cook PA, Klein A, Gee JC, 2011. A reproducible evaluation of ANTs similarity metric performance in brain image registration. Neuroimage 54, 2033–44. 10.1016/j.neuroimage.2010.09.025 - DOI - PMC - PubMed
    1. Behrmann M, Plaut DC, 2015. A vision of graded hemispheric specialization. Ann. N. Y. Acad. Sci 1359, 30–46. 10.1111/nyas.12833 - DOI - PubMed

Publication types