. 2019 Apr 12;124(8):1228-1239.
doi: 10.1161/CIRCRESAHA.118.314600.

Measurement of Myofilament-Localized Calcium Dynamics in Adult Cardiomyocytes and the Effect of Hypertrophic Cardiomyopathy Mutations

Affiliations

Measurement of Myofilament-Localized Calcium Dynamics in Adult Cardiomyocytes and the Effect of Hypertrophic Cardiomyopathy Mutations

Alexander J Sparrow et al. Circ Res. .

Abstract

Rationale: Subcellular Ca2+ indicators have yet to be developed for the myofilament where disease mutation or small molecules may alter contractility through myofilament Ca2+ sensitivity. Here, we develop and characterize genetically encoded Ca2+ indicators restricted to the myofilament to directly visualize Ca2+ changes in the sarcomere.

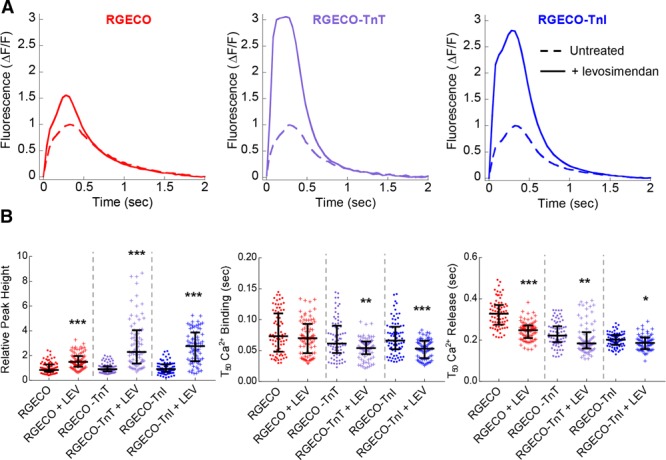
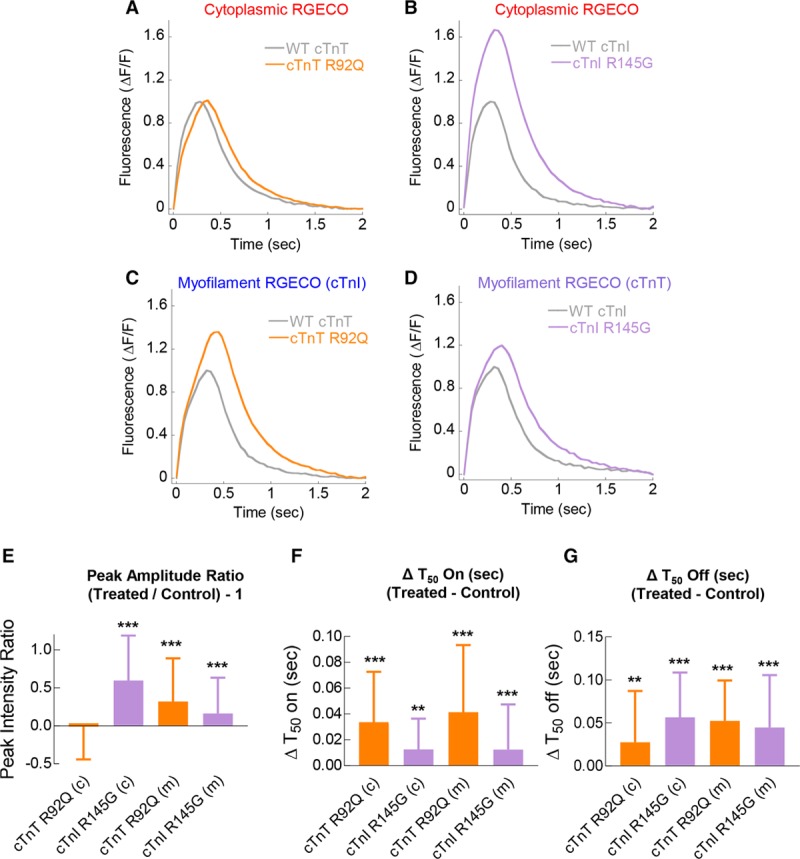
Objective: To produce and validate myofilament-restricted Ca2+ imaging probes in an adenoviral transduction adult cardiomyocyte model using drugs that alter myofilament function (MYK-461, omecamtiv mecarbil, and levosimendan) or following cotransduction of 2 established hypertrophic cardiomyopathy disease-causing mutants (cTnT [Troponin T] R92Q and cTnI [Troponin I] R145G) that alter myofilament Ca2+ handling.

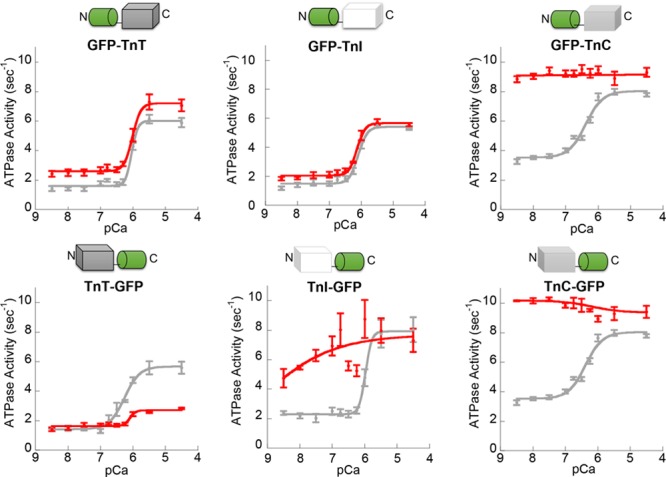
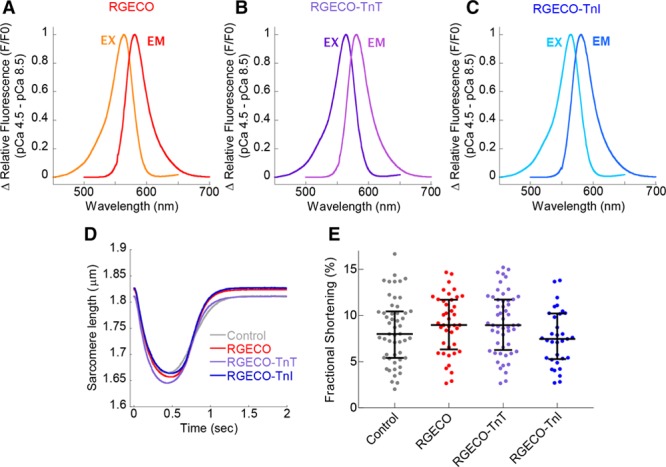
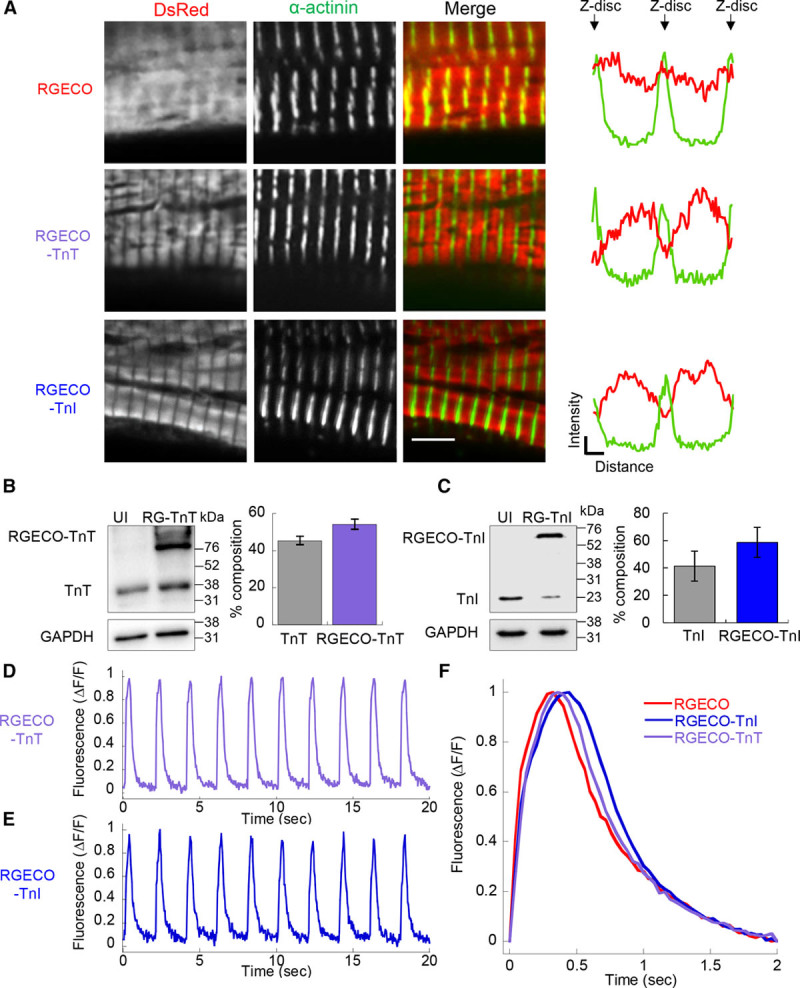
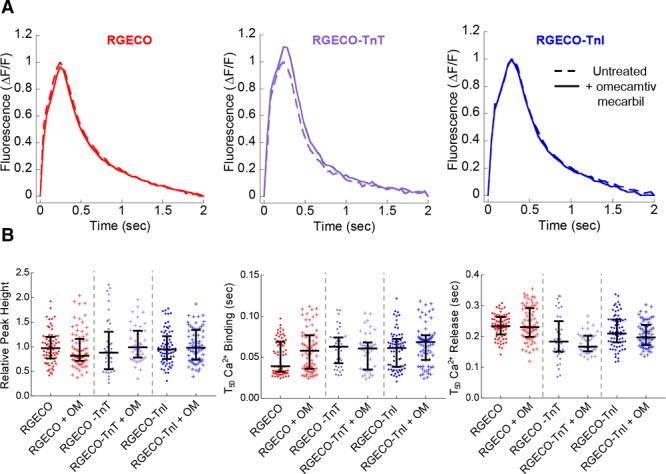
Methods and results: When expressed in adult ventricular cardiomyocytes RGECO-TnT (Troponin T)/TnI (Troponin I) sensors localize correctly to the sarcomere without contractile impairment. Both sensors report cyclical changes in fluorescence in paced cardiomyocytes with reduced Ca2+ on and increased Ca2+ off rates compared with unconjugated RGECO. RGECO-TnT/TnI revealed changes to localized Ca2+ handling conferred by MYK-461 and levosimendan, including an increase in Ca2+ binding rates with both levosimendan and MYK-461 not detected by an unrestricted protein sensor. Coadenoviral transduction of RGECO-TnT/TnI with hypertrophic cardiomyopathy causing thin filament mutants showed that the mutations increase myofilament [Ca2+] in systole, lengthen time to peak systolic [Ca2+], and delay [Ca2+] release. This contrasts with the effect of the same mutations on cytoplasmic Ca2+, when measured using unrestricted RGECO where changes to peak systolic Ca2+ are inconsistent between the 2 mutations. These data contrast with previous findings using chemical dyes that show no alteration of [Ca2+] transient amplitude or time to peak Ca2+.

Conclusions: RGECO-TnT/TnI are functionally equivalent. They visualize Ca2+ within the myofilament and reveal unrecognized aspects of small molecule and disease-associated mutations in living cells.

Keywords: calcium; cardiomyopathies; fluorescence; mutation; sarcomere.


Figures

Figure 1.
Figure 1.
The effect of GFP (green fluorescent protein) conjugation to the N and C terminus of troponin subunits on myofilament function. Myofilament function was assessed using in vitro actin-activated actomyosin S1 ATPase assays. Control (unconjugated) troponin complexes (gray lines) were compared pairwise to troponin complex reconstituted with subunits conjugated to the N or the C terminus of GFP as illustrated (red lines). n=3–5 error bars are±SEM. TnC indicates Troponin C; TnI, Troponin I; and TnT, Troponin T.
Figure 2.
Figure 2.
Fluorescent and contractile properties of RGECO, RGECO-TnT (Troponin T), and RGECO-TnI (Troponin I). Steady-state fluorescence excitation, emission spectra (peak excitation [Ex] =564 nm)/peak emission (Em) =581 nm) were obtained at pCa4.5 and subtracted from paired spectra at pCa8.5 for purified recombinant RGECO (A), RGECO-TnT (B), and RGECO-TnI (C). Sarcomere shortening during electrical pacing (0.5 Hz) of isolated adult cardiomyocytes was used to test cardiac contractile function in nontransduced and either RGECO, RGECO-TnT, or RGECO-TnI transduced Guinea pig cardiomyocytes (GPCMs) by measurement of the sarcomeric length during contraction (n=33–52; D) or by fractional shortening (E).
Figure 3.
Figure 3.
Characterization of RGECO, RGECO-TnT (Troponin T), and RGECO-TnI (Troponin I) in Guinea pig cardiomyocytes (GPCMs). Adenovirally expressed RGECO-TnT and RGECO-TnI (red in the merged images) localizes to the I band in confocal microscopy of GPCMs, while RGECO shows diffuse staining (n=4; A); Z-disks are revealed by α-actinin staining (green in the merged images). Scale bar =5 μm. Intensity profile plots spanning 2 sarcomeres, α-actinin (green line) labels the z-disc, DsRed (red) labels the Ca2+ sensors. Western blot analysis of GPCMs transduced with RGECO-TnT (B) or RGECO-TnI (C) indicates that 54.3±5.5% (n=5)/58.7±11.0% (n=4), respectively, of Troponin is composed of RGECO conjugated Troponin. Raw Ca2+ transients of paced GPCMs transduced with RGECO-TnT (D) or RGECO-TnI (E). Averaged Ca2+ transients of 0.5 Hz paced GPCMs transduced with RGECO, RGECO-TnT, or RGECO-TnI (F) was used to compare Ca2+ transients between cytoplasmic RGECO and myofilament specific RGECO-TnT and RGECO-TnI.
Figure 4.
Figure 4.
The effects of MYK-461 on Ca2+ transient measurements in Guinea pig cardiomyocytes (GPCMs) with RGECO, RGECO-TnT (Troponin T), or RGECO-TnI (Troponin I). Averaged Ca2+ transients of 0.5 Hz paced GPCMs transduced with RGECO, RGECO-TnT, or RGECO-TnI were used to compare the effects of 250 nmol/L MYK-461 (A). Each comparison is made in paired experiments between drug treated (solid lines) and DMSO control treated (dashed lines) for RGECO infected (red), RGECO-TnT infected (purple), and RGECO-TnI infected (blue) cells. Dot plots for all extracted parameters are plotted in (B; n=43–82 cells from n=3 isolations). Lines are median average and error bars are interquartile range, **P<0.01 and ***P<0.001 using an unpaired Mann-Whitney test comparing untreated to treated cells.
Figure 5.
Figure 5.
The effects of omecamtiv mecarbil on Ca2+ transient measurements in Guinea pig cardiomyocytes (GPCMs) with RGECO, RGECO-TnT (Troponin T), or RGECO-TnI (Troponin I). Averaged Ca2+ transients of 0.5 Hz paced GPCMs transduced with RGECO, RGECO-TnT, or RGECO-TnI were used to compare the effects 200 nmol/L omecamtiv mecarbil (A). Each comparison is made in paired experiments between drug treated (solid lines) and DMSO control treated (dashed lines) for RGECO infected (red), RGECO-TnT infected (purple), and RGECO-TnI infected (blue) cells. Dot plots for all extracted parameters are plotted in (B; n=42–75 cells from n=3 isolations). Lines are median average and error bars are interquartile range, all groups were not significant using an unpaired Mann-Whitney test comparing untreated to treated cells.
Figure 6.
Figure 6.
The effects of levosimendan on Ca2+ transient measurements in Guinea pig cardiomyocytes (GPCMs) with RGECO, RGECO-TnT (Troponin T), or RGECO-TnI (Troponin I). Averaged Ca2+ transients of 0.5 Hz paced GPCMs transduced with RGECO, RGECO-TnT, or RGECO-TnI was used to compare the effects 10 μmol/L levosimendan (A). Each comparison is made in paired experiments between drug treated (solid lines) and DMSO control treated (dashed lines) for RGECO infected (red), RGECO-TnT infected (purple), and RGECO-TnI infected (blue) cells. Dot plots for all extracted parameters are plotted in (B; n=71–83 cells from n=3 isolations). Lines are median average and error bars are interquartile range, *P<0.05, **P<0.01, and ***P<0.001 using an unpaired Mann-Whitney test comparing untreated to treated cells.
Figure 7.
Figure 7.
Cytoplasmic and myofilament localized Ca2+ transients with adenovirally transduced cTnT R92Q and cTnI R145G. Averaged Ca2+ transients of 0.5 Hz paced Guinea pig cardiomyocytes (GPCMs) transduced with RGECO (A and B) or RGECO-TnI (Troponin I)/RGECO-TnT (Troponin T; C and D) was used to compare Ca2+ transient effects between GPCMs transduced with either WT cTnT/cTnT R92Q (A and C), or WT cTnI/cTnI R145G (B and D). Peak amplitude ratio (E) and Δvalues for time to 50% binding (On; F) and 50% release (Off; G) are plotted including significance and labeled cytoplasmic (c) and myofilament (m; n=94–124 cells from n=3 isolations). Error bars are SD, **P<0.01 and ***P<0.001 using a Mann-Whitney test comparing wild-type (WT) troponin to mutant troponin transduced cells.

Comment in

References

    1. Maron BJ, Gardin JM, Flack JM, Gidding SS, Kurosaki TT, Bild DE. Prevalence of hypertrophic cardiomyopathy in a general population of young adults. Echocardiographic analysis of 4111 subjects in the CARDIA Study. Coronary Artery Risk Development in (Young) Adults. Circulation. 1995;92:785–789. - PubMed
    1. Watkins H, Ashrafian H, Redwood C. Inherited cardiomyopathies. N Engl J Med. 2011;364:1643–1656. doi: 10.1056/NEJMra0902923. - PubMed
    1. Walsh R, Buchan R, Wilk A, et al. Defining the genetic architecture of hypertrophic cardiomyopathy: re-evaluating the role of non-sarcomeric genes. Eur Heart J. 2017;38:3461–3468. doi: 10.1093/eurheartj/ehw603. - PMC - PubMed
    1. Redwood CS, Moolman-Smook JC, Watkins H. Properties of mutant contractile proteins that cause hypertrophic cardiomyopathy. Cardiovasc Res. 1999;44:20–36. - PubMed
    1. Knollmann BC, Kirchhof P, Sirenko SG, Degen H, Greene AE, Schober T, Mackow JC, Fabritz L, Potter JD, Morad M. Familial hypertrophic cardiomyopathy-linked mutant troponin T causes stress-induced ventricular tachycardia and Ca2+-dependent action potential remodeling. Circ Res. 2003;92:428–436. doi: 10.1161/01.RES.0000059562.91384.1A. - PubMed

Publication types

MeSH terms