. 2019 Feb 7;11(1):20.
doi: 10.1186/s13148-019-0612-6.

Maternal obesity influences expression and DNA methylation of the adiponectin and leptin systems in human third-trimester placenta

Affiliations

Maternal obesity influences expression and DNA methylation of the adiponectin and leptin systems in human third-trimester placenta

Perrine Nogues et al. Clin Epigenetics. .

Abstract

Background: It is well established that obesity is associated with dysregulation of the ratio between the two major adipokines leptin and adiponectin. Furthermore, it was recently reported that maternal obesity has a significant impact on placental development. Leptin and adiponectin are present at the fetal-maternal interface and are involved in the development of a functional placenta. However, less is known about leptin and adiponectin's involvement in the placental alterations described in obese women. Hence, the objective of the present study was to characterize the placental expression and DNA methylation of these two adipokine systems (ligands and receptors) in obese women.

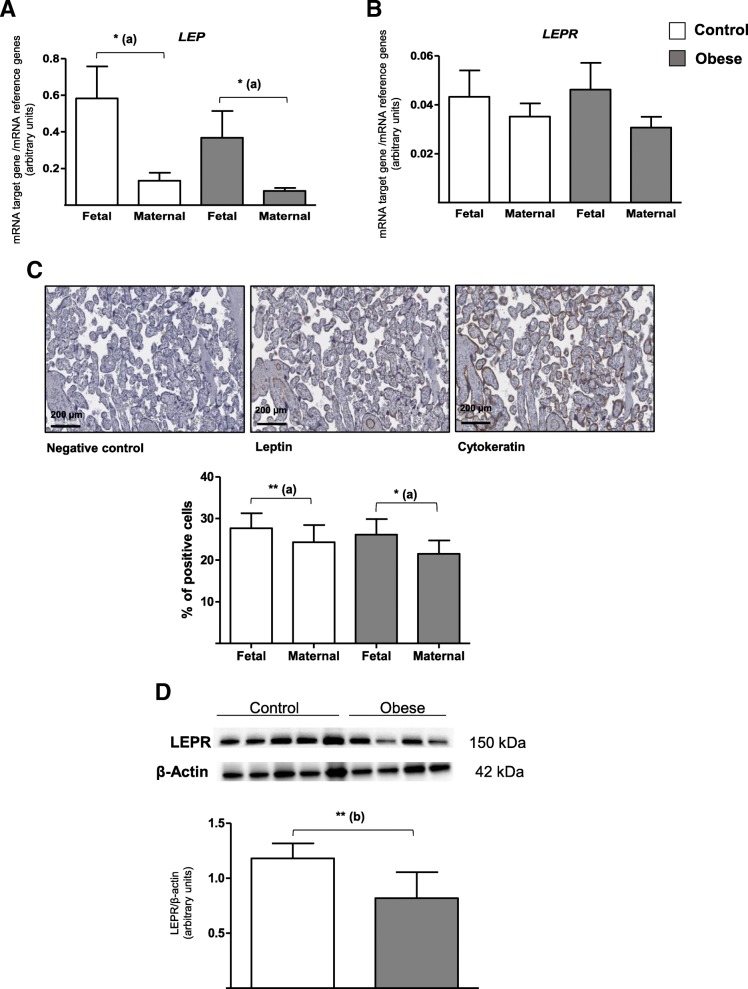
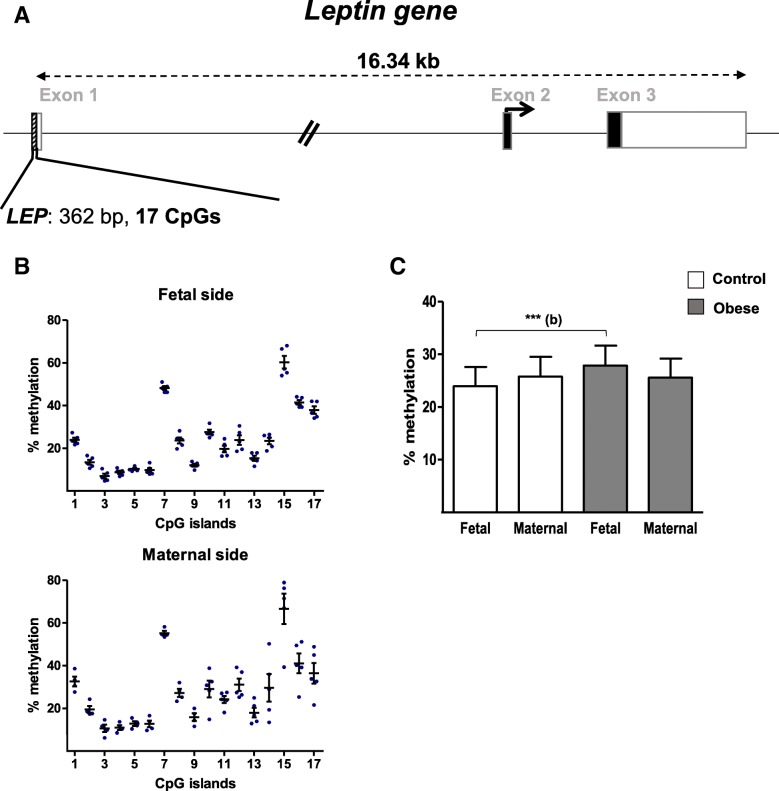
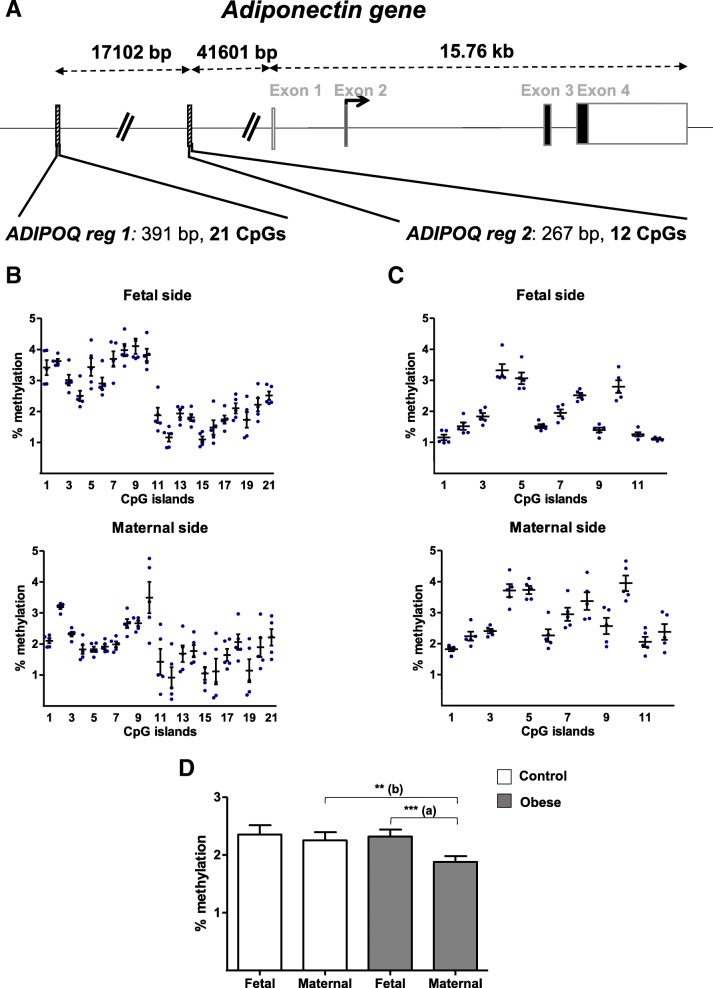
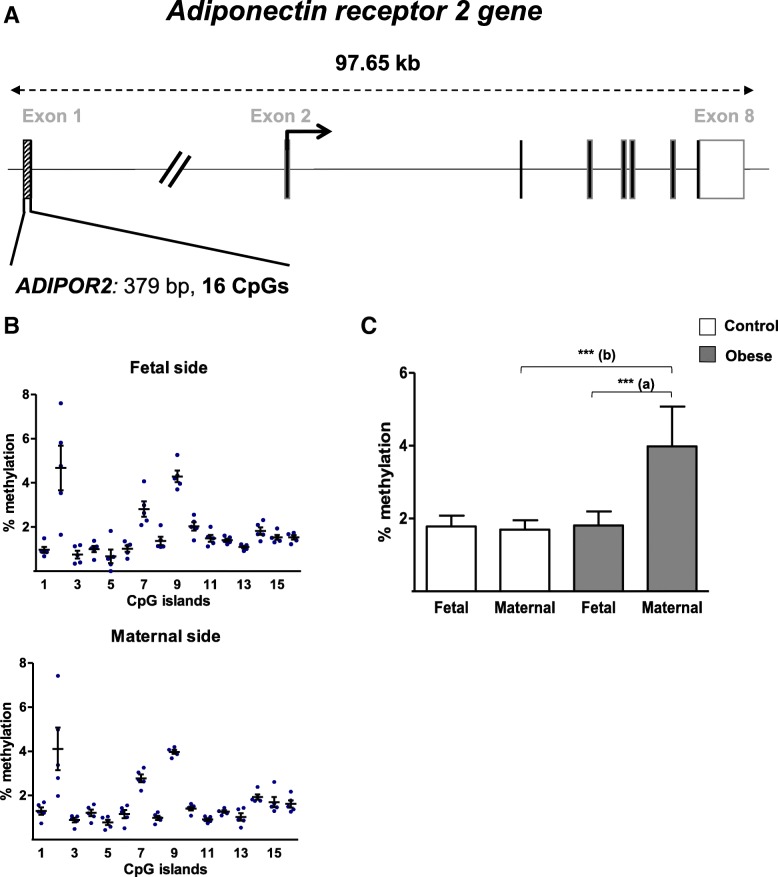
Results: Biopsies were collected from the fetal and maternal sides of third-trimester placenta in obese and non-obese (control) women. In both groups, leptin levels were higher on the fetal side than the maternal side, suggesting that this cytokine has a pivotal role in fetal growth. Secondly, maternal obesity (in the absence of gestational diabetes) was associated with (i) elevated DNA methylation of the leptin promoter on fetal side only, (ii) hypomethylation of the adiponectin promoter on the maternal side only, (iii) significantly low levels of leptin receptor protein (albeit in the absence of differences in mRNA levels and promoter DNA methylation), (iv) significantly low levels of adiponectin receptor 1 mRNA expression on the maternal side only, and (v) elevated DNA methylation of the adiponectin receptor 2 promoter on the maternal side only.

Conclusion: Our present results showed that maternal obesity is associated with the downregulation of both leptin/adiponectin systems in term placenta, and thus a loss of the beneficial effects of these two adipokines on placental development. Maternal obesity was also associated with epigenetic changes in leptin and adiponectin systems; this highlighted the molecular mechanisms involved in the placenta's adaptation to a harmful maternal environment.

Keywords: Adiponectin; DNA methylation; Leptin; Maternal obesity; Placenta.


Conflict of interest statement

Ethics approval and consent to participate

The present study was approved by the local investigational review board (Comité Consultatif de Protection des Personnes dans la Recherche Médicale; reference protocol 01–78). All participants provided their written informed consent prior to tissue sampling.

Consent for publication

Not applicable.

Competing interests

The authors declare that they have no competing interests.

Publisher’s Note

Springer Nature remains neutral with regard to jurisdictional claims in published maps and institutional affiliations.

Figures

Fig. 1
Fig. 1
LEP and LEPR expression levels in human third-trimester placental tissue. a, b mRNA expression of LEP and LEPR. Total RNA was extracted from the fetal and maternal sides of third-trimester placenta in control and obese women, and then analyzed using RT-qPCR. The data are quoted as the mean ± SEM. *p < 0.05 in a Wilcoxon test. (a) Maternal side vs. fetal side. c Leptin protein expression. Third-trimester placental biopsies were fixed, embedded in paraffin, and stained for anti-leptin antibody, as described in the “Methods” section. The data are quoted as the mean ± SEM of N = 16 placental sections. *p < 0.05; **p < 0.01 in a Wilcoxon test. (a) Maternal side vs. fetal side. d LEPR protein expression. Lysates of third-trimester placental biopsies from control and obese women were extracted and then subjected to Western blot analysis using an anti-LEPR or anti-β-actin antibody, as described in the “Methods” section. The data are representative of five separate experiments and are quoted as the mean ± SEM. **p < 0.01 in a Student t test. (b) The obese group vs. the control group
Fig. 2
Fig. 2
ADIPOR expression in human third-trimester placental tissue. a, b mRNA expression of ADIPOR1 and ADIPOR2. Total RNA was extracted from the fetal and maternal sides of third-trimester placenta in control and obese women, and then analyzed using RT-qPCR. The data are quoted as the mean ± SEM. *p < 0.05 in a Wilcoxon test. (a) Maternal side vs. fetal side. **p < 0.01 in a Mann-Whitney test. (b) The obese group vs. the control group. c ADIPOR1 and ADIPOR2 protein expression. Lysates of third-trimester placental biopsies from control and obese women were extracted and then subjected to Western blot analysis using an anti-ADIPOR1/R2 or anti-β-actin antibody, as described in the “Methods” section. The data are representative of five separate experiments and are quoted as the mean ± SEM. *p < 0.05 in a Student t test. (b) The obese group vs. the control group
Fig. 3
Fig. 3
DNA methylation in the promoter region of the LEP gene. a A schematic representation of the leptin gene, including the CpG islands in the promoter region. b The methylation pattern in the LEP promoter on the fetal and maternal sides of third-trimester placental biopsies from the control group. c The % methylation level in the LEP promoter region from third-trimester placenta. DNA was extracted from third-trimester placental biopsies (on the fetal and maternal sides) in the control and obese women. After bisulfite treatment, the methylation level was determined by pyrosequencing. The data are quoted as the mean ± SEM. **p < 0.01 in a Friedman test. (b) The obese group vs. the control group
Fig. 4
Fig. 4
DNA methylation in the promoter region of the LEPR gene. a A schematic representation of the LEPR gene, including the CpG islands in the promoter region. b The methylation pattern in the LEPR promoter on the fetal and maternal sides of third-trimester placental biopsies from the control group. c The % methylation level in the LEPR promoter region from third-trimester placenta. DNA was extracted from third-trimester placental biopsies (on the fetal and maternal sides) in the control and obese women. After bisulfite treatment, the methylation level was determined by pyrosequencing. The data are quoted as the mean ± SEM. Statistical significance was assessed in a Friedman test
Fig. 5
Fig. 5
DNA methylation in the promoter regions of the ADIPOQ gene. a A schematic representation of the ADIPOQ gene, including the CpG islands in the promoter region. b The methylation pattern in the ADIPOQ promoter region 1 (reg 1) on the fetal and maternal sides of third-trimester placental biopsies from the control group. c The methylation pattern in the ADIPOQ promoter region 2 (reg 2) on the fetal and maternal sides of third-trimester placental biopsies from the control group. d The % methylation level in the ADIPOQ promoter regions in third-trimester placenta. DNA was extracted from third-trimester placental biopsies (on the fetal and maternal sides) in the control and obese women. After bisulfite treatment, the methylation level was determined by pyrosequencing. The data are quoted as the mean ± SEM. **p < 0.01; ***p < 0.001 in a Friedman test. (a) Maternal side vs. fetal side. (b) The obese group vs. the control group
Fig. 6
Fig. 6
DNA methylation in the promoter region of the ADIPOR1 gene. a A schematic representation of the adiponectin receptor 1 gene (ADIPOR1), including the CpG islands in the promoter region. b The methylation pattern in the ADIPOR1 promoter on the fetal and maternal sides of third-trimester placental biopsies from the control group. c The % methylation level in the ADIPOR1 promoter region from third-trimester placenta. DNA was extracted from third-trimester placental biopsies (on the fetal and maternal sides) in the control and obese women. After bisulfite treatment, the methylation level was determined by pyrosequencing. The data are quoted as the mean ± SEM. *p < 0.05 in a Friedman test. (a) Maternal side vs. fetal side
Fig. 7
Fig. 7
DNA methylation in the promoter region of the ADIPOR2 gene. a A schematic representation of the adiponectin receptor 2 gene (ADIPOR2), including the CpG islands in the promoter region. b The methylation pattern in the ADIPOR2 promoter on the fetal and maternal sides of third-trimester placental biopsies from the control group. c The % methylation level in the ADIPOR2 promoter region from third-trimester placenta. DNA was extracted from third-trimester placental biopsies (on the fetal and maternal sides) in the control and obese women. After bisulfite treatment, the methylation level was determined by pyrosequencing. The data are quoted as the mean ± SEM. **p < 0.01; ***p < 0.001 in a Friedman test. (a) Maternal side vs. fetal side. (b) The obese group vs. the control group

References

    1. Kim SY, Dietz PM, England L, Morrow B, Callaghan WM. Trends in pre-pregnancy obesity in nine states, 1993–2003. Obesity. 2007;15:986–993. doi: 10.1038/oby.2007.621. - DOI - PubMed
    1. Jeve YB, Konje JC, Doshani A. Placental dysfunction in obese women and antenatal surveillance strategies. Best Pract Res Clin Obstet Gynaecol. 2015;29:350–364. doi: 10.1016/j.bpobgyn.2014.09.007. - DOI - PubMed
    1. Myatt L, Maloyan A. Obesity and placental function. Semin Reprod Med. 2016;34:042–049. doi: 10.1055/s-0035-1570027. - DOI - PubMed
    1. Sandovici I, Hoelle K, Angiolini E, Constância M. Placental adaptations to the maternal–fetal environment: implications for fetal growth and developmental programming. Reprod BioMed Online. 2012;25:68–89. doi: 10.1016/j.rbmo.2012.03.017. - DOI - PubMed
    1. Challier J, Basu S, Bintein T, Hotmire K, Minium J, Catalano P, et al. Obesity in pregnancy stimulates macrophage accumulation and inflammation in the placenta. Placenta. 2008;29:274–281. doi: 10.1016/j.placenta.2007.12.010. - DOI - PMC - PubMed

Publication types