

Biomarker concordance between primary colorectal cancer and its metastases
- PMID: 30733075
- PMCID: PMC6413540
- DOI: 10.1016/j.ebiom.2019.01.050
Biomarker concordance between primary colorectal cancer and its metastases
Abstract
Background: The use of biomarkers to target anti-EGFR treatments for metastatic colorectal cancer (CRC) is well-established, requiring molecular analysis of primary or metastatic biopsies. We aim to review concordance between primary CRC and its metastatic sites.
Methods: A systematic review and meta-analysis of all published studies (1991-2018) reporting on biomarker concordance between primary CRC and its metastatic site(s) was undertaken according to PRISMA guidelines using several medical databases. Studies without matched samples or using peripheral blood for biomarker analysis were excluded.
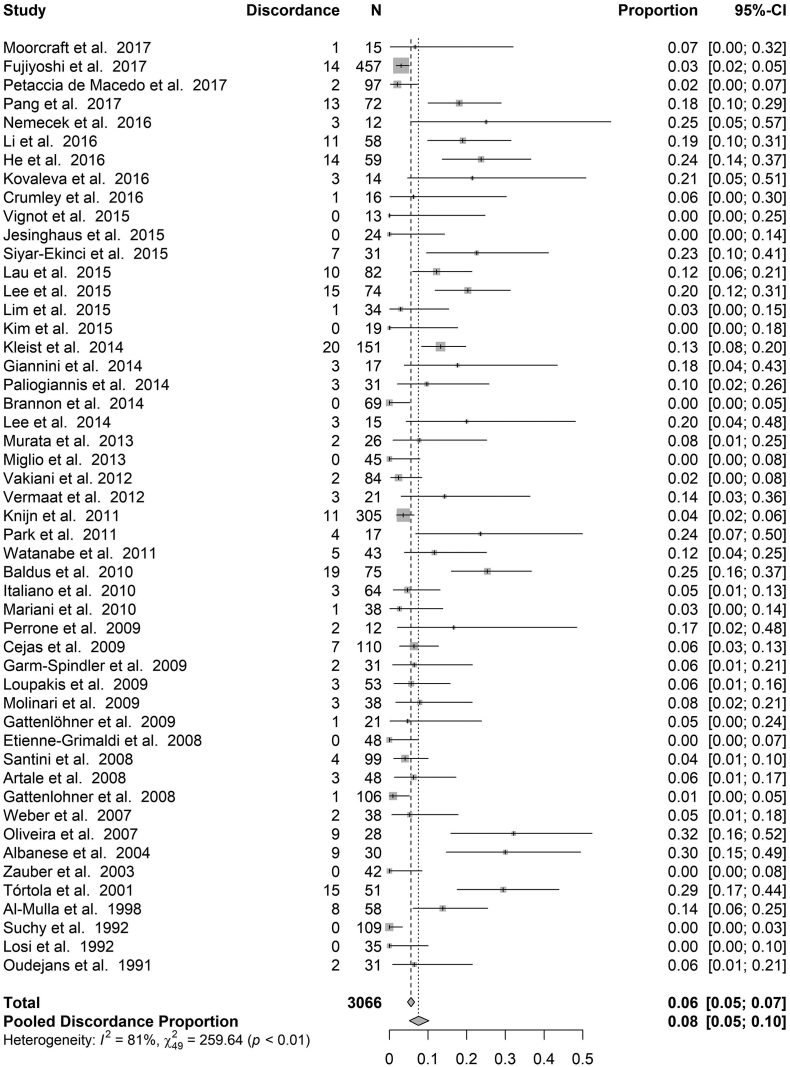
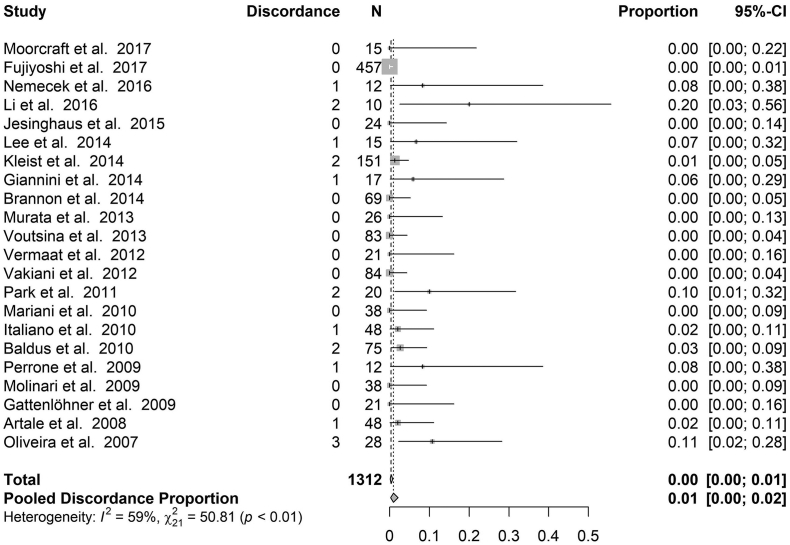
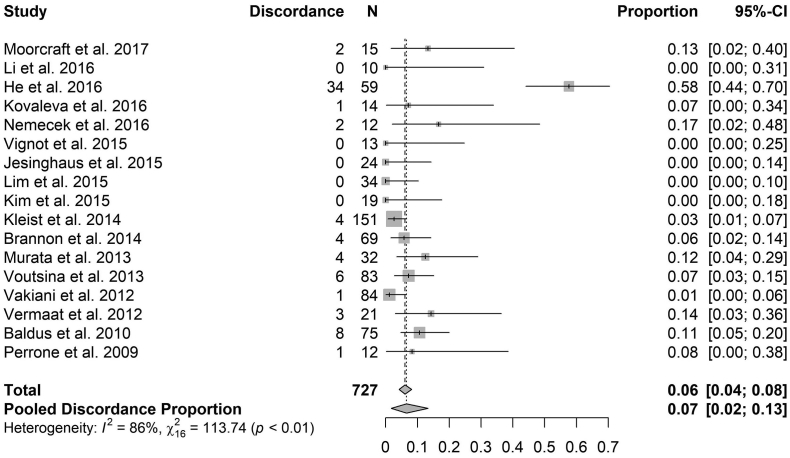
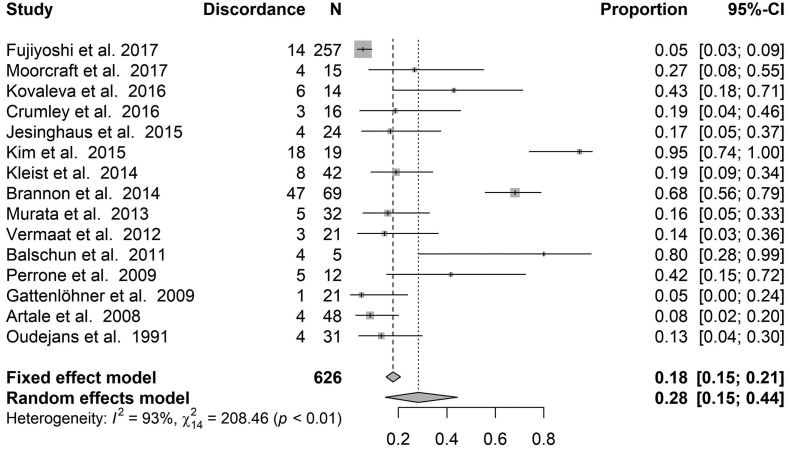
Findings: 61 studies including 3565 patient samples were included. Median biomarker concordance for KRAS (n = 50) was 93.7% [67-100], NRAS (n = 11) was 100% [90-100], BRAF (n = 22) was 99.4% [80-100], and PIK3CA (n = 17) was 93% [42-100]. Meta-analytic pooled discordance was 8% for KRAS (95% CI = 5-10%), 8% for BRAF (95% CI = 5-10%), 7% for PIK3CA (95% CI = 2-13%), and 28% overall (95% CI = 14-44%). The liver was the most commonly biopsied metastatic site (n = 2276), followed by lung (n = 438), lymph nodes (n = 1123), and peritoneum (n = 132). Median absolute concordance in multiple biomarkers was 81% (5-95%).
Interpretation: Metastatic CRC demonstrates high concordance across multiple biomarkers, suggesting that molecular testing of either the primary or liver and lung metastasis is adequate. More research on colorectal peritoneal metastases is required.
Keywords: BRAF; Biomarker; Colorectal cancer; Concordance; PIK3CA; RAS.
Copyright © 2019 The Authors. Published by Elsevier B.V. All rights reserved.
Figures
References
-
- Noone A., Howlader N., Krapcho M., Miller D., Brest A., Yu M. 2018. SEER Cancer Statistics Review, 1975–2015. Bethesda, MD.
-
- Van Cutsem E., Group on behalf of the EGW, Cervantes A, Group on behalf of the EGW, Nordlinger B, Group on behalf of the EGW Metastatic colorectal cancer: ESMO clinical practice guidelines for diagnosis, treatment and follow-up†. Ann Oncol. 2014 Sep 1;25(Suppl_3):iii1–iii9. - PubMed
-
- Ferlay J., Soerjomataram I., Dikshit R., Eser S., Mathers C., Rebelo M. Cancer incidence and mortality worldwide: sources, methods and major patterns in GLOBOCAN 2012. Int J Cancer. 2015;136(5):E359–E386. - PubMed
Publication types
MeSH terms
Substances
LinkOut - more resources
Full Text Sources
Medical
Research Materials
Miscellaneous
