. 2019 Apr 1;218(4):1148-1163.
doi: 10.1083/jcb.201807228. Epub 2019 Feb 7.

Mitotic chromosome alignment ensures mitotic fidelity by promoting interchromosomal compaction during anaphase

Affiliations

Mitotic chromosome alignment ensures mitotic fidelity by promoting interchromosomal compaction during anaphase

Cindy L Fonseca et al. J Cell Biol. .

Abstract

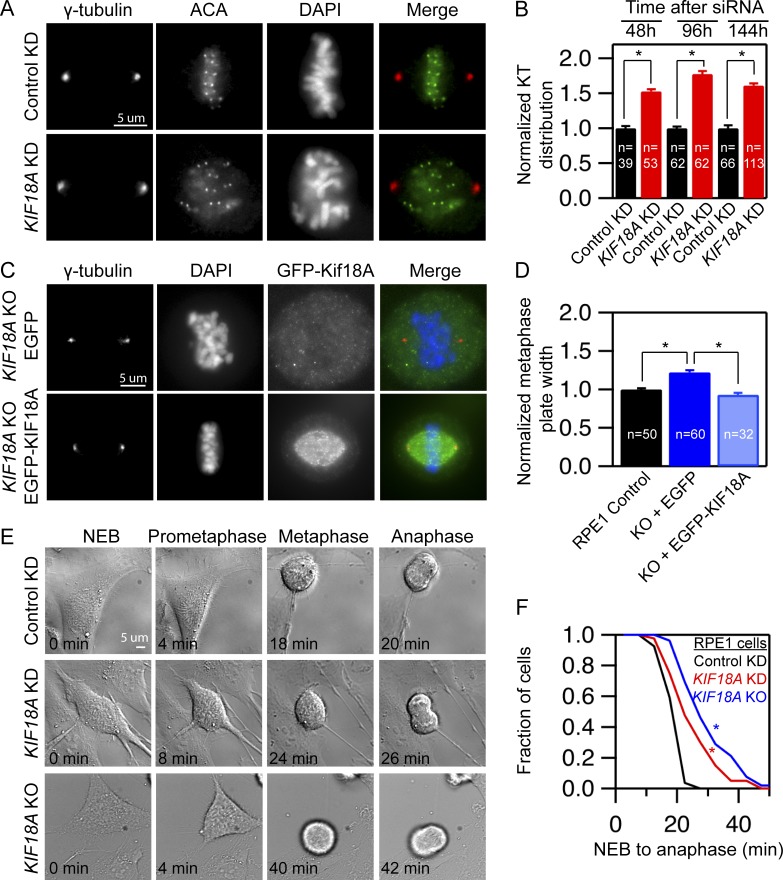
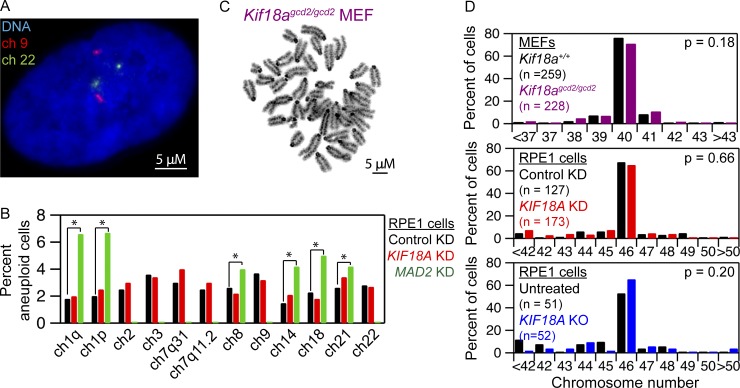
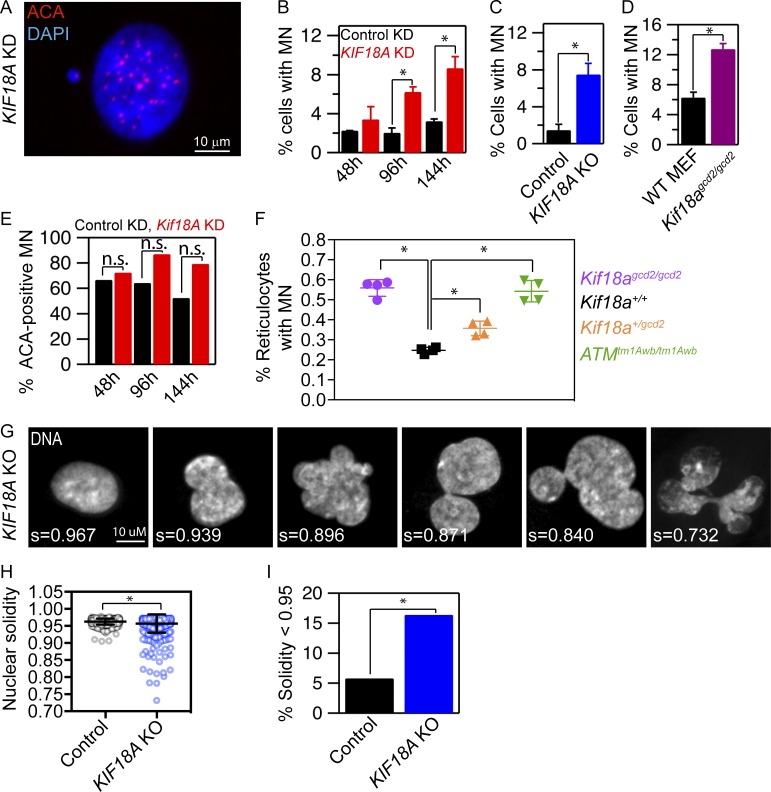
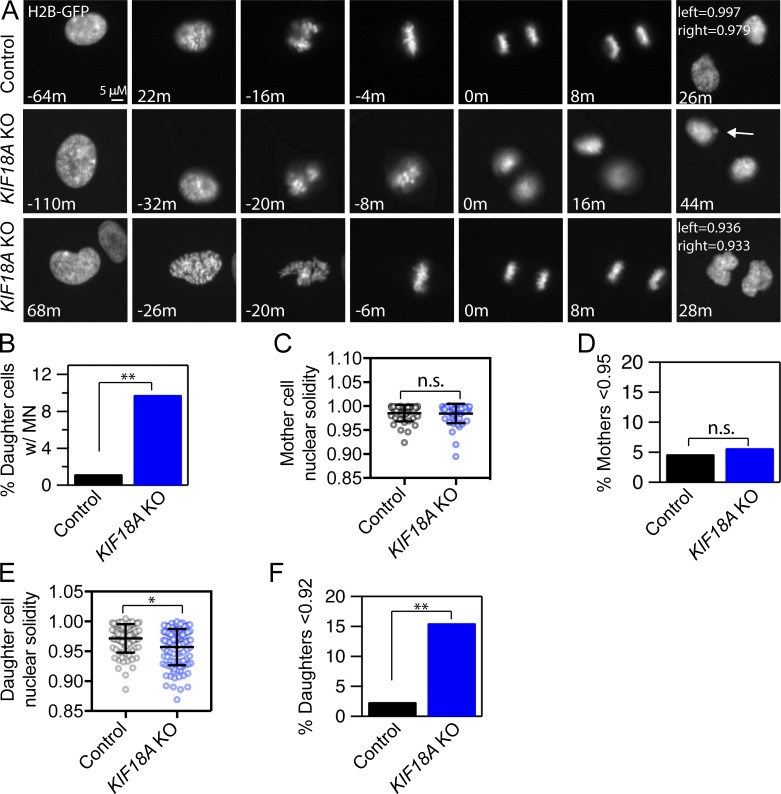
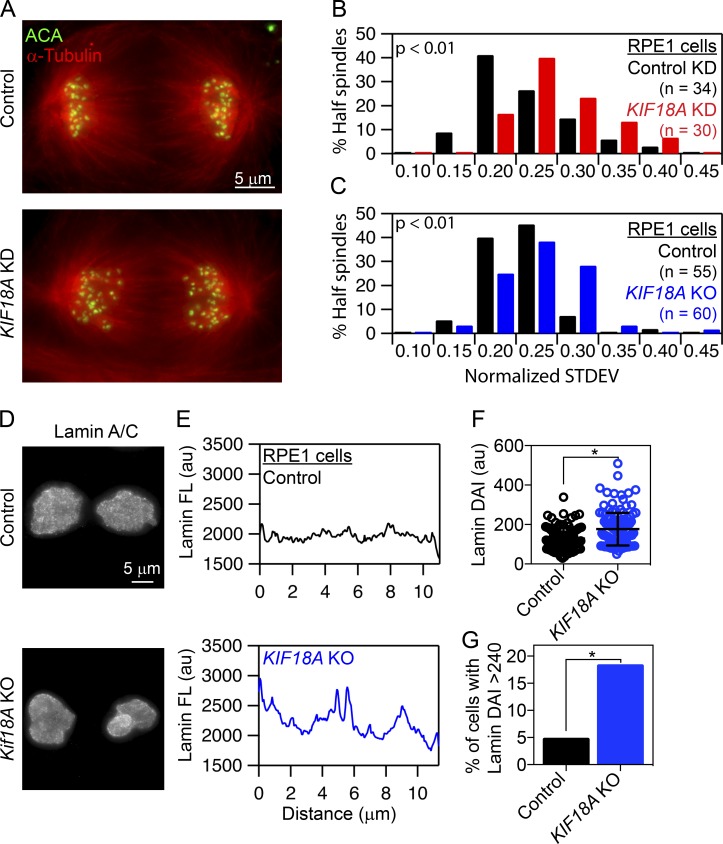
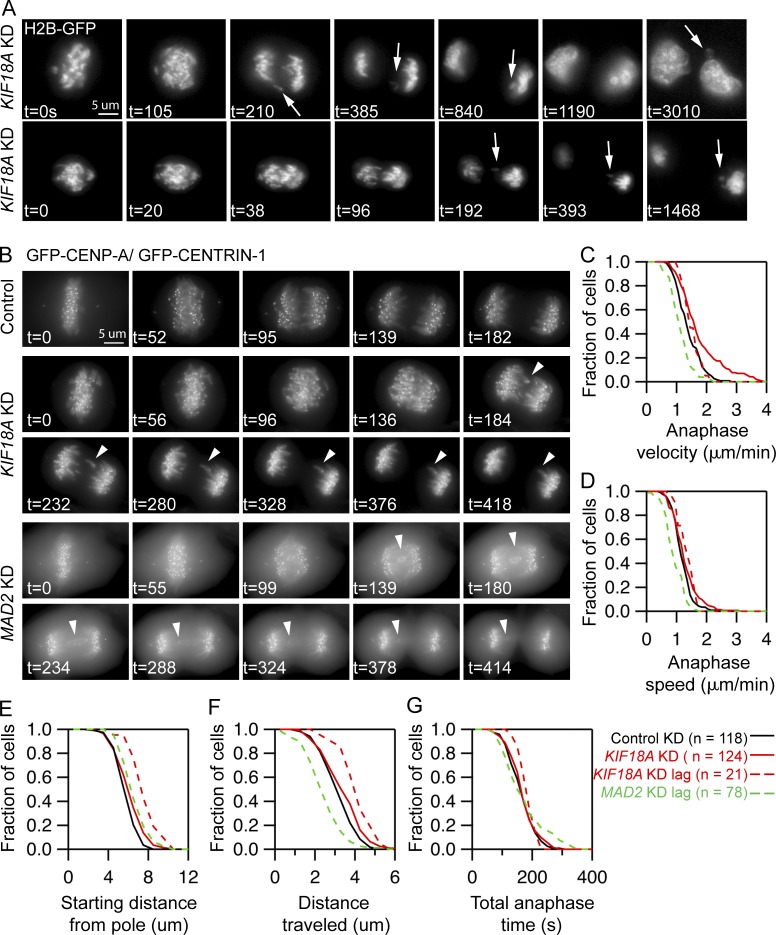
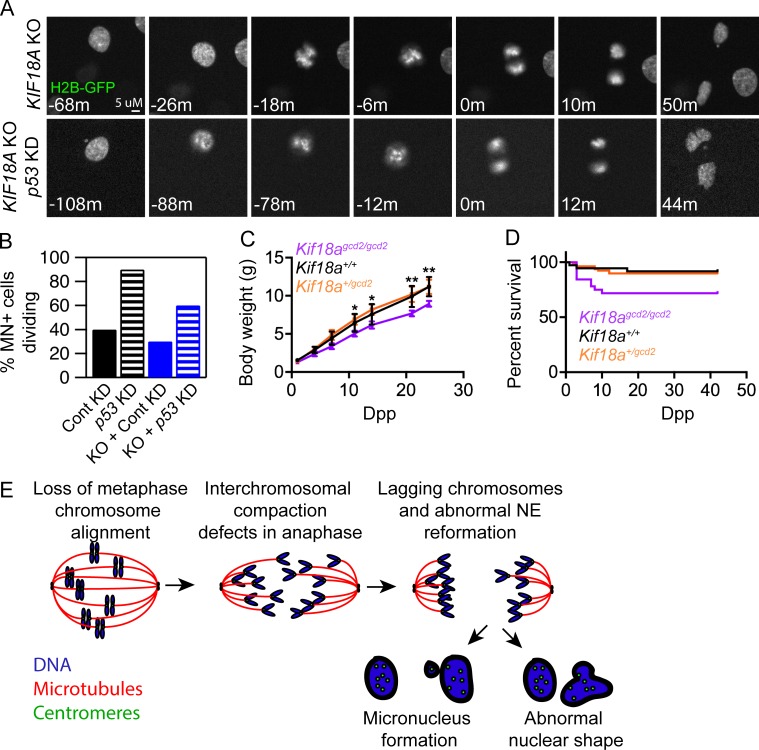
Chromosome alignment at the equator of the mitotic spindle is a highly conserved step during cell division; however, its importance to genomic stability and cellular fitness is not understood. Normal mammalian somatic cells lacking KIF18A function complete cell division without aligning chromosomes. These alignment-deficient cells display normal chromosome copy numbers in vitro and in vivo, suggesting that chromosome alignment is largely dispensable for maintenance of euploidy. However, we find that loss of chromosome alignment leads to interchromosomal compaction defects during anaphase, abnormal organization of chromosomes into a single nucleus at mitotic exit, and the formation of micronuclei in vitro and in vivo. These defects slow cell proliferation and are associated with impaired postnatal growth and survival in mice. Our studies support a model in which the alignment of mitotic chromosomes promotes proper organization of chromosomes into a single nucleus and continued proliferation by ensuring that chromosomes segregate as a compact mass during anaphase.


Figures

Figure 1.
Figure 1.
Human retinal pigment epithelial cells lacking KIF18A function progress through mitosis with unaligned chromosomes. (A) Representative images of centrosomes and kinetochores in fixed hTERT-RPE1 cells treated with the indicated siRNAs. (B) Plot of kinetochore (KT) distribution at the indicated times following siRNA treatment measured using the FWHM of kinetochore fluorescence along the pole-to-pole axis. Data are from two (48 and 96 h) or three independent experiments (144 h). Mean ± SEM is shown. (C) Images of KIF18A KO cells transiently expressing EGFP or EGFP-KIF18A. Cells were fixed and stained for γ-tubulin and DNA. (D) Plot of metaphase plate width in control and KIF18A KO cells expressing GFP or GFP-KIF18A. Plate width was determined by measuring FWHM of DAPI fluorescence along the pole-to-pole axis. Data were collected from two independent experiments. Mean ± SEM is shown. (E) Stills from time-lapse DIC imaging of hTERT-RPE1 cells from the indicated treatment groups. (F) Cumulative frequency plot of time from nuclear envelope breakdown (NEB) to anaphase onset. n = 27 (control), n = 40 (KIF18A KD), and n = 52 (KIF18A KO). Data were from four independent experiments. All statistical comparisons were made using a Kruskal–Wallis one-way ANOVA with Dunn’s multiple comparisons test; *, P < 0.01.
Figure 2.
Figure 2.
Loss of KIF18A function does not alter chromosome copy number. (A) Image of an hTERT-RPE1 cell with chromosomes 9 (red) and 22 (green) labeled by FISH. (B) Plot of the percentage of cells aneuploid for the indicated chromosomes following treatment with control siRNA, KIF18A siRNA, or MAD2 siRNA. n = 1,500 cells for each condition from three independent experiments; *, P < 0.05 based on χ2 analyses. The effect of MAD2 KD on chromosomes 2, 3, 7, or 9 was not determined. (C) Image of Geimsa stained metaphase spread of an early passage (p0) MEF. (D) Quantification of metaphase chromosome numbers from WT and Kif18agcd2/gcd2, early passage (p0), pair-matched MEFs (top); hTERT-RPE1 cells treated with control or KIF18A siRNAs (middle); and control and KIF18A KO RPE1 cells (bottom). Indicated P values were calculated by χ2 analyses. Data were collected from three independent experiments for Kif18agcd2/gcd2 MEFs and siRNA-treated cells. Data were collected from two independent experiments for KIF18A KO hTERT-RPE1 cells.
Figure 3.
Figure 3.
KIF18A-deficient cells form MN and abnormal nuclear shapes. (A) Representative image of a micronucleated hTERT-RPE1 cell labeled with DAPI and ACA to visualize DNA and centromeres, respectively. (B–D) Plots of the percentage of cells with MN in cells treated with the indicated siRNAs for 48, 96, or 144 h (B), control and KIF18A KO hTERT-RPE1 cells (C), and MEF from Kif18agcd2/gcd2 mice (D). n > 600 cells for each condition; data were compared via χ2 analyses. (E) Quantification of the percentage of MN containing centromeric DNA (ACA-positive) in control (black) and KIF18A siRNA (red) treated cells; data were compared via χ2 analyses. (F) Quantification of MN in mouse peripheral blood reticulocytes from Kif18a+/+, Kif18agcd2/gcd2, Kif18a+/gcd2, and Atmtm1Awb/tm1Awb. Data points represent the percentage of micronucleated cells from individual mice. Data were compared using a one-way ANOVA and Tukey’s multiple comparisons test. (G) Representative images of nuclear shapes and corresponding solidity values (s) observed in KIF18A KO hTERT-RPE1 cells. (H) Box and whisker plot of nuclear solidity values measured in control (n = 553) and KIF18A KO (n = 634) cells. Data distributions were compared using a Kolmogorov–Smirnov t test. (I) Plot of percentage of nuclei with solidity values two SDs below the average in control cells. Data were compared using a χ2 test. In all panels, *, P < 0.01. All data were collected from three independent experiments, and error bars indicate SD.
Figure 4.
Figure 4.
MN and abnormal nuclear shapes form as KIF18A-deficient cells exit mitosis. (A) Representative stills from time-lapse images of control and KIF18A KO hTERT-RPE1 cells expressing histone H2B-GFP. Note that MN (arrow, middle row) and lobed primary nuclei (bottom row) form as KIF18A KO cells exit mitosis. (B) Plot of the percentage of daughter cells that form MN during mitotic exit. Data were compared via χ2 test; **, P < 0.01. (C) Quantification of mother cell nuclear solidity measured 60 min before metaphase. Bars indicate mean and SD. Data were compared via Kolmogorov–Smirnov t test; P > 0.90. (D) Percentage of mother cell nuclear solidity values less than two SDs from the average control solidity. Data were compared via χ2 test; P > 0.90. (E) Quantification of daughter cell nuclear solidity 20 min after initial chromatin decondensation. Bars indicate mean and SD. Data were compared via Kolmogorov–Smirnov t test; *, P < 0.05. (F) Percentage of daughter cell nuclear solidity values two SDs below the average control solidity. Data were compared using χ2 tests; **, P < 0.01. All data were collected from three independent experiments.
Figure 5.
Figure 5.
Loss of KIF18A function and chromosome alignment disrupts interchromosomal compaction during anaphase and Lamin A/C distribution during telophase. (A) Representative images of anaphase cells fixed and stained for α-tubulin (red) and centromeres (ACA; green). (B and C) Histograms of centromere to pole distance variance (calculated as SD) among all centromeres within a half spindle of control and KIF18A siRNA-treated hTERT-RPE1 cells (B) or control and KIF18A KO hTERT-RPE1 cells (C). Data were compared using a Kolmogorov–Smirnov t test; P < 0.01. (D) Representative images of control and KIF18A KO telophase cells labeled with Lamin A/C antibodies. (E) Plots of Lamin A/C fluorescence profiles along the long axis of telophase nuclei from control and KIF18A KO hTERT-RPE1 cells. (F) Box and whisker plot of Lamin A/C fluorescence variance in telophase nuclei calculated as the DAI in control and KIF18A KO cells. Bars indicate mean and SD. Distributions of DAI were compared using a Kolmogorov–Smirnov t test; P < 0.005. (G) Percentage of telophase cells with a DAI >2 SDs above the average control DAI. Data were compared using a χ2 test. *, P < 0.005 All data were collected from three independent experiments.
Figure 6.
Figure 6.
In the absence of chromosome alignment, MN form around lagging chromosomes that travel long distances during anaphase. (A) Stills from time-lapse imaging of KIF18A-depleted cells expressing histone H2B-GFP. Arrows indicate lagging chromosomes that are excluded from the primary DNA mass and form MN. Data were collected from four independent experiments. (B) Representative images of live cells stably expressing GFP-CENP-A and GFP-CENTRIN-1 treated with control, KIF18A, or MAD2 siRNAs. Arrowheads indicate lagging chromosomes. (C–G) Survival plots of poleward anaphase velocity (µm/min; C), poleward anaphase speed (D), starting distance from the pole (E), distance traveled (F), and total anaphase time (G) for kinetochores in each experimental condition indicated. Dashed lines indicate the behavior of lagging chromosomes in KIF18A and MAD2 siRNA-treated cells. Data were compared using a Kruskal–Wallis test with post hoc Dunn’s multiple comparison tests. The starting distance from the pole and distance traveled for lagging chromosomes in KIF18A siRNA cells were significantly different than those in control siRNA cells or total kinetochores in KIF18A KD cells (P < 0.01). The anaphase velocity, speed, and distance traveled for lagging chromosomes in MAD2 KD cells are significantly different than those of kinetochores in control siRNA cells (P < 0.01). Data were collected from three independent experiments.
Figure 7.
Figure 7.
A p53-dependent mechanism limits the division of micronucleated KIF18A KO cells. (A) Still frames from time-lapse analyses of dividing histone 2B-GFP (H2B-GFP) expressing KIF18A KO cells and KIF18A KO cells treated with p53 siRNAs. (B) Plot of the percent of micronucleated cells that enter mitosis in control, p53 KD, KIF18A KO, or KIF18A KO + p53 KD hTERT-RPE1 cells. (C) Plot of body weights measured at the indicated dpp for each genotype listed. Error bars indicate SD. (D) Survival plot for mice of the indicated genotypes as a function of dpp. (E) Model for abnormal nuclear formation in the absence of chromosome alignment (see Discussion section for details). Data for all analyses were collected from three independent experiments.

Comment in

References

    1. Afonso O., Matos I., Pereira A.J., Aguiar P., Lampson M.A., and Maiato H.. 2014. Feedback control of chromosome separation by a midzone Aurora B gradient. Science. 345:332–336. 10.1126/science.1251121 - DOI - PMC - PubMed
    1. Barisic M., Aguiar P., Geley S., and Maiato H.. 2014. Kinetochore motors drive congression of peripheral polar chromosomes by overcoming random arm-ejection forces. Nat. Cell Biol. 16:1249–1256. 10.1038/ncb3060 - DOI - PubMed
    1. Barlow C., Hirotsune S., Paylor R., Liyanage M., Eckhaus M., Collins F., Shiloh Y., Crawley J.N., Ried T., Tagle D., and Wynshaw-Boris A.. 1996. Atm-deficient mice: a paradigm of ataxia telangiectasia. Cell. 86:159–171. 10.1016/S0092-8674(00)80086-0 - DOI - PubMed
    1. Canman J.C., Salmon E.D., and Fang G.. 2002. Inducing precocious anaphase in cultured mammalian cells. Cell Motil. Cytoskeleton. 52:61–65. 10.1002/cm.10032 - DOI - PubMed
    1. Cimini D., Moree B., Canman J.C., and Salmon E.D.. 2003. Merotelic kinetochore orientation occurs frequently during early mitosis in mammalian tissue cells and error correction is achieved by two different mechanisms. J. Cell Sci. 116:4213–4225. 10.1242/jcs.00716 - DOI - PubMed

Publication types

Associated data