. 2019 Feb 27;12(2):dmm037242.
doi: 10.1242/dmm.037242.

Differential regulation of the unfolded protein response in outbred deer mice and susceptibility to metabolic disease

Affiliations

Differential regulation of the unfolded protein response in outbred deer mice and susceptibility to metabolic disease

Amanda Havighorst et al. Dis Model Mech. .

Abstract

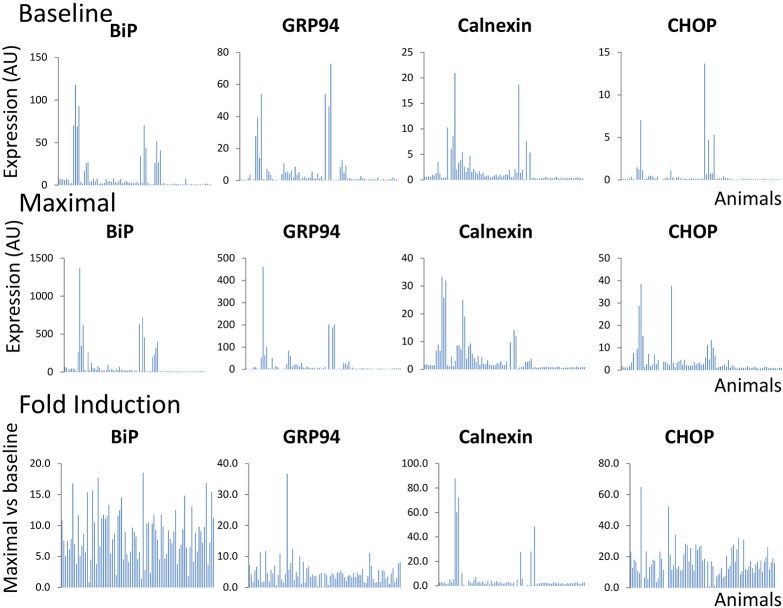
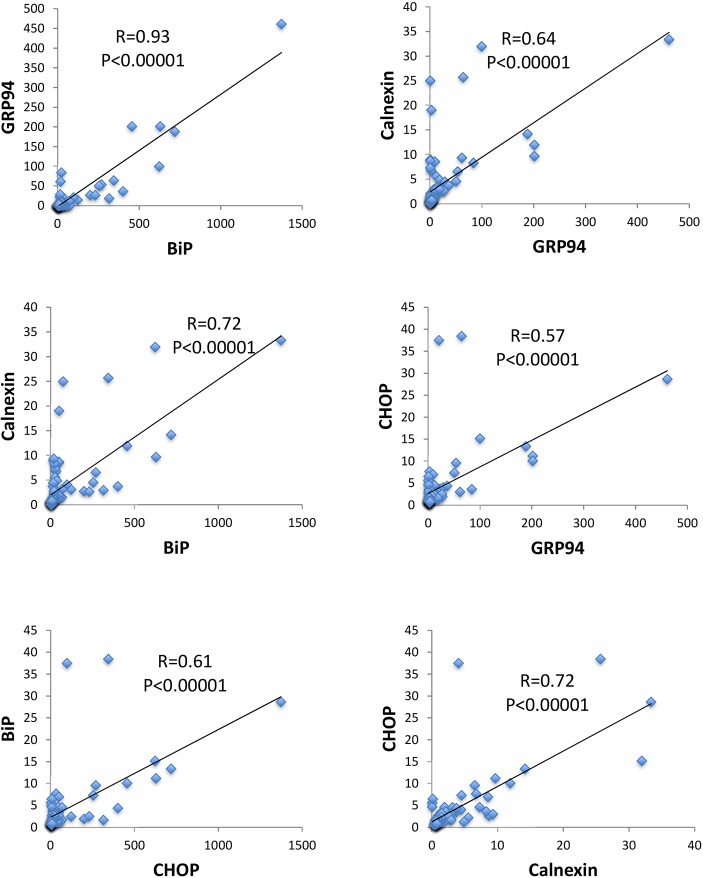
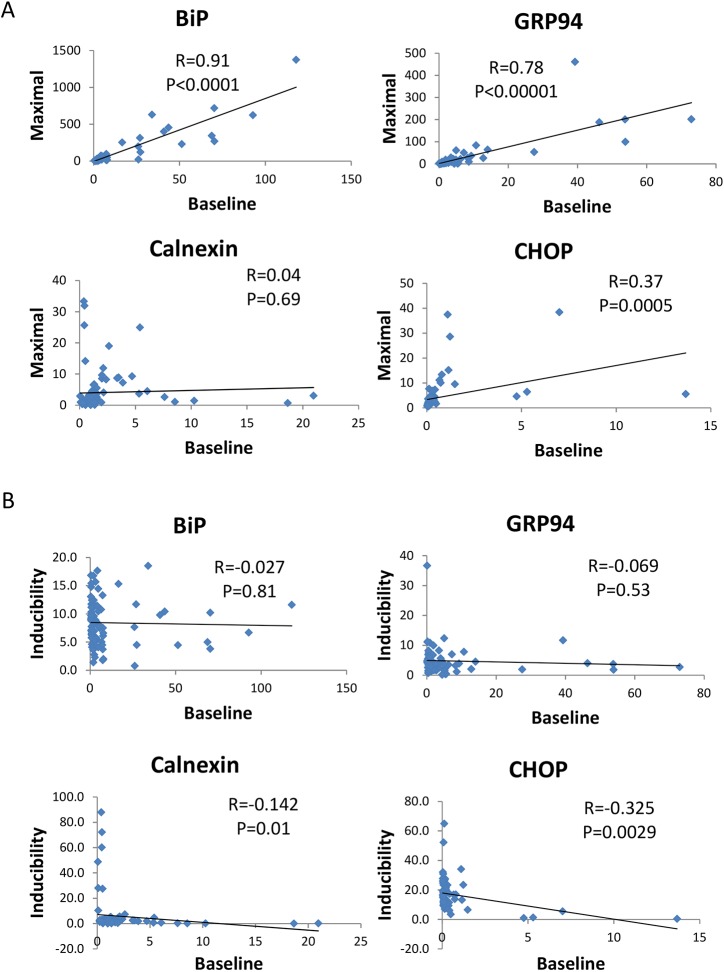
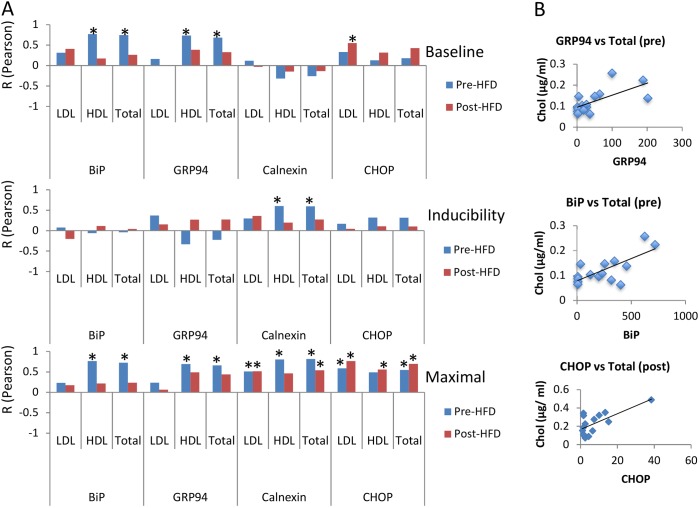
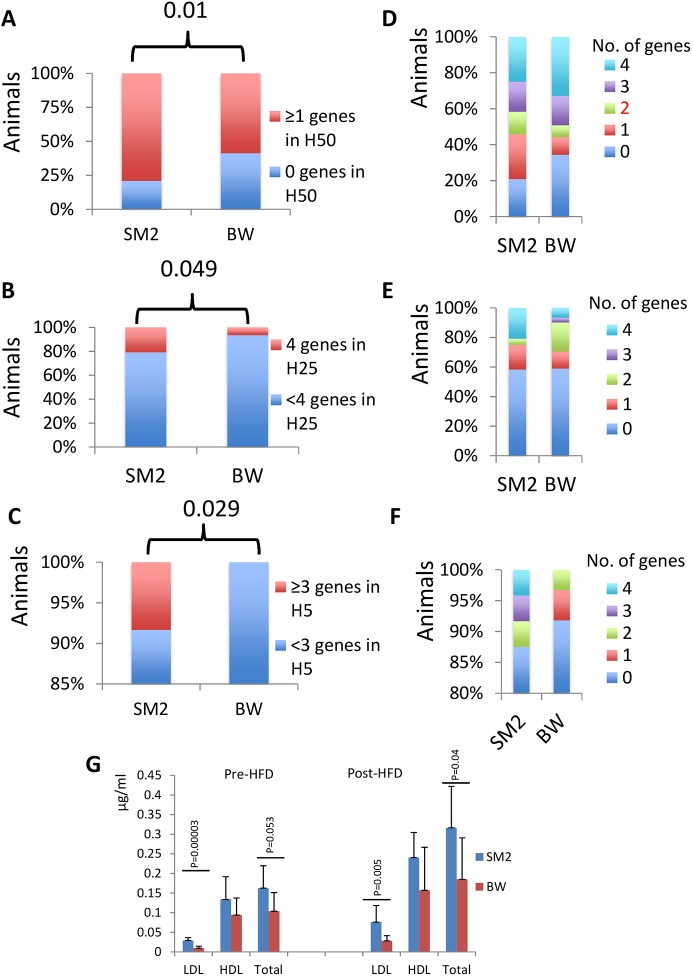
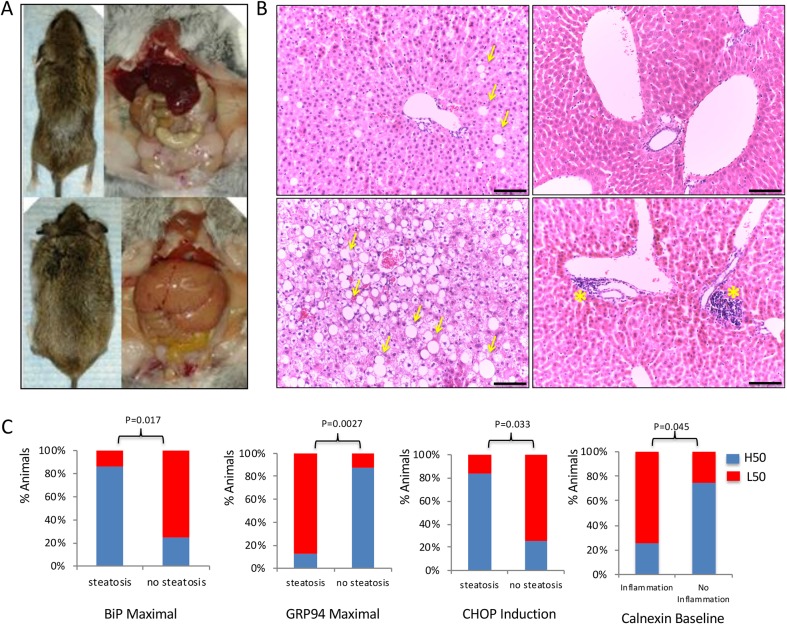
Endoplasmic reticulum (ER) stress has been causatively linked to the onset of various pathologies. However, whether and how inherent variations in the resulting unfolded protein response (UPR) affect predisposition to ER-stress-associated metabolic conditions remains to be established. By using genetically diverse deer mice (Peromyscus maniculatus) as a model, we show that the profile of tunicamycin-induced UPR in fibroblasts isolated at puberty varies between individuals and predicts deregulation of lipid metabolism and diet-induced hepatic steatosis later in life. Among the different UPR targets tested, CHOP (also known as Ddit3) more consistently predicted elevated plasma cholesterol and hepatic steatosis. Compared with baseline levels or inducibility, the maximal intensity of the UPR following stimulation best predicts the onset of pathology. Differences in the expression profile of the UPR recorded in cells from different populations of deer mice correlate with the varying response to ER stress in altitude adaptation. Our data suggest that the response to ER stress in cultured cells varies among individuals, and its profile early in life might predict the onset of ER-stress-associated disease in the elderly.This article has an associated First Person interview with the first author of the paper.

Keywords: ER stress; Expression profile; Lipidemia; Prediction.


Conflict of interest statement

Competing interestsThe authors declare no competing or financial interests.

Figures

Fig. 1.
Fig. 1.
Expression of BiP, GRP94, calnexin and CHOP in primary fibroblasts isolated at puberty from P. maniculatus. Expression prior to (baseline) and after (maximal) exposure to tunicamycin (5 µg/ml) for 5 h, and the ratio of maximal versus baseline expression (fold induction), is shown. All expression values were normalized in relation to Gapdh (n=85; 43 males and 42 females). Each bar represents a different animal.
Fig. 2.
Fig. 2.
Coordinated expression of UPR-associated genes in primary fibroblasts of P. maniculatus. Pairwise comparisons in expression (arbitrary units) of ER-stress-related genes after exposure of cells to tunicamycin. R-values from Pearson's correlation and P-values are shown. All expression values were normalized in relation to Gapdh (n=85; 43 males and 42 females).
Fig. 3.
Fig. 3.
Pairwise comparisons between the baseline expression versus maximal expression, and baseline expression versus inducibility, for BiP, GRP94, calnexin and CHOP. (A) Baseline expression versus maximal expression. (B) Baseline expression versus inducibility. R-values and P-values from Pearson's correlation are shown. All expression values were normalized in relation to Gapdh (n=85; 43 males and 42 females).
Fig. 4.
Fig. 4.
The UPR profile as recorded in primary fibroblasts is positively correlated with plasma lipid levels. (A) R-values (from Pearson correlation; *P<0.05) between prior to (baseline) and after (maximal) tunicamycin exposure, and the ratio of maximal versus baseline (inducibility) for BiP, GRP94, calnexin or CHOP, and lipid levels in the plasma of 4- to 5-month-old animals (n=15). Lipid levels were assessed in animals receiving regular or high-fat/sucrose diet for 2 weeks. (B) Representative examples of correlation between total cholesterol (Chol) before (pre) or after (post) high-fat-diet (HFD) administration and BiP, GRP94 and CHOP in pubertal fibroblasts after exposure to tunicamycin (*P<0.01, Pearson's). HDL, high-density lipoprotein; LDL, low-density lipoprotein.
Fig. 5.
Fig. 5.
Differences in the UPR profile in primary fibroblasts between high (SM2 population, n=24)- and low (BW population, n=61)-altitude deer mice. (A) Percentage of animals in each of the SM2 or BW populations that have at least 1 UPR gene in the highest 50th percentile (H50) of the total population. The P-value is shown (chi-square test). (B) Percentage of animals in each of the SM2 or BW populations that have all 4 UPR genes in the highest 25th percentile (H25) of the total population. The P-value is shown (chi-square test). (C) Percentage of animals in each of the SM2 or BW populations that have 3 or 4 UPR genes in the highest 5th percentile (H5) of the total population. The P-value is shown (chi-square test). (D-F) The corresponding distribution for the number of genes in each analysis in A, B and C, respectively. For these analyses, maximal expression was considered. (G) Average lipid levels in SM2 (n=5) or BW (n=10) prior to or after high-fat-diet (HFD) administration for 2 weeks. P-values (Student’s t-test) are shown. HDL, high-density lipoprotein; LDL, low-density lipoprotein.
Fig. 6.
Fig. 6.
Long-term administration of high-fat diet causes metabolic pathologies at variable degrees in P. maniculatus (n=16). (A) Macroscopic and necropsy images showing animals with minimal (top) or high (bottom) fat accumulation after administration of high-fat/sucrose diet for 6 months. (B) H&E-stained sections of livers from mice showing minimal or no evidence of pathology (top row), high degree of hepatic steatosis (bottom left) or portal inflammation (bottom right). Yellow arrows indicate cells accumulating high amounts of fat; yellow asterisks indicate portal inflammation. Scale bar: 100 μm. (C) Correlation between steatosis (recorded in 8 of 16 animals), or portal inflammation (recorded in 8 of 16 animals), and whether the expression of the corresponding UPR-related gene was assigned to the top 50th (H50) or bottom 50th (L50) percentile in the animals tested. P-values (chi-square test) are indicated.

References

    1. Andruska N. D., Zheng X., Yang X., Mao C., Cherian M. M., Mahapatra L., Helferich W. G. and Shapiro D. J. (2015). Estrogen receptor α inhibitor activates the unfolded protein response, blocks protein synthesis, and induces tumor regression. Proc. Natl. Acad. Sci. USA 112, 4737-4742. 10.1073/pnas.1403685112 - DOI - PMC - PubMed
    1. Back S. H. and Kaufman R. J. (2012). Endoplasmic reticulum stress and type 2 diabetes. Annu. Rev. Biochem. 81, 767-793. 10.1146/annurev-biochem-072909-095555 - DOI - PMC - PubMed
    1. Bedford N. L. and Hoekstra H. E. (2015). Peromyscus mice as a model for studying natural variation. Elife 4, e06813 10.7554/eLife.06813 - DOI - PMC - PubMed
    1. Chen W.-T., Zhu G., Pfaffenbach K., Kanel G., Stiles B. and Lee A. S. (2014a). GRP78 as a regulator of liver steatosis and cancer progression mediated by loss of the tumor suppressor PTEN. Oncogene 33, 4997-5005. 10.1038/onc.2013.437 - DOI - PMC - PubMed
    1. Chen W.-T., Tseng C.-C., Pfaffenbach K., Kanel G., Luo B., Stiles B. L. and Lee A. S. (2014b). Liver-specific knockout of GRP94 in mice disrupts cell adhesion, activates liver progenitor cells, and accelerates liver tumorigenesis. Hepatology 59, 947-957. 10.1002/hep.26711 - DOI - PMC - PubMed

Publication types