. 2019 Feb 7;222(Pt 3):jeb191213.
doi: 10.1242/jeb.191213.

Sound localization behavior in Drosophilamelanogaster depends on inter-antenna vibration amplitude comparisons

Affiliations

Sound localization behavior in Drosophilamelanogaster depends on inter-antenna vibration amplitude comparisons

Alexandra V Batchelor et al. J Exp Biol. .

Abstract

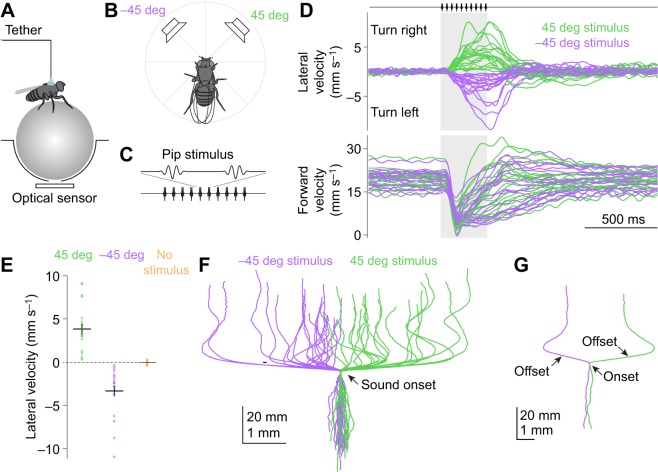
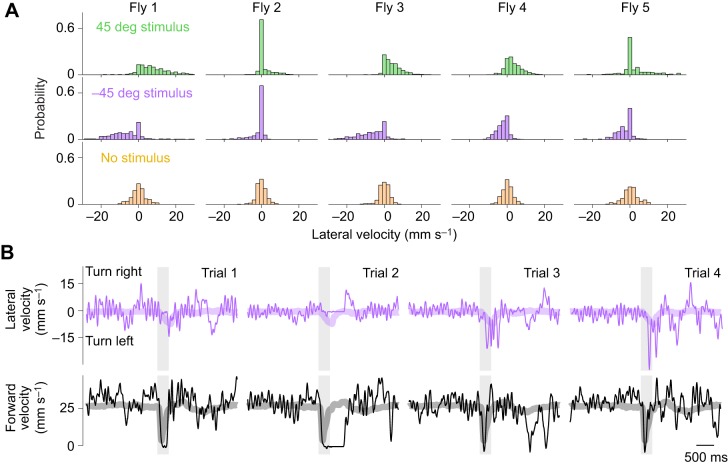
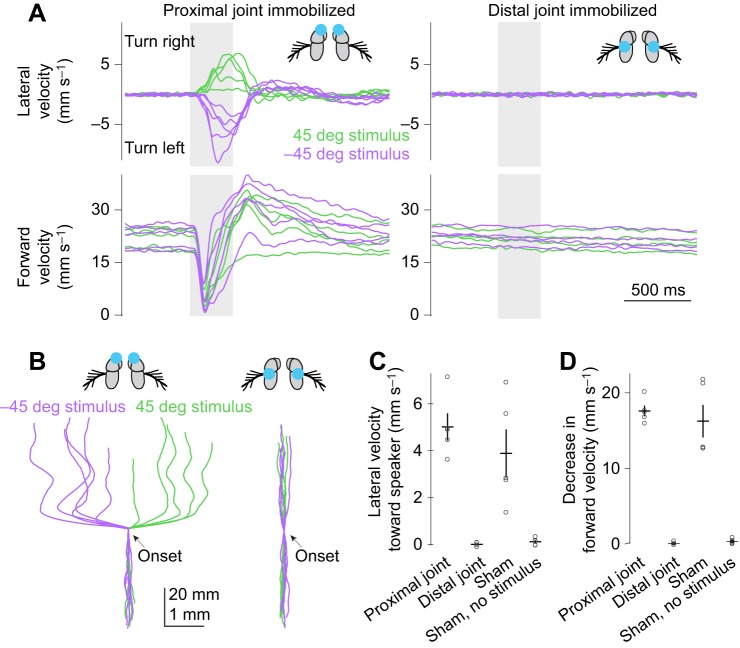
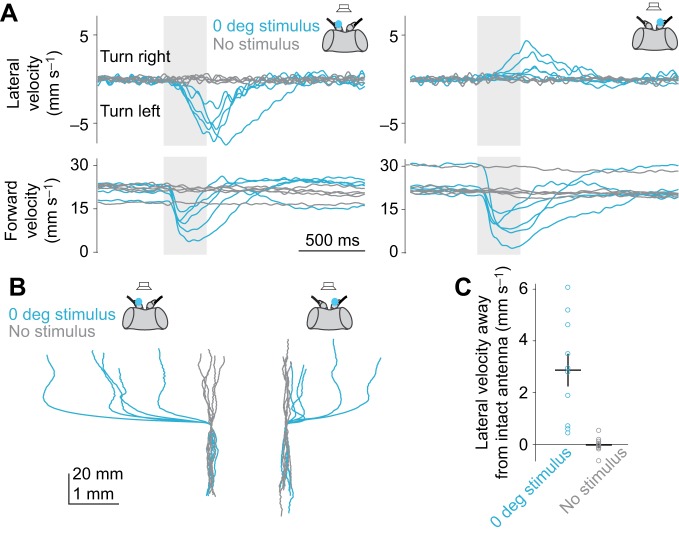
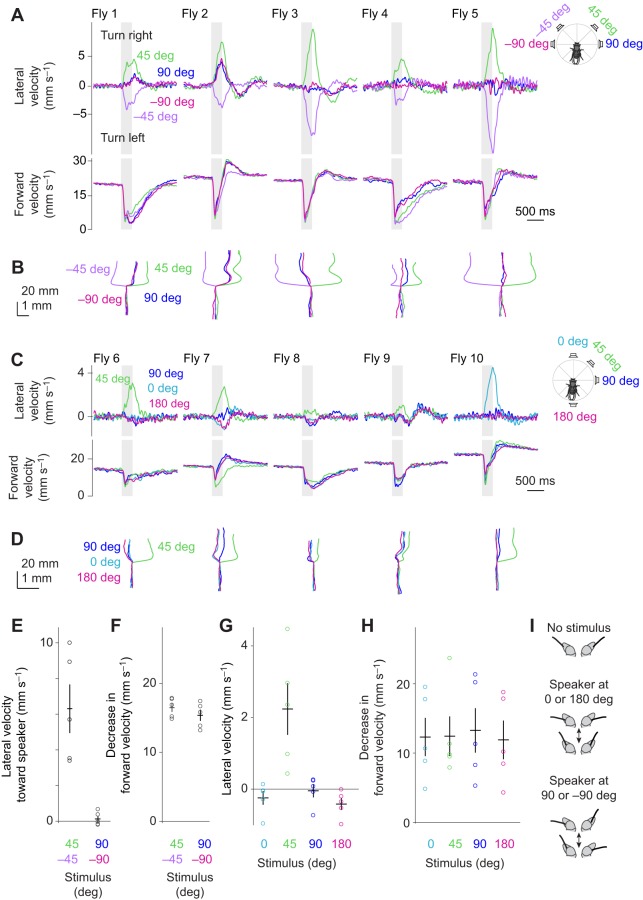
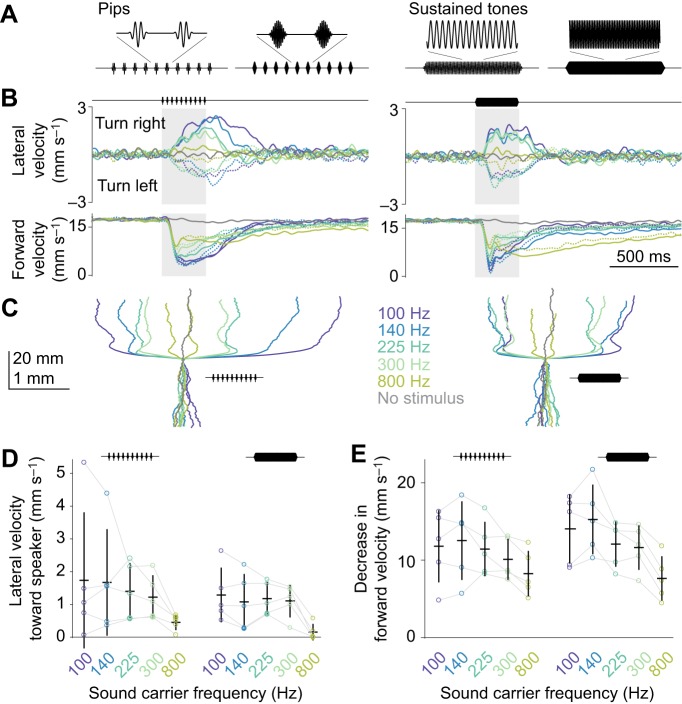
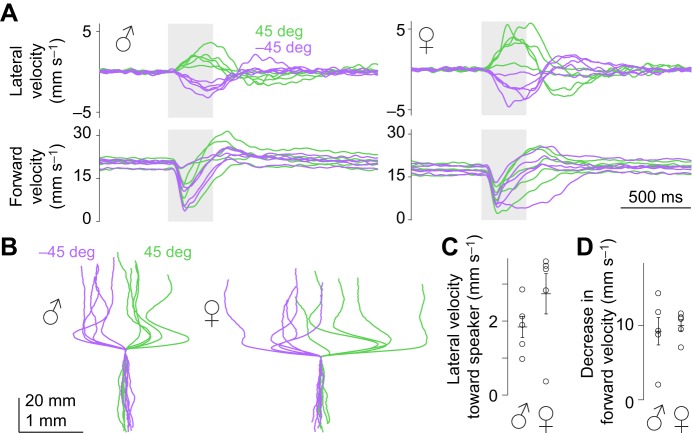
Drosophila melanogaster hear with their antennae: sound evokes vibration of the distal antennal segment, and this vibration is transduced by specialized mechanoreceptor cells. The left and right antennae vibrate preferentially in response to sounds arising from different azimuthal angles. Therefore, by comparing signals from the two antennae, it should be possible to obtain information about the azimuthal angle of a sound source. However, behavioral evidence of sound localization has not been reported in Drosophila Here, we show that walking D. melanogaster do indeed turn in response to lateralized sounds. We confirm that this behavior is evoked by vibrations of the distal antennal segment. The rule for turning is different for sounds arriving from different locations: flies turn toward sounds in their front hemifield, but they turn away from sounds in their rear hemifield, and they do not turn at all in response to sounds from 90 or -90 deg. All of these findings can be explained by a simple rule: the fly steers away from the antenna with the larger vibration amplitude. Finally, we show that these behaviors generalize to sound stimuli with diverse spectro-temporal features, and that these behaviors are found in both sexes. Our findings demonstrate the behavioral relevance of the antenna's directional tuning properties. They also pave the way for investigating the neural implementation of sound localization, as well as the potential roles of sound-guided steering in courtship and exploration.

Keywords: Auditory; Hearing; Insect; Johnston's organ; Phonotaxis.


Conflict of interest statement

Competing interestsThe authors declare no competing or financial interests.

Figures

Fig. 1.
Fig. 1.
Directional tuning of sound-evoked antennal vibrations. (A) Segments of the Drosophila melanogaster antenna. The arista is rigidly coupled to a3. The arista and a3 rotate (relative to a2) in response to sound. The dashed line is the approximate axis of rotation. (B) Dorsal view of the head. The aristae are shown as thick red and black lines. The rotation of the arista–a3 structure (about the long axis of a3) is intrinsically most sensitive to air particle movement perpendicular to the plane of the arista. (C) Schematized air speed heatmap for a sound source positioned in the horizontal plane at an azimuthal angle of 45 deg. Air speed is highest in the vicinity of the contralateral antenna, owing to boundary layer effects (adapted from data in Morley et al., 2012). (D) The amplitude of antennal vibrations is plotted in polar coordinates as a function of the azimuthal angle of the sound source (adapted from data in Morley et al., 2012). This mechanical tuning profile reflects the intrinsic directionality of each arista, plus boundary layer effects.
Fig. 2.
Fig. 2.
Lateralized sounds elicit phonotaxis as well as acoustic startle. (A) A female fly is tethered to a pin and positioned on a spherical treadmill. An optical sensor monitors the forward and lateral velocity of the treadmill; these values are inverted to obtain the fly's fictive velocity. (B) Sound stimuli are delivered from speakers placed at different azimuthal angles. In a given trial, speakers are activated individually (not together). (C) A sound stimulus similar to the pulse component of D. melanogaster courtship song. It consists of 10 pips with a carrier frequency of 225 Hz and an inter-pip interval of 34 ms (total duration 322 ms). (D) Lateral and forward velocity over time. Each trace shows data for one fly averaged across trials (n=19 flies). Flies transiently decrease their forward velocity (‘acoustic startle’; Lehnert et al., 2013) and then turn toward the sound source. (E) Lateral velocity (measured at stimulus offset) is significantly different when the speakers are positioned at 45 deg versus −45 deg (P=8×10⁻⁶, t-test). Each dot is one fly, averaged across trials. Lines are means±s.e.m. across flies. (F) Trial-averaged paths (x and y displacements), one per fly. (G) Two paths from F, with sound offset indicated. These examples show how some flies make compensatory turns shortly after sound offset.
Fig. 3.
Fig. 3.
Trial-to-trial variation in phonotaxis behavior. (A) Distribution of single-trial lateral velocity values (at stimulus offset) for five example flies. Histograms are normalized so they have the same area. (B) Randomly selected examples of one typical fly's responses to sounds from the left (−45 deg). Periodic fluctuations in lateral velocity correspond to individual strides (Gaudry et al., 2013). Thick lines are the trial-averaged data for this fly.
Fig. 4.
Fig. 4.
Phonotaxis requires vibration of the distal antennal segment. (A) Left: immobilizing the proximal antennal joint (the a2–a1 joint) does not eliminate phonotaxis or acoustic startle. Right: immobilizing the distal antennal joint (the a3–a2 joint) completely eliminates both behaviors. Speakers were positioned at 45 and −45 deg. In each plot, each trace shows data for one fly (left: n=5 flies; right: n=4 flies) averaged across trials. Blue dots in schematics represent glue drops. With regard to baseline forward velocity, note that both groups of manipulated flies are similar to unmanipulated flies (Fig. 2D). (B) Trial-averaged paths (x and y displacements) for each fly. (C) Lateral velocity toward the speaker, averaging data from the two speaker positions. Lateral velocity is significantly different when the distal joint is immobilized compared with either immobilizing the proximal joint or ‘sham-glued’ controls (P<0.05 in both cases, Games–Howell test; sham data are a subset of the data from Figs 2, 3). When the proximal joint is immobilized, lateral velocity is not significantly different from that of ‘sham-glued’ controls. Each dot is one fly. Lines are means±s.e.m. across flies. (D) Decrease in forward velocity, averaging data from the two speaker positions. Decrease in forward velocity is significantly different when the distal joint is immobilized compared with either immobilizing the proximal joint or ‘sham-glued’ controls (P<0.05 in both cases, Games–Howell test; sham data are a subset of the data from Figs 2, 3). When the proximal joint is immobilized, the decrease in forward velocity is not significantly different from that of ‘sham-glued’ controls (P>0.05, Games−Howell test).
Fig. 5.
Fig. 5.
Turning is contralateral to the antenna with larger vibrations. (A) Unilaterally deafening flies (by immobilizing the distal antennal joint) causes flies to turn away from the intact antenna when a sound is delivered from a speaker in front of the fly. In each plot, each trace shows trial-averaged data for one fly (n=5 flies per manipulation). Forward velocity also transiently decreases at stimulus onset (‘acoustic startle’). (B) Trial-averaged paths (x and y displacements) for each fly. (C) Lateral velocity away from the intact antenna, combining data from the two manipulations (left and right deafening). These values are significantly different for trials where no stimulus was delivered (P=0.002, t-test). Each dot is one fly. Lines are means±s.e.m. across flies.
Fig. 6.
Fig. 6.
Lateralized sounds arriving from the back elicit negative phonotaxis. (A) Trial-averaged velocity responses to speakers placed on the diagonals (45, −135, −45 and 135 deg), grouped by fly. Flies turn right for the speakers at 45 and −135 deg, while they turn left for the speakers at −45 and 135 deg. All stimuli elicit acoustic startle. (Figs 2, 3 show data from the same flies, but for 45 and −45 deg stimuli alone.) (B) Trial-averaged paths (x and y displacements) for each stimulus condition, grouped by fly. (C) Lateral velocity. Each dot is one fly. Black bars are means±s.e.m. across flies. Responses are significantly different for stimulus source locations that are 90 deg apart (P<1×10⁻⁶ for all comparisons between stimuli 90 deg apart, Tukey test), and not significantly different for stimulus source locations that are 180 deg apart (P>0.9 for all comparisons between stimuli 180 deg apart, Tukey test). (D) The decrease in forward velocity is not significantly different for stimulus source locations (P=0.668, likelihood ratio test). (E) The amplitude of antennal vibrations plotted in polar coordinates as a function of the azimuthal angle of the sound source (adapted from data in Morley et al., 2012). (F) When the speaker position moves from 45 to −135 deg, the direction of all antennal movements will be inverted. Our results indicate that this inversion has no effect on phonotaxis.
Fig. 7.
Fig. 7.
Sounds from any of the four cardinal directions elicit no phonotaxis. (A) Trial-averaged velocity responses. The stimuli from the cardinal directions (90 and −90 deg) elicit no systematic turning related to speaker position. However, these sounds sometimes elicit turns in a fly-specific direction (flies 1 and 2 turn right in response to 90 and −90 deg, whereas fly 3 turns left). Note that all five flies in this cohort turn right in response to the 45 deg stimulus and left in response to the −45 deg stimulus. (Figs 2, 3 show data from the same flies, but for 45 and −45 deg stimuli alone.) (B) Trial-averaged paths (x and y displacements) for each stimulus condition, grouped by fly. (C,D) In separate flies, we confirmed that a 90 deg stimulus elicits behavior that is not systematically different from 0 or 180 deg. As before, individual flies make idiosyncratic turns in response to 90 deg, but this is generally similar to their response to 0 and 180 deg. (E,F) Lateral velocity toward speaker and decrease in forward velocity for the flies in A and B. Data are combined for the two diagonal speakers (45 and −45 deg), and also for the two cardinal speakers (90 and −90 deg). Responses to the latter are not significantly different from zero (P=0.932, t-test). The decrease in forward velocity for the diagonal and cardinal speakers is significantly different (P=0.0314, t-test), although the effect size is small. Each dot is one fly. Lines are means±s.e.m. across flies. (G,H) Lateral velocity and decrease in forward velocity for the flies in C and D. The 45 deg stimulus is significantly different from all others (P<0.005 in all cases, Tukey test). Lateral velocities for 0, 90 and 180 deg are not significantly different (P>0.15 for all possible comparisons, Tukey test). Decreases in forward velocity are not significantly different (P=0.848, likelihood ratio test). (I) Schematized antennal phase relationships. Speakers at 0 and 180 deg cause the antennae to move toward the midline in phase, whereas speakers at 90 or −90 deg cause the antennae to move in opposite phases. Displacements are exaggerated for clarity.
Fig. 8.
Fig. 8.
Phonotaxis generalizes to sounds with diverse spectro-temporal features. (A) Example stimuli: pip stimuli with a 225 or 800 Hz carrier frequency, and sustained tone stimuli with a 225 or 800 Hz carrier frequency. (B) Velocity responses to pip stimuli (left) and sustained tone stimuli (right) from speakers placed at 45 deg (solid lines) and −45 deg (dashed lines). Data were averaged across trials for each fly, and then averaged across flies (n=5 flies). See C for color codes. The data from the 225 Hz pip stimuli are also shown in Figs 2, 3. (C) Paths (x and x displacements) for each stimulus condition. Data were averaged across trials for each fly, and then averaged across flies. (D) Lateral velocity toward speaker, averaging data from the two speaker positions. Each dot is one fly. Lines are means±s.e.m. across flies. (E) Decrease in forward velocity.
Fig. 9.
Fig. 9.
Both males and females display phonotaxis. (A) Trial-averaged velocity responses to sounds from 45 and −45 deg for males (left, n=5 flies) and females (right, n=5 flies, a subset of the data from Fig. 6, which is also shown in Figs 2, 3). (B) Trial-averaged paths (x and y displacements) for each fly. (C) Lateral velocity toward speaker, averaging data from the two speaker positions. Each dot is one fly. Lines are means±s.e.m. across flies. (D) Decrease in forward velocity, averaging data from the two speaker positions.

References

    1. Álvarez-Salvado E., Licata A., Connor E. G., McHugh M. K., King B. M. N., Stavropoulos N., Crimaldi J. P. and Nagel K. I. (2018). Elementary sensory-motor transformations underlying olfactory navigation in walking fruit-flies. eLife 7, e37815 10.7554/eLife.37815 - DOI - PMC - PubMed
    1. Ashida G. and Carr C. E. (2011). Sound localization: Jeffress and beyond. Curr. Opin. Neurobiol. 21, 745-751. 10.1016/j.conb.2011.05.008 - DOI - PMC - PubMed
    1. Atkins G. and Pollack G. S. (1987). Response properties of prothoracic, interganglionic, sound-activated interneurons in the cricket Teleogryllus oceanicus. J. Comp. Physiol. A 161, 681-693. 10.1007/BF00605009 - DOI
    1. Atkins G., Ligman S., Burghardt F. and Stout J. F. (1984). Changes in phonotaxis by the female cricket Acheta domesticus L. after killing identified acoustic interneurons. J. Comp. Physiol. A 154, 795-804. 10.1007/BF00610680 - DOI
    1. Azevedo A. W. and Wilson R. I. (2017). Active mechanisms of vibration encoding and frequency filtering in central mechanosensory neurons. Neuron 96, 446-460.e9. - PMC - PubMed

Publication types

LinkOut - more resources