. 2019 Aug;104(8):1648-1660.
doi: 10.3324/haematol.2018.208363. Epub 2019 Feb 7.

Platelet glycoprotein VI and C-type lectin-like receptor 2 deficiency accelerates wound healing by impairing vascular integrity in mice

Affiliations

Platelet glycoprotein VI and C-type lectin-like receptor 2 deficiency accelerates wound healing by impairing vascular integrity in mice

Surasak Wichaiyo et al. Haematologica. 2019 Aug.

Abstract

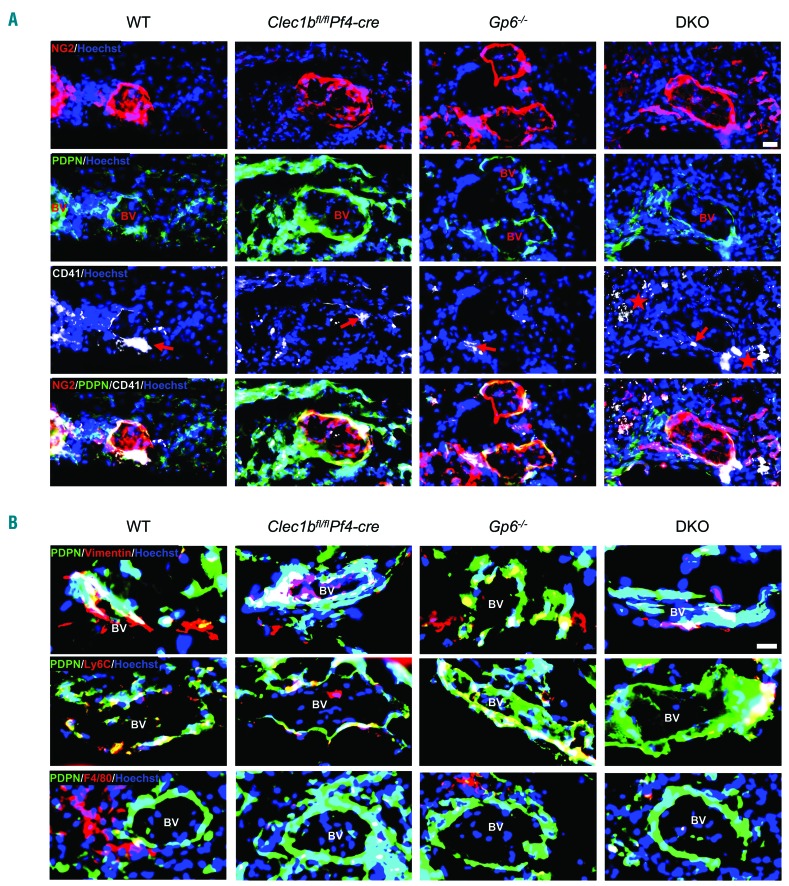
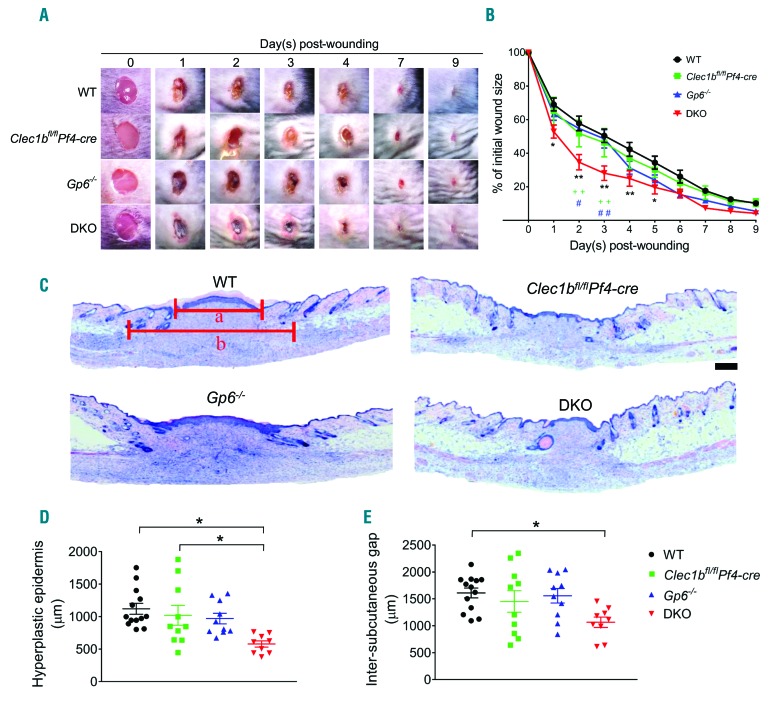
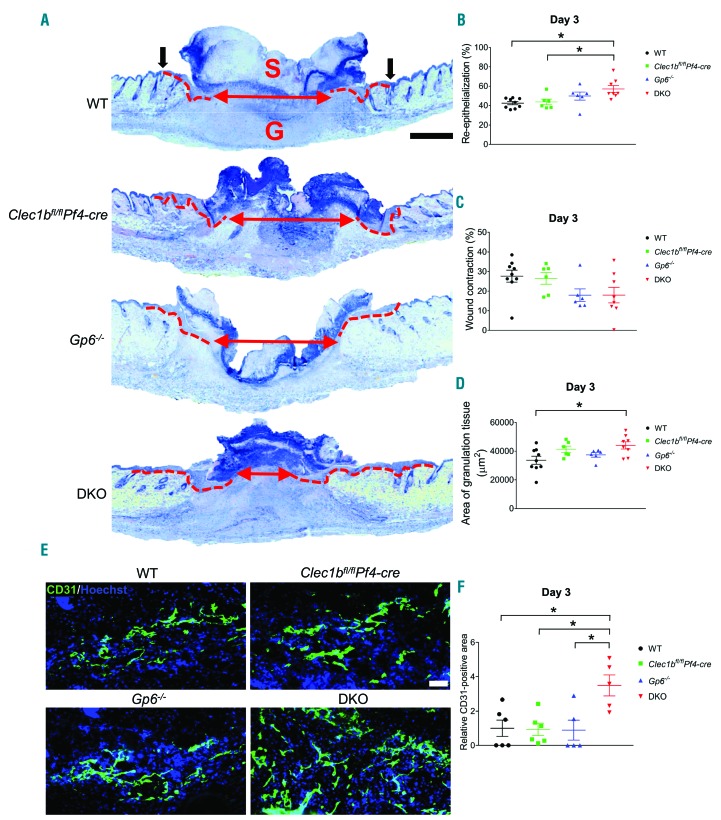
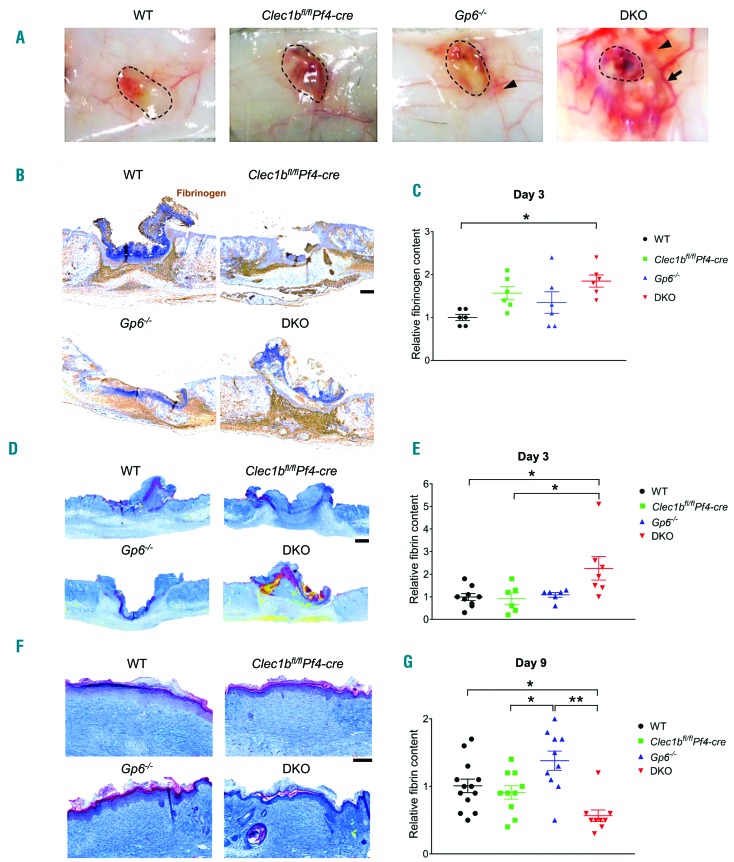
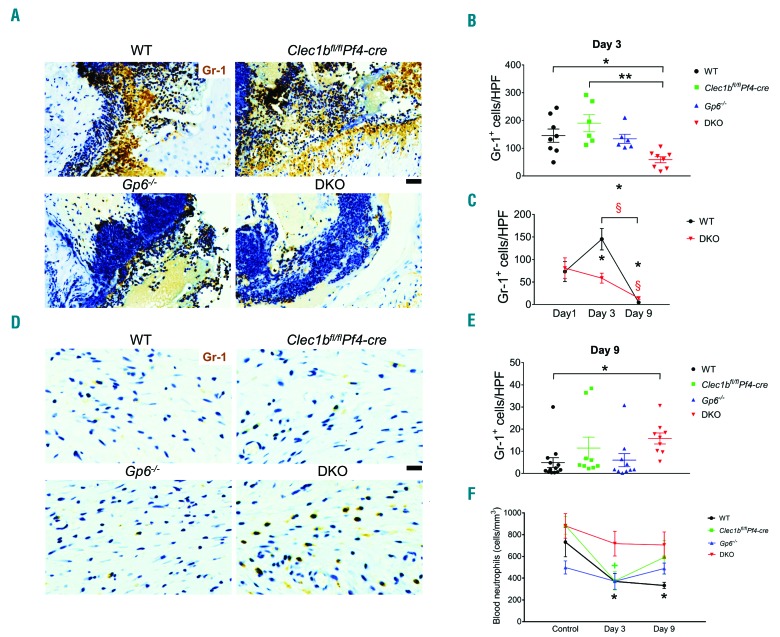
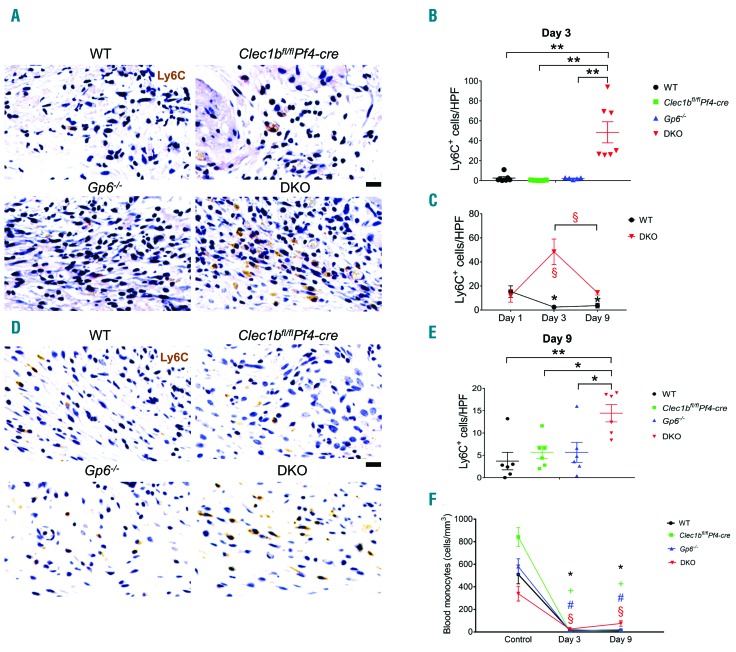
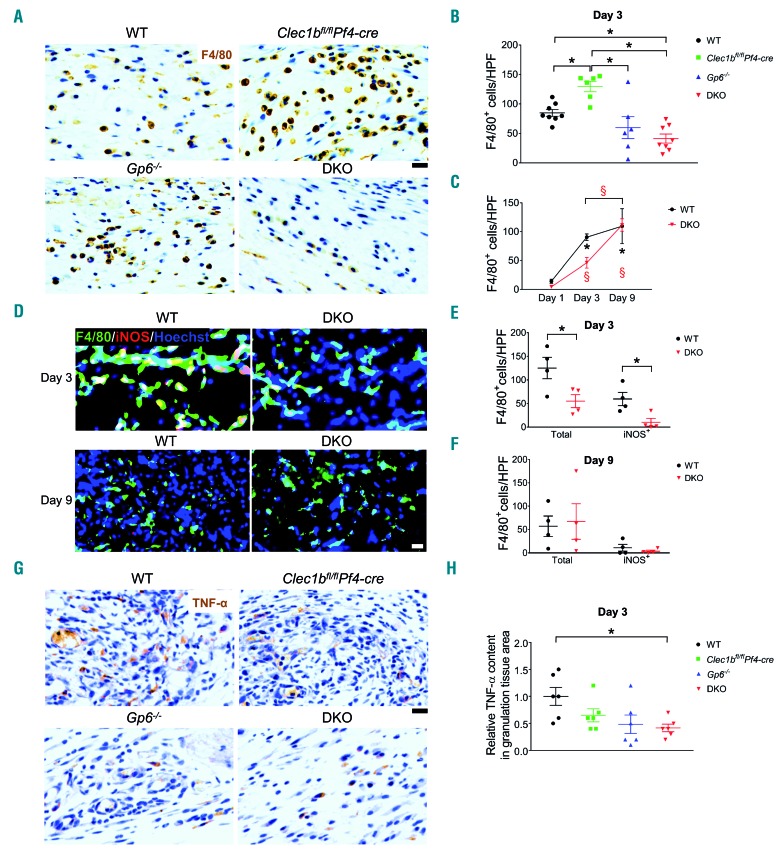
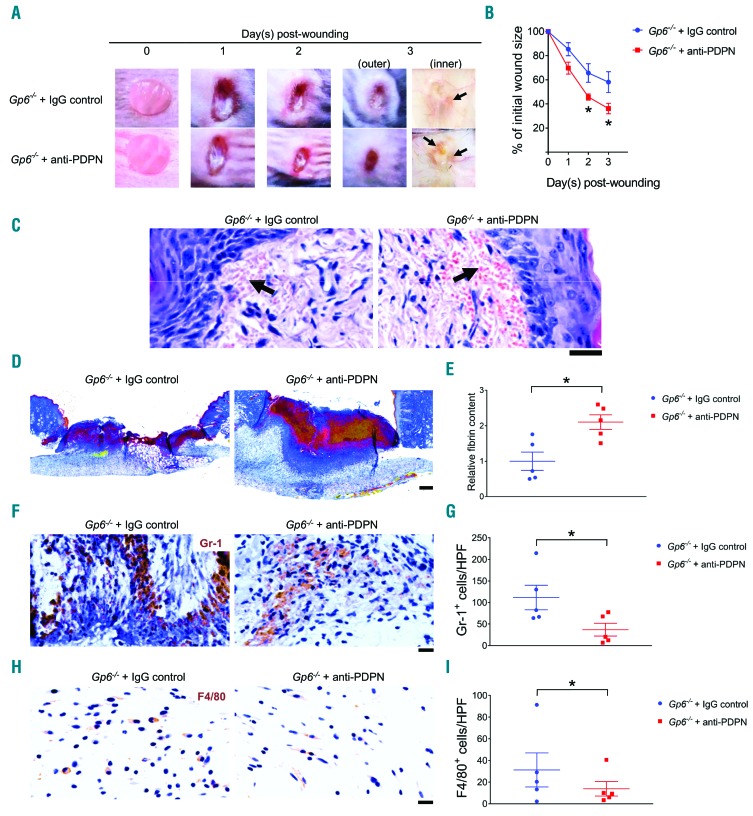
Platelets promote wound healing by forming a vascular plug and by secreting growth factors and cytokines. Glycoprotein (GP)VI and C-type lectin-like receptor (CLEC)-2 signal through a (hem)-immunoreceptor tyrosine-based activation motif, which induces platelet activation. GPVI and CLEC-2 support vascular integrity during inflammation in the skin through regulation of leukocyte migration and function, and by sealing sites of vascular damage. In this study, we investigated the role of impaired vascular integrity due to GPVI and/or CLEC-2 deficiency in wound repair using a full-thickness excisional skin wound model in mice. Transgenic mice deficient in both GPVI and CLEC-2 exhibited accelerated skin wound healing, despite a marked impairment in vascular integrity. The local and temporal bleeding in the skin led to greater plasma protein entry, including fibrinogen and clotting factors, was associated with increased fibrin generation, reduction in wound neutrophils and M1 macrophages, decreased level of tumor necrosis factor (TNF)-α, and enhanced angiogenesis at day 3 after injury. Accelerated wound healing was not due to developmental defects in CLEC-2 and GPVI double-deficient mice as similar results were observed in GPVI-deficient mice treated with a podoplanin-blocking antibody. The rate of wound healing was not altered in mice deficient in either GPVI or CLEC-2. Our results show that, contrary to defects in coagulation, bleeding following a loss of vascular integrity caused by platelet CLEC-2 and GPVI deficiency facilitates wound repair by increasing fibrin(ogen) deposition, reducing inflammation, and promoting angiogenesis.


Figures

Figure 1.
Figure 1.
Podoplanin-expressing cells are present at perivascular area in contact with platelets during skin wound repair. (A) Immunofluorescence staining of NG2 (red), podoplanin (green) and CD41 (white) illustrates platelets and podoplanin-expressing pericytes (NG2+) around blood vessel at day 3 after injury (n=5-7). Hoechst counterstains nuclei (blue). Arrow points to platelets at perivascular site. Star indicates extravascular localization of platelets. Scale bar=20 μm. (B) Podoplanin (green) was double-stained with either vimentin (red; top) or Ly6C (red; middle) or F4/80 (red; bottom), which are located around blood vessel (surrounded by NG2+ pericytes) at day 3 after injury (n=4-5). Scale bar=20 μm. BV: blood vessel.
Figure 2.
Figure 2.
Deletion of platelet immunoreceptor tyrosine-based activation motif (ITAM) receptors accelerates skin wound repair process. Mice were subjected to a full-thickness excisional skin wound and wound closure was monitored for nine days after injury. (A) Macroscopic appearance of wound at indicated time points. (B) Changes of wound size over nine days post injury (n=10-13). (C) Hematoxylin & Eosin staining at day 9 post-injury (n=9-13). a: length of hyperplastic epidermis; b: inter-subcutaneous distance. Scale bar=200 μm. (D) Measurement of the length of hyperplastic epidermis. (E) Measurement of inter-subcutaneous distance. All graphs are presented as mean±Standard Error of Mean (SEM). Kinetics of wound closure (B) are analyzed by two-way ANOVA with Bonferroni’s multiple comparison test. *P<0.05; **P<0.01. *WT versus DKO. +Clec1bfl/flPf4-cre versus DKO. #Gp6−/− versus DKO. Other parameters are analyzed by one-way ANOVA with Bonferroni’s multiple comparison test. *P<0.05.
Figure 3.
Figure 3.
Enhanced re-epithelialization and angiogenesis occur at the early phase of wound healing in the absence of GPVI and CLEC-2. (A) Hematoxylin & Eosin staining at day 3 post-injury (n=6-9). Dotted line indicates hyperplastic coverages. Black arrow points to wound edge. Red arrow indicates gap between epithelial tongues. S: scab; G: granulation tissue. Scale bar=500 μm. (B) Measurement of re-epithelialization. (C) Measurement of wound contraction. (D) Quantification of granulation tissue area. (E) Detection of endothelial cells (CD31+ cells; green) in wound area at day 3 post injury. Hoechst counterstains nuclei (blue). Scale bar=50 μm. (F) Quantification of CD31+ area within the wound at day 3 post injury (n=5-6). Graphs are presented as mean±Standard Error of Mean and analyzed by one-way ANOVA with Bonferroni’s multiple comparison test. *P<0.05.
Figure 4.
Figure 4.
Lack of platelet immunoreceptor tyrosine-based activation motif (ITAM) receptors causes local and temporal bleeding leading to fibrin(ogen) deposition during inflammatory phase of wound repair. (A) Macroscopic images of inner side of skin wound at day 3 post injury (n=4-6). Dotted circle indicates wound area. Arrow points to dilated vessel. Arrowhead shows bleeding into surrounding skin. (B) Fibrinogen staining (brown) of skin wound at day 3 post injury. (C) Quantification of fibrinogen content at day 3 post injury (n=6). (D) Martius scarlet blue (MSB) staining of skin wound at day 3 post-injury. Red: old fibrin; blue: collagen; yellow: red blood cells/fresh fibrin. (E) Quantification of fibrin content in the wound at day 3 post injury (n=6-9). (F) MSB staining of wound scar at day 9 post injury. (G) Quantification of fibrin content in the scar at day 9 post injury (n=9-13). Graphs are presented as mean±Standard Error of Mean and analyzed by one-way ANOVA with Bonferroni’s multiple comparison test. *P<0.05; **P<0.01. Scale bar=200 μm.
Figure 5.
Figure 5.
Neutrophil influx is decreased during the inflammatory phase of wound healing following platelet CLEC-2 and GPVI double-deletion. (A) Detection of neutrophils (Gr-1 staining; brown) in wound at day 3 post injury. (B) Quantification of neutrophils (Gr-1+ cells) in wound at day 3 post injury. *P<0.05; **P<0.01. (C) Comparison of Gr1+ cells between day 1, day 3, and day 9 post injury in wild-type (WT) and DKO mice. P<0.05 in *WT and §DKO mice, compared to the data at day 1 post injury, respectively. The bracket shows P<0.05 for the comparison between day 3 and day 9 post injury in *WT and §DKO mice, respectively. (D) Detection of neutrophils (Gr-1 staining; brown) in wound at day 9 post injury. (E) Quantification of neutrophils (Gr-1+ cells) in wound at day 9 post injury. *P<0.05. (F) Comparison of blood neutrophil counts between baseline, day 3, and day 9 post injury in each mouse strain. P<0.05 in *WT and +Clec1bfl/flPf4-cre mice, compared to their control, respectively. Sample numbers in unchallenged control = 10, day 1 = 5, day 3 = 6-9, and day 9 post injury = 9-13, respectively. Graphs are presented as mean±Standard Error of Mean and analyzed by one-way ANOVA with Bonferroni’s multiple comparison test. Scale bar = 20 μm.
Figure 6.
Figure 6.
A higher number of wound monocytes is observed during the inflammatory phase of repair in mice that lack both GPVI and CLEC-2. (A) Detection of monocytes (Ly6C+ cells; brown) in wound at day 3 post-injury. (B) Quantification of Ly6C+ cells in wound at day 3 post-injury (n=5-7). **P<0.01. (C) Comparison of Ly6C+ cells between day 1, day 3, and day 9 post-injury in WT and DKO mice. The symbols * and § indicate P<0.05 in WT and DKO mice, compared to the data at day 1 post injury, respectively. The bracket shows P<0.05 for the comparison between day 3 and day 9 post injury in §DKO mice. (D) Detection of Ly6C+ cells (brown) in wound at day 9 post injury. (E) Quantification of Ly6C+ cells in wound at day 9 post injury (n=6). *P<0.05; **P<0.01. (F) Comparison of blood monocyte counts between baseline, day 3, and day 9 post injury in each mouse strain. The symbols *, +, #, and § indicate P<0.05 in WT, Clec1bfl/flPf4-cre, Gp6−/−, and DKO mice, compared to their control, respectively. Sample numbers in unchallenged control, n=10; day 1, n=5; day 3, n=6-9; day 9 post injury, n=10-13, respectively. Graphs are presented as mean±Standard Error of Mean and analyzed by one-way ANOVA with Bonferroni’s multiple comparison test. Scale bar = 20 μm.
Figure 7.
Figure 7.
M1 macrophages and TNF-α level are reduced during the inflammatory phase of wound healing in platelet immunoreceptor tyrosine-based activation motif (ITAM) receptor-deficient mice. (A) Detection of macrophages (F4/80+ cells; brown) in wound at day 3 post injury. (B) Quantification of F4/80+ cells in wound at day 3 post injury (n=6-8). *P<0.05; **P<0.01. (C) Comparison of F4/80+ cells between day 1, day 3, and day 9 post injury in wild-type (WT) and DKO mice. The symbols * and § indicate P<0.05 in WT and DKO mice, compared to the data at day 1 post injury, respectively. The bracket shows P<0.05 for the comparison between day 3 and day 9 post injury in §DKO mice. Sample numbers at days post injury: at day 1, n=5; day 3, n=6-9; day 9, n=10-13, respectively. (D) Immunofluorescence double staining of iNOS (red) and F4/80 (green) in the wound of WT and DKO mice at day 3 (n=4) and day 9 (n=4) post injury. Hoechst counterstains nuclei (blue). (E) Quantification of M1 macrophages (iNOS+F4/80+ cells; yellow) at day 3 post injury (n=4). *P<0.05. (F) Quantification of M1 macrophages (iNOS+F4/80+ cells; yellow) at day 9 post injury (n=4). (G) Immunohistochemistry staining of TNF-α (brown) in the wound at day 3 post injury. (H) Quantification of TNF-α level in granulation tissue area at day 3 post injury (n=6). *P<0.05. Graphs are presented as mean±Standard Error of Mean and analyzed by either Student t-test (E, F) or one-way ANOVA with Bonferroni’s multiple comparison test (B, C, and H). Scale bar = 20 μm.
Figure 8.
Figure 8.
Anti-podoplanin antibody injection in Gp6−/− mice (Gp6−/− + anti-PDPN) simulates the accelerated phenotype of skin wound repair observed in DKO mice. (A) Macroscopic appearance of wound at indicated time points. Arrow points to intra-skin bleeding around the wound at day 3 post injury. (B) Changes of wound size over 3 days post injury (n=5). (C) Hematoxylin & Eosin staining at day 3 post-injury (n=5). Arrow points the bleeding into surrounding skin. Scale bar = 20 μm. (D) Martius scarlet blue staining of skin wound at day 3 post injury. Red: old fibrin, blue: collagen, yellow: red blood cells/fresh fibrin. Scale bar = 200 μm. (E) Quantification of fibrin content (red) in the wound at day 3 post injury (n=5). (F) Staining of neutrophils (Gr-1; brown) in wound area at day 3 post injury. (G) Quantification of neutrophils (Gr-1+ cells) in wound area at day 3 post injury (n=5). (H) Detection of macrophages (F4/80 staining; brown) in wound area at day 3 post injury. (I) Quantification of macrophages (F4/80+ cells) in wound area at day 3 post-injury (n=5). All graphs are presented as mean±Standard Error of Mean. Kinetics of wound closure (B) are analyzed by two-way ANOVA with Bonferroni’s multiple comparison test. Other parameters are analyzed by Student t-test. *P<0.05.

Similar articles

Cited by

References

    1. Shaw TJ, Martin P. Wound repair at a glance. J Cell Sci. 2009;122(Pt 18):3209–3213. - PMC - PubMed
    1. Drew AF, Liu H, Davidson JM, Daugherty CC, Degen JL. Wound-healing defects in mice lacking fibrinogen. Blood. 2001;97(12):3691–3698. - PubMed
    1. Hoffman M, Harger A, Lenkowski A, Hedner U, Roberts HR, Monroe DM. Cutaneous wound healing is impaired in hemophilia B. Blood. 2006;108(9):3053–3060. - PubMed
    1. Xu Z, Xu H, Ploplis VA, Castellino FJ. Factor VII deficiency impairs cutaneous wound healing in mice. Mol Med. 2010; 16(5-6):167–176. - PMC - PubMed
    1. Monroe DM, Mackman N, Hoffman M. Wound healing in hemophilia B mice and low tissue factor mice. Thromb Res. 2010;125 Suppl 1:S74–77. - PMC - PubMed

Publication types

MeSH terms

LinkOut - more resources