

Interpreting contemporary trends in atmospheric methane
- PMID: 30733299
- PMCID: PMC6386658
- DOI: 10.1073/pnas.1814297116
Interpreting contemporary trends in atmospheric methane
Abstract
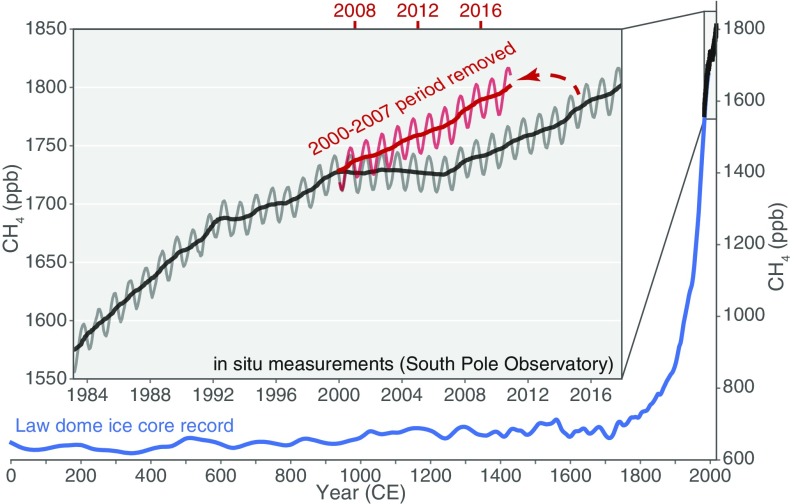
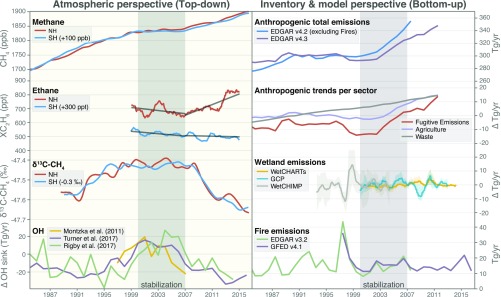
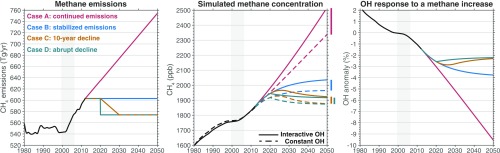
Atmospheric methane plays a major role in controlling climate, yet contemporary methane trends (1982-2017) have defied explanation with numerous, often conflicting, hypotheses proposed in the literature. Specifically, atmospheric observations of methane from 1982 to 2017 have exhibited periods of both increasing concentrations (from 1982 to 2000 and from 2007 to 2017) and stabilization (from 2000 to 2007). Explanations for the increases and stabilization have invoked changes in tropical wetlands, livestock, fossil fuels, biomass burning, and the methane sink. Contradictions in these hypotheses arise because our current observational network cannot unambiguously link recent methane variations to specific sources. This raises some fundamental questions: (i) What do we know about sources, sinks, and underlying processes driving observed trends in atmospheric methane? (ii) How will global methane respond to changes in anthropogenic emissions? And (iii), What future observations could help resolve changes in the methane budget? To address these questions, we discuss potential drivers of atmospheric methane abundances over the last four decades in light of various observational constraints as well as process-based knowledge. While uncertainties in the methane budget exist, they should not detract from the potential of methane emissions mitigation strategies. We show that net-zero cost emission reductions can lead to a declining atmospheric burden, but can take three decades to stabilize. Moving forward, we make recommendations for observations to better constrain contemporary trends in atmospheric methane and to provide mitigation support.
Keywords: greenhouse gas mitigation; methane trends; tropospheric oxidative capacity.
Copyright © 2019 the Author(s). Published by PNAS.
Conflict of interest statement
The authors declare no conflict of interest.
Figures
References
-
- IPCC 2013. Climate change 2013: The physical science basis. Contribution of Working Group I to the Fifth Assessment Report of the Intergovernmental Panel on Climate Change, (IPCC, Cambridge Univ Press, New York), Technical Report.
-
- Kirschke S, et al. Three decades of global methane sources and sinks. Nat Geosci. 2013;6:813–823.
-
- Saunois M, et al. The global methane budget 2000–2012. Earth Syst Sci Data. 2016;8:697–751.
-
- Etheridge DM, Steele LP, Francey RJ, Langenfelds RL. Atmospheric methane between 1000 A.D. and present: Evidence of anthropogenic emissions and climatic variability. J Geophys Res. 1998;103:15979–15993.
-
- Blake DR, et al. Global increase in atmospheric methane concentrations between 1978 and 1980. Geophys Res Lett. 1982;9:477–480.
Publication types
LinkOut - more resources
Full Text Sources
Other Literature Sources
