. 2019 Feb 7;9(1):1545.
doi: 10.1038/s41598-018-38058-5.

Control of heart rate through guided high-rate breathing

Affiliations

Control of heart rate through guided high-rate breathing

Sean Perry et al. Sci Rep. .

Abstract

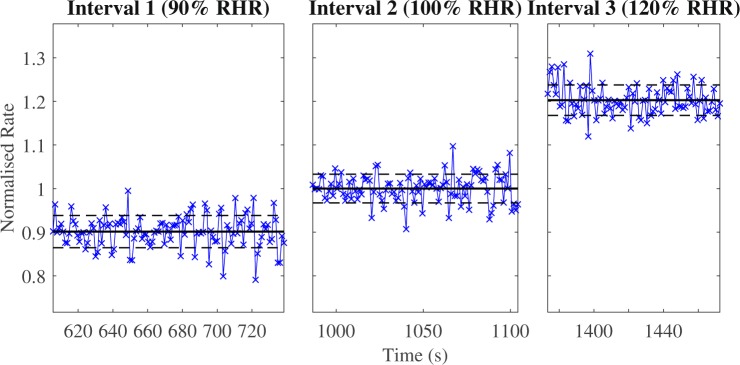
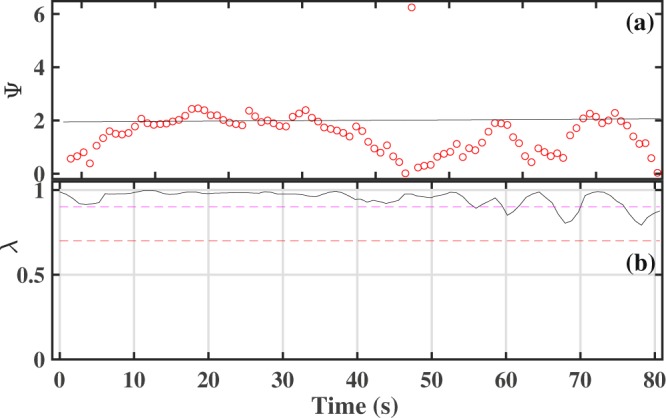
Understanding the complex dynamics of cardio-respiratory coupling sheds light on the underlying mechanisms governing the communication between these two physiological systems. Previous research has predominantly considered the coupling at respiratory rates slower than the heart rate and shown that respiratory oscillations lead to modulation and/or synchronization of the heart rate. Whereas the mechanisms of cardio-respiratory communication are still under discussion, peripheral nervous regulation is considered to be the predominant factor. This work offers a novel experimental design and applies the concept of instantaneous phase to detect cardio-respiratory entrainment at elevated respiration rates, close to the resting heart rate. If such 1:1 entrainment exists, it would suggest direct neuronal communication between the respiration and heart centres in the brain. We have observed 1:1 entrainment in all volunteers, with consistently longer synchronization episodes seen in physically fitter people, and demonstrated that cardio-respiratory synchronization at both low and high respiration rates is associated with a common underlying communication mechanism.


Conflict of interest statement

The authors declare no competing interests.

Figures

Figure 1
Figure 1
Instantaneous breathing rate (blue) and heart rate (red) are shown from data for volunteer 11. Regions of guided breathing are shaded. Markers ‘x’ and ‘+’ correspond to maxima in respiratory signal and R-peaks in ECG signal respectively. Not all of the 10-minute rest interval at the beginning is shown, as this data is not explicitly analysed in this article.
Figure 2
Figure 2
Instantaneous breathing rates, normalised by the mean breathing rate of interval 2, are shown by marker ‘x’. The dashed black lines represent the standard deviation of the rate, while the solid black line is the mean breathing rate for that interval. Assuming a volunteer follows the metronome well, the range between standard deviation lines will be small. The normalisation demonstrates the proportional rate of breathing relative to RHR. Data from volunteer 11.
Figure 3
Figure 3
Trends in heart rate during the intervals of guided breathing. Black curves correspond to the trends. Red lines specify the mean value (solid line) and standard deviation (dashed lines) of the breathing rate for each interval. All data normalised by the mean breathing rate of interval 2. The intended heart rate response should mean the black curve falls within the red dashed lines for as much of the interval as possible. Data from volunteer 11.
Figure 4
Figure 4
Synchrogram for volunteer 11. Shaded regions correspond to the regions of guided breathing. Phase Ψ is shown in radians.
Figure 5
Figure 5
Synchronization measures for volunteer 2 (left) and volunteer 3 (right). Figures (a,e) show the phase difference, figures (b,f) show the synchronization index, figures (c,g) show the synchrogram, and figures (d,h) show smoothed heart (black line) and respiratory (blue line) rates. In figures (d,h) red lines specify the mean value (solid line) and standard deviation (dashed lines) of the breathing rate for each interval.
Figure 6
Figure 6
Phase differences φ for three guided breathing intervals are shown for volunteer 2. Blue, red and green curves correspond to the first (90% RHR), second (100% RHR) and third (120% RHR) intervals respectively. Phase differences are normalized by 2π.
Figure 7
Figure 7
Synchrogram (a) and synchronization index (b) for surrogate data; the mean is 70 BPM and the standard deviation is 3%. Red and magenta dashed lines correspond to λ = 0.7 and λ = 0.9 respectively.
Figure 8
Figure 8
Probability density p(Ψ) for experimental data is shown in a bar chart. Phase Ψ is shown in radians.

References

    1. Hayano J, Yasuma F, Okada A, Mukai S, Fujinami T. Respiratory sinus arrhythmia: a phenomenon improving pulmonary gas exchange and circulatory efficiency. Circulation. 1996;94:842–847. doi: 10.1161/01.CIR.94.4.842. - DOI - PubMed
    1. OpenStax, Anatomy and Physiology, Houston, Texas: OpenStax College (2013).
    1. Eckberg D. Point: respiratory sinus arrhythmia is due to a central mechanism. J. Appl. Physiol. 2009;106:1740–1742. doi: 10.1152/japplphysiol.91107.2008. - DOI - PubMed
    1. Karemaker J. Counterpoint: Respiratory sinus arrhythmia is due to the baroreflex mechanism. J. Appl. Physiol. 2009;106:1742–1743. doi: 10.1152/japplphysiol.91107.2008a. - DOI - PubMed
    1. Farmer DGS, Dutschmann M, Paton JFR, Pickering AE, McAllen RM. Brainstem sources of cardiac vagal tone and respiratory sinus arrhythmia. J. Physiol. 2016;594(24):7249–7265. doi: 10.1113/JP273164. - DOI - PMC - PubMed

Publication types